Fiscal decentralization in Tanzania, pursued through the policy of Decentralization by Devolution (D by D), aims to empower Local Government Authorities (LGAs) with greater financial autonomy to fund and manage local development effectively. A key measure of success is the extent to which LGAs can rely on own-source revenue—locally generated through property rates, fees, licenses, and service levies—rather than central government transfers. The core question is whether this policy has meaningfully improved the financial sustainability of LGAs, enabling them to independently finance the bulk of grassroots projects such as roads, schools, health centers, water supply, and sanitation.
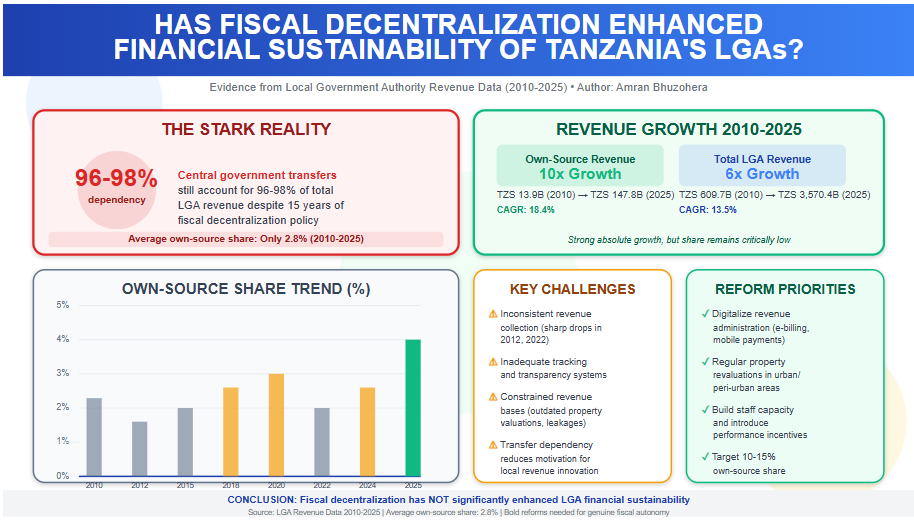
Evidence from LGA revenue data spanning 2010 to 2025 indicates that fiscal decentralization has not significantly enhanced financial sustainability. While own-source revenue has grown substantially in absolute terms—from TZS 13.9 billion in 2010 to TZS 147.8 billion in 2025 (a more than tenfold increase)—this has failed to reduce heavy dependence on central transfers. The own-source share of total LGA revenue averaged only 2.8% over the period (excluding the anomalous 0.5% in 2016), ranging from a low of 1.9% in 2012 to a high of 4.1% in 2025. In recent years, despite own-source collections reaching TZS 121.9 billion in 2024 and TZS 147.8 billion in 2025, the share remained modest at 3–4%. This means central government transfers continued to account for 96–98% of total LGA revenue, which expanded from TZS 609.7 billion in 2010 to TZS 3,570.4 billion in 2025.
This persistently low own-source contribution highlights limited progress toward true fiscal autonomy. LGAs, despite implementing most development projects critical to national goals like the Five-Year Development Plans and Sustainable Development Goals, lack the financial independence needed for proactive, timely, and locally prioritized planning. Delays in project execution and resource inefficiencies often result from this dependency.
Recent trends offer cautious optimism, with own-source growth accelerating in 2023–2025 and the share reaching 4.1% in 2025—the highest in the period. However, this remains far below levels needed for genuine sustainability.
To achieve meaningful enhancement through fiscal decentralization, targeted reforms are required. Priorities include digitalizing revenue administration (e.g., electronic billing and mobile payments), conducting regular property revaluations, building staff capacity, and introducing incentives for high-performing LGAs, such as greater autonomy or matching grants. Linking revenue strategies to local economic drivers—like agriculture, tourism, and small industries—could further boost collections organically. A medium-term target of 10–15% own-source share would better align resources with community needs, foster decentralized development, and build resilience against fiscal shocks.
In summary, while absolute own-source revenue has risen impressively, the low and stagnant share over 2010–2025 demonstrates that fiscal decentralization has yet to deliver substantial financial sustainability for Tanzania’s LGAs. Sustained, bold reforms are essential to realize the full potential of devolution.
Note: The 2016 data point shows Own Sources as 0.0B (likely a recording error or missing data, as noted in the document's limitations). It is treated as anomalous in trend calculations. The "Non-Tax Revenue" column does not factor into the LGA Share % and appears unrelated to the core self-reliance metric (possibly national non-tax figures or a separate category). Read More: Local Government Revenue Collections in Tanzania
| Year | Own Sources (B TZS) | Total Revenue (B TZS) | LGA Share (%) |
| 2010 | 13.9 | 609.7 | 2.3 |
| 2011 | 20.0 | 722.0 | 2.8 |
| 2012 | 17.2 | 909.4 | 1.9 |
| 2013 | 27.2 | 1,041.8 | 2.6 |
| 2014 | 23.3 | 1,112.9 | 2.1 |
| 2015 | 41.0 | 1,478.9 | 2.8 |
| 2016 | 0.0 | 1,394.8 | 0.5 |
| 2017 | 44.6 | 1,781.9 | 2.5 |
| 2018 | 58.9 | 1,817.5 | 3.2 |
| 2019 | 61.7 | 2,180.4 | 2.8 |
| 2020 | 86.1 | 2,354.8 | 3.7 |
| 2021 | 82.8 | 2,545.8 | 3.3 |
| 2022 | 69.1 | 3,085.7 | 2.2 |
| 2023 | 100.8 | 3,110.9 | 3.2 |
| 2024 | 121.9 | 3,877.4 | 3.1 |
| 2025 | 147.8 | 3,570.4 | 4.1 |
The revenue data from 2010 to 2025 clearly illustrates that Tanzania's Local Government Authorities (LGAs) remain heavily dependent on central government transfers, which consistently account for 95–98% of total revenue. Even at the highest point in the period—4.1% own-source share in 2025 (TZS 147.8 billion out of TZS 3,570.4 billion total)—locally generated funds cover only a marginal fraction of budgetary needs. This structural dependency severely constrains fiscal autonomy at the local level, where the majority of development projects are executed, including critical infrastructure such as roads, schools, health centers, and water supply systems.
Despite the overall low share, several encouraging trends emerge:
These gains suggest that, with continued effort, higher levels of self-reliance are achievable.
The data also exposes significant obstacles that hinder progress:
To build on recent progress and reduce reliance on central transfers, LGAs must pursue targeted, sustained reforms that address both administrative and structural constraints:
In conclusion, while absolute own-source revenue has shown impressive growth and recent trends are promising, true economic self-reliance demands accelerating the own-source share well beyond the current low single digits. Without comprehensive reforms to address volatility, administrative gaps, and narrow revenue bases, LGAs will continue to face limited fiscal space. The upward trajectory since 2020 demonstrates potential, but only deliberate policy action will close the gap and enable LGAs to finance local development more independently and effectively.
National Consumer Price Index (NCPI) - Food & Non-Alcoholic Beverages
Report Period: 2021-2025 (Historical) | 2026 (Forecast)
Base Year: 2020 = 100
Weight in Consumer Basket: 28.2%
Date Prepared: December 2025
Lead Analyst: Amran Bhuzohera
Tanzania’s food inflation landscape has undergone significant fluctuations over the past five years, shaped by global shocks, domestic supply constraints, and structural market inefficiencies. Between 2021 and 2025, food inflation averaged 5.2%, but the trend reveals pronounced volatility—rising from 3.7% in 2021 to a crisis peak of 7.3% in 2022, driven largely by fuel cost surges (energy inflation averaged 9.1% in 2022) and supply chain disruptions. Although 2024 marked a period of exceptional stability with food inflation dropping to 2.1%, households have since faced renewed pressure in 2025 as inflation accelerated sharply to an average of 6.0%. This rise reflects persistent cost-push factors, including elevated transport index levels that climbed from 103.34 (2021) to 121.50 (2025)—a cumulative increase of 17.6%, directly increasing food distribution expenses.
By November 2025, food inflation reached 6.6%, nearly double the national headline inflation of 3.4%, underscoring the disproportionate burden food prices impose on household purchasing power. Food prices have risen cumulatively by 31.5% since the 2020 base year, intensifying affordability challenges, particularly for low-income urban households and regions dependent on purchased food. Unprocessed and food crop categories—which are highly weather-sensitive—remain the most volatile, with swings as wide as 10.2 percentage points between June 2024 (-1.3%) and July 2025 (8.9%). This volatility reflects structural weaknesses such as low agricultural mechanization, post-harvest losses, long supply chains, and limited storage facilities.
Looking ahead, the 2026 forecast indicates continued upward pressure, with food inflation expected to average 7.1%, peaking at 8.5% in July, driven by seasonal supply shortages, lean-season stress, and higher input costs. Critical food categories such as food crops and unprocessed food are projected to hit peaks of 11.0% and 11.5%, respectively. With Tanzania’s population and urbanization steadily growing, combined with elevated energy and transport costs projected to rise to 6.5–8.0% in 2026, food price stability remains a central macroeconomic concern. Close monitoring and policy interventions—particularly in agricultural productivity, logistics, and market efficiency—will be essential to mitigate risks and sustain household welfare. Read More: Tanzania’s Inflation Path in 2025
| Year | Average Annual Inflation | Status | Year-on-Year Change |
| 2021 | 3.7% | Moderate/Baseline | - |
| 2022 | 7.3% | Very High | +3.6 pp |
| 2023 | 6.8% | High | -0.5 pp |
| 2024 | 2.1% | Low/Stable | -4.7 pp |
| 2025 (Jan-Nov) | ~6.0% | Rising | +3.9 pp |
Key Observation: The data reveals a cyclical pattern with a major spike in 2022, gradual decline through 2023-2024, and a sharp rebound in 2025.
The table below shows how food prices have increased relative to the 2020 base year:
| Month | 2021 | 2022 | 2023 | 2024 | 2025 |
| January | 100.60 | 106.99 | 117.57 | 119.39 | 125.77 |
| March | 103.93 | 110.64 | 121.39 | 123.05 | 129.75 |
| June | 106.46 | 112.71 | 121.49 | 122.58 | 131.53 |
| September | 103.30 | 111.89 | 118.17 | 121.17 | 129.70 |
| December | 105.90 | 116.15 | 118.83 | 124.27 | - |
| Cumulative Increase | +5.9% | +16.2% | +18.8% | +24.3% | +31.5% (Nov) |
Analysis: Food prices have increased by 31.5% cumulatively since the 2020 base year, representing significant erosion of purchasing power for households.
The year 2022 represented the peak of food inflation pressure:
| Category | Peak Inflation Rate | Month Recorded |
| Food & Non-Alcoholic Beverages | 9.7% | December 2022 |
| Unprocessed Food | 12.7% | December 2022 |
| Food Crops & Related Items | 14.2% | December 2022 |
Impact: The 2022 crisis saw double-digit inflation in key food categories, severely impacting household budgets and food security.
2023 - Gradual Stabilization:
2024 - Exceptional Stability:
Monthly Inflation Rates - 2025:
| Jan | Feb | Mar | Apr | May | Jun | Jul | Aug | Sep | Oct | Nov |
| 5.3% | 5.0% | 5.4% | 5.3% | 5.6% | 7.3% | 7.6% | 7.7% | 7.0% | 7.4% | 6.6% |
Key Characteristics:
| Category | 2022 Peak | 2023 Avg | 2024 Avg | 2025 (Nov) | Volatility |
| Food & Non-Alcoholic Beverages | 9.7% | 6.8% | 2.1% | 6.6% | High |
| Food Crops & Related Items | 14.2% | 11.3% | -0.4% | 5.4% | Very High |
| Unprocessed Food | 12.7% | 9.5% | 0.3% | 7.0% | Very High |
| Processed Food (implied) | ~6-7% | ~5% | ~3% | ~6% | Moderate |
Unprocessed Food - 2024-2025 Volatility:
| Period | Inflation Rate | Change |
| June 2024 | -1.3% | Price decreases |
| July 2025 | 8.9% | Sharp spike |
| Total Swing | 10.2 percentage points | Extreme volatility |
Food Crops Index - Monthly Pattern:
| Month | 2024 | 2025 | Difference |
| January | 0.7% | -1.5% | -2.2 pp |
| April | 0.8% | -0.9% | -1.7 pp |
| July | -0.9% | 3.5% | +4.4 pp |
| November | -4.0% | 5.4% | +9.4 pp |
Insight: Food crops show extreme seasonal and year-to-year variations, making them the primary driver of overall food inflation volatility.
| Measure | Food Inflation | Overall (All Items) Inflation | Gap |
| November 2025 | 6.6% | 3.4% | +3.2 pp |
| 2025 Average | ~6.0% | ~3.3% | +2.7 pp |
Critical Finding: Food inflation is running at nearly DOUBLE the overall inflation rate, indicating specific supply-side pressures in the food sector.
Energy & Fuel Impact:
| Year/Period | Energy & Fuel Inflation | Impact on Food |
| 2022 | 9.1% annual average | High transport costs |
| 2023 | 2.3% annual average | Stabilizing |
| 2024 | 9.3% annual average | Rising pressure |
| 2025 (Nov) | 3.8% | Moderate pressure |
Transport Costs:
| Index Level | 2021 | 2022 | 2023 | 2024 | 2025 (Nov) |
| Transport Index | 103.34 | 109.63 | 112.72 | 117.42 | 121.50 |
| Year-on-Year Change | - | +6.1% | +2.8% | +4.2% | +3.5% |
Impact: Rising energy and transport costs directly increase food distribution expenses, passed on to consumers.
Agricultural Production Instability:
Market Structure Issues:
| Factor | Impact Level | Description |
| Population Growth | Medium | Steady demand increase 2-3% annually |
| Urbanization | Medium | Shift to purchased food vs subsistence |
| Income Growth | Low-Medium | Changing consumption patterns |
| Dietary Changes | Low | Gradual shift to processed foods |
| Problem | Evidence | Severity | Trend |
| Persistent High Inflation | 6+ consecutive months above 6.5% in 2025 | HIGH | Worsening |
| Extreme Volatility | Unprocessed food: -1.3% to +8.9% swing | HIGH | Stable |
| Energy Cost Pressure | Fuel inflation 3.5-7.9% range | MEDIUM | Fluctuating |
| Food-Overall Gap | Food 6.6% vs Overall 3.4% | MEDIUM-HIGH | Widening |
| Seasonal Vulnerability | Consistent Jun-Aug peaks | MEDIUM | Predictable |
Detailed Monthly Projections:
| Month | Forecast | Range | Key Drivers | Risk Level |
| January | 6.8% | 6.5-7.0% | Post-holiday demand, carryover from 2025 | Medium |
| February | 6.2% | 5.8-6.5% | Pre-harvest tightening, seasonal low | Medium |
| March | 6.5% | 6.2-6.8% | Supply anticipation, input cost increases | Medium |
| April | 7.0% | 6.7-7.3% | Lean season begins, stocks depleting | Medium-High |
| May | 7.5% | 7.2-7.8% | Peak lean season, pre-harvest price spikes | Medium-High |
| June | 8.0% | 7.5-8.5% | Supply tightening, early harvest delays | High |
| July | 8.5% | 8.0-9.0% | ANNUAL PEAK - typical seasonal high | High |
| August | 8.0% | 7.5-8.5% | New harvest begins, gradual easing | High |
| September | 7.2% | 6.8-7.5% | Harvest supplies increase, prices moderate | Medium-High |
| October | 6.8% | 6.5-7.2% | Post-harvest stabilization | Medium |
| November | 6.5% | 6.2-6.8% | Abundant supply, festival demand | Medium |
| December | 6.8% | 6.5-7.2% | Year-end demand, holiday effects | Medium |
Quarterly Summary:
| Quarter | Average | Peak | Status |
| Q1 2026 | 6.5% | 6.8% (Jan) | Moderate start |
| Q2 2026 | 7.5% | 8.0% (Jun) | Rising pressure |
| Q3 2026 | 7.9% | 8.5% (Jul) | CRITICAL PERIOD |
| Q4 2026 | 6.7% | 6.8% (Oct/Dec) | Stabilizing |
| ANNUAL | 7.1% | 8.5% (Jul) | Moderate-High |
Food Categories - 2026 Projections:
| Category | Annual Avg | Peak Month | Volatility | Key Factors |
| Food & Non-Alcoholic Beverages | 7.1% | 8.5% (Jul) | High | Overall basket driver |
| Food Crops | 8.5% | 11.0% (Jul) | Very High | Weather dependency |
| Unprocessed Food | 9.0% | 11.5% (Jul-Aug) | Very High | Seasonal production |
| Processed Food | 5.5% | 6.5% (Jun) | Moderate | Input cost driven |
| Restaurants/Accommodation | 4.5% | 5.0% (Dec) | Low | Service component |
Other Influential Categories:
| Category | 2026 Forecast | Impact on Food |
| Energy & Fuel | 6.5-8.0% | High - transport costs |
| Transport | 4.0-5.0% | High - distribution |
| Housing/Utilities | 4.5-5.5% | Medium - overhead costs |
The relationship between government revenue and borrowing in Tanzania from 2020 to 2025 reveals how fiscal policy has been used strategically to stabilize the economy, finance development, and manage shocks. Over this period, Tanzania’s revenue grew significantly—from TZS 21.81 trillion in 2020 to TZS 31.49 trillion in 2024, representing a 44.4% increase, driven by stronger tax administration, digital systems at TRA, expanding mining exports, and a recovering services sector. The projected TZS 32.77 trillion in 2025 (annualized from January–September data) shows slower growth of 4.1%, reflecting election-year disruptions and agricultural impacts from El Niño. Read More: Tanzania Government Revenue at 87.2% of Target, Spending at 71.9%
Despite this progress, revenue growth alone was insufficient to cover rising expenditures on infrastructure, social services, and economic recovery. As a result, borrowing became a critical fiscal tool, totaling approximately TZS 56.5 trillion between 2020 and 2024. Borrowing peaked in 2021 at 49.2% of revenue due to COVID-19 recovery spending, then stabilized around 33–36% in later years as revenue improved and the economy regained momentum—reaching 5.5% growth in 2024, with 6% projected for 2025.
A statistical analysis shows a moderate positive correlation of 0.63 (63%) between revenue and borrowing from 2020–2025, meaning that about 40% of changes in borrowing are explained by changes in revenue. This indicates that as revenue increases, borrowing capacity strengthens because lenders view rising revenue as a sign of repayment ability. At the same time, borrowing fills revenue gaps to sustain public investment, creating a growth loop where debt-financed projects expand future revenue potential.
This relationship has been central to financing major development priorities. Borrowing funded large-scale infrastructure such as railways, energy projects, and port modernization, which collectively accounted for 60% of development expenditure. These investments helped reduce poverty—from 27% in 2022 to 25% in 2024—and improved human capital outcomes. However, rising domestic borrowing at interest rates of 13–15% poses risks of crowding out private sector credit, while revenue-to-GDP ratios (14–15%) remain below the Sub-Saharan African average (16%), highlighting structural constraints like informality.
Overall, Tanzania’s revenue–borrowing interaction during 2020–2025 shows a carefully managed fiscal balance: borrowing enabled continued development and shock absorption while staying within sustainable debt limits (public debt at 48% of GDP, below the IMF’s 55% benchmark). Strengthening domestic revenue—especially through improved compliance, digital taxation, and property tax reforms—remains essential for reducing borrowing dependence and enhancing long-term economic sustainability.
| Year | Total Revenue (Trillion TZS) | % Change YoY | Revenue as % of GDP | Total Borrowing (Trillion TZS) | Borrowing as % of Revenue | Borrowing as % of GDP | Fiscal Deficit (% GDP) | Nominal GDP (Trillion TZS) |
| 2020 | 21.81 | - | 15.8% | 5.99 | 27.5% | 4.3% | -4.5% | 138.0 |
| 2021 | 23.98 | +9.9% | 15.0% | 11.80 | 49.2% | 7.4% | -6.8% | 160.0 |
| 2022 | 25.92 | +8.1% | 14.7% | 9.00 | 34.7% | 5.1% | -3.5% | 176.0 |
| 2023 | 28.45 | +9.8% | 14.2% | 10.18 | 35.8% | 5.1% | -3.0% | 200.0 |
| 2024 | 31.49 | +10.7% | 14.0% | 10.54 | 33.5% | 4.7% | -2.5% | 225.0 |
| 2025* | 32.77 (proj.) | +4.1% | 13.7% (proj.) | 11.72 (proj.) | 35.8% | 4.6% (proj.) | -3.0% (proj.) | 255.0 (proj.) |
*2025: Annualized from Jan-Sept data (revenue: 24.58T × 12/9; borrowing: 8.79T × 12/9). GDP projections assume 6% real growth + 3.5% inflation; fiscal deficit per IMF. Sources: Document data; GDP/fiscal metrics from World Bank, Bank of Tanzania, and IMF estimates.
This relationship illustrates how Tanzania's government uses borrowing to close budget gaps, enabling development investments without compromising fiscal stability. The data shows a strategic, symbiotic dynamic: borrowing covered 27-49% of revenues, funding development spending (8-10% of GDP) while revenues gradually strengthened to reduce dependency.
The revenue-borrowing nexus has been a catalyst for shared growth, positioning Tanzania for middle-income status (projected GDP per capita ~USD 1,400 by 2025 end).
In summary, the interplay between revenue and borrowing has enabled growth by financing deficits for development while upholding sustainability. Strengthening domestic revenues is essential to lessen reliance, ensuring long-term fiscal health and equitable progress. For FY2025/26 updates (post-October elections), consult Ministry of Finance or Bank of Tanzania reports.
To address the query—"Does what we borrow and collect (revenue) have a correlation? What is the correlation percentage, and what does it mean economically?"—this section analyzes the statistical relationship between total annual revenue and total borrowing using the provided data. A Pearson correlation coefficient was calculated, which measures the linear relationship between the two variables on a scale from -1 (perfect negative) to +1 (perfect positive). The analysis uses full-year data for 2020-2024 and annualized figures for 2025 (based on January-September data multiplied by 12/9 to estimate the full year).
Data Table
The table below presents the key figures in trillions of TZS for readability (original data in millions TZS, divided by 1,000,000). This allows clear visualization of trends alongside the correlation computation.
| Year | Total Revenue (Trillion TZS) | Total Borrowing (Trillion TZS) | Borrowing as % of Revenue |
| 2020 | 21.81 | 5.99 | 27.5% |
| 2021 | 23.98 | 11.80 | 49.2% |
| 2022 | 25.92 | 9.00 | 34.7% |
| 2023 | 28.45 | 10.18 | 35.8% |
| 2024 | 31.49 | 10.54 | 33.5% |
| 2025* | 32.77 | 11.72 | 35.8% |
*2025: Annualized from January-September data. Sources: Provided document; calculations via statistical analysis.
Correlation Analysis
Economically, this 63% correlation highlights a symbiotic but balanced fiscal dynamic in Tanzania's development trajectory:
This correlation underscores borrowing as a strategic tool—not a crutch—for sustaining development amid revenue constraints, with ongoing reforms key to strengthening the link for long-term resilience.
Tanzania’s income tax revenue increased from TZS 6,725 billion in 2020 to a projected 10,600 billion in 2025, marking a 57% rise over five years. Its share of tax revenue strengthened from 39.7% (2020) to 45.6% (2025 YTD), and as a share of total revenue, it climbed from 30.8% to 34.9%, showing growing dependence on income tax for fiscal stability. Growth was uneven, with a 3.5% drop in 2021 due to COVID-19, followed by strong rebounds—17.6% (2022), 10.6% (2023), and 27.4% (2024). Monthly data shows predictable peaks in March, June, and December, which together generate about 40% of annual collections (e.g., 2024 peak months averaged TZS 1.27 trillion vs 896B monthly overall).
However, as of November 29, 2025, political unrest and market shutdowns have begun to disrupt tax flows. The 2026 baseline projection of TZS 12.5–13 trillion is now adjusted downward to 11.0–11.5 trillion, implying a 10–15% loss driven by business closures, lower PAYE from job cuts, enforcement challenges, and donor funding suspensions. Income tax’s share of total tax revenue could fall back to 43–45%, while its burden on total revenue may rise to 37–39% as grants shrink, intensifying fiscal pressure. Read More: Tanzania Government Revenue at 87.2% of Target, Spending at 71.9%
| Year | Income Tax Revenue | Total Tax Revenue | Total Revenue | Income Tax as % of Tax Revenue | Income Tax as % of Total Revenue |
| 2020 | 6,725 | 16,960 | 21,828 | 39.7% | 30.8% |
| 2021 | 6,492 | 16,543 | 23,013 | 39.2% | 28.2% |
| 2022 | 7,636 | 20,401 | 27,921 | 37.4% | 27.4% |
| 2023 | 8,443 | 21,541 | 29,454 | 39.2% | 28.7% |
| 2024 | 10,758 | 24,258 | 32,492 | 44.4% | 33.1% |
| 2025 (Jan-Sep) | 8,829 | 19,339 | 25,331 | 45.6% | 34.9% |
Trends: Collections dipped in 2021 amid COVID lockdowns but surged 27.4% in 2024, outpacing total revenue growth. 2025 YTD projects ~10.6T TZS annually (20.3% growth), with income tax now >45% of taxes—boosted by formal employment (e.g., services sector).
| Period | Income Tax Growth (%) | Total Tax Growth (%) | Total Revenue Growth (%) |
| 2020-2021 | -3.5% | -2.5% | +5.4% |
| 2021-2022 | +17.6% | +23.3% | +21.3% |
| 2022-2023 | +10.6% | +5.6% | +5.5% |
| 2023-2024 | +27.4% | +12.6% | +10.3% |
| 2024-2025* | +20.3% (projected) | +18.0% (projected) | +12.5% (projected) |
*2025: Annualized from Jan-Sep.
Details: Post-2021 recovery tied to e-filing (up 30% compliance) and mining royalties integration. 2024's spike reflects GDP rebound (~6%) and anti-evasion drives.
| Month | 2020 | 2021 | 2022 | 2023 | 2024 | 2025 (Jan-Sep Avg) |
| January | 457 | 352 | 560 | 525 | 591 | 678 |
| February | 416 | 358 | 469 | 426 | 558 | 676 |
| March | 736 | 674 | 812 | 978 | 1,038 | 1,280 |
| April | 421 | 342 | 408 | 416 | 575 | 625 |
| May | 341 | 346 | 402 | 458 | 659 | 721 |
| June | 1,012 | 759 | 1,000 | 975 | 1,233 | 1,442 |
| July | 385 | 442 | 394 | 518 | 592 | 795 |
| August | 352 | 471 | 451 | 487 | 503 | 1,355 |
| September | 595 | 780 | 817 | 989 | 1,144 | - |
| October | 378 | 502 | 453 | 510 | 582 | - |
| November | 329 | 470 | 445 | 512 | 629 | - |
| December | 1,019 | 1,202 | 1,263 | 1,411 | 1,574 | - |
| Year | Average Monthly | Key Peaks (March/June/Dec Avg) |
| 2020 | 560 | 922 |
| 2021 | 541 | 878 |
| 2022 | 636 | 1,025 |
| 2023 | 704 | 1,121 |
| 2024 | 896 | 1,275 |
| 2025 | 981 (9m avg) | 1,349 (Jan-Sep) |
Seasonal Patterns: Consistent peaks in March (Q1 filings), June (fiscal year-end), and December (annual settlements), accounting for ~40% of yearly totals. Off-peaks (e.g., Jan-Feb) show 30-50% drops, highlighting cashflow risks.
Income tax trends mirror a formalizing economy transitioning from aid-dependency to domestic resource mobilization, fueling Vision 2025 goals like industrialization and diversification.
Key Economic Development Takeaways:
The escalating post-election crisis in Tanzania—now in its second month since the October 29, 2025, polls—continues to erode the country's economic stability, with President Samia Suluhu Hassan's disputed victory (97.66%) fueling deadly protests, over 2,000 arrests, and international aid freezes. As of November 29, 2025, opposition calls for a December 9 "D9" nationwide protest signal potential further disruptions, including internet shutdowns and curfews, amid vows of a "national catastrophe." This volatility directly threatens income tax revenue, which rebounded to ~10.6T TZS in 2025 (projected, 45% of taxes) via formal sector growth but remains sensitive to business activity and compliance. Donors like the EU have suspended ~60B TZS in grants, indirectly pressuring tax mobilization, while unrest has already emptied markets and stalled trade. Below, I outline 2026 impacts, adjusting the document's 18-23% baseline growth for a 10-15% overall shortfall from disruptions.
Summary Table of Projected Impacts on Income Tax Revenue (in Billions TZS, Annual)
| Aspect | 2025 Actual (Annualized) | Baseline 2026 Projection (Pre-Unrest) | Adjusted 2026 Projection (Post-Unrest) | Key Impact Drivers |
| Total Income Tax Revenue | 10,600 | 12,500-13,000 (+18-23%) | 11,000-11,500 (-10-15% from baseline) | Business closures; investor flight |
| % of Total Tax Revenue | 45-46% | 46-47% | 43-45% (decline in share) | Evasion rise; enforcement strains |
| % of Total Revenue | 34-35% | 35-36% | 37-39% (higher burden) | Grant shortfalls; overall revenue dip |
| Annual Growth Rate | +20.3% | +18-23% | +8-12% (capped) | Formal job losses; compliance drops |
| Average Monthly Collection | 981 | 1,040-1,080 | 920-960 (-8-10%) | Seasonal peaks disrupted |
Notes: Baselines extrapolate document trends (e.g., 20% 2025 growth). Adjustments incorporate 5-10% GDP hit from unrest (e.g., tourism/mining slumps), per regional analyses projecting jeopardized 6% growth. Peaks (March/June/Dec) could fall 15-25%.
Detailed Impacts on Income Tax Revenue
Broader Economic Development Implications for 2026
These revenue shortfalls (~1-1.5T TZS gap) exacerbate fiscal stress, projecting 3-4% GDP growth (vs. 5-6%) and straining debt service (20.6% of revenue in 2024). Formalization efforts stall, widening inequality and hindering Vision 2025 diversification. If D9 escalates into sustained unrest, Q1 2026 could see 20% quarterly drops, triggering austerity that crowds out infrastructure. Positively, President Hassan's November 14 probe vow and AU mediation could restore ~$500M in aid by mid-2026, boosting collections 5-7% if stability returns.
Mitigation Pathways: Enhance digital collections for resilience; offer amnesties to curb evasion; and prioritize dialogue to avert D9 violence—e.g., releasing prisoners like Jennifer Jovin. Without reforms, income tax's momentum reverses, risking a "lost year" for development.
Tanzania’s wage bill rose from TZS 7,187 billion (2020) to a projected ~11,500 billion (2025), averaging 9–12% annual growth. Despite this expansion, its share of total expenditure held mostly stable at 27–28%, while the share of recurrent expenditure fell from 55.5% (2020) to ~42% (2025)—indicating moderate efficiency improvements. Monthly payments increased from TZS 599B in 2020 to 961B (2025 average), with predictable mid-year adjustments. However, as a share of total revenue, wages climbed from 32.9% (2020) to 34.1% (2025), nearing the <35% sustainability threshold. The political turmoil of late 2025 is projected to push the wage bill to TZS 11.8T–12.2T in 2026 while revenue slows, resulting in a wage-to-revenue ratio of 35–38%, breaching recommended benchmarks and crowding out development spending. Read More: Tanzania Government Revenue at 87.2% of Target, Spending at 71.9%
| Year | Wages & Salaries | Total Expenditure | Recurrent Expenditure | % of Total Expenditure | % of Recurrent Expenditure |
| 2020 | 7,187 | 23,449 | 12,949 | 30.7% | 55.5% |
| 2021 | 7,725 | 30,507 | 16,087 | 25.3% | 48.0% |
| 2022 | 8,526 | 31,378 | 15,481 | 27.2% | 55.1% |
| 2023 | 9,528 | 34,277 | 19,197 | 27.8% | 49.6% |
| 2024 | 10,515 | 37,938 | 22,008 | 27.7% | 47.8% |
| 2025 (Jan-Sep) | 8,649 | 31,786 | 20,403 | 27.2% | 42.4% |
Trends: The wage bill rose from 7.2T TZS in 2020 to a projected ~11.5T TZS in 2025 (annualized from Jan-Sep), averaging 9-12% annual growth. It stabilized at ~27-28% of total expenditure but dipped as a share of recurrent spending (from 55.5% to ~42% projected), suggesting some efficiency gains or shifts to other recurrent items like subsidies.
| Period | Wages Growth (%) | Total Expenditure Growth (%) | Inflation Context |
| 2020-2021 | +7.5% | +30.1% | Growing wage bill |
| 2021-2022 | +10.4% | +2.9% | Strong increase |
| 2022-2023 | +11.8% | +9.2% | Above expenditure growth |
| 2023-2024 | +10.4% | +10.7% | Aligned with overall spending |
| 2024-2025* | +9.8% (projected) | +5.8% (projected) | Moderate growth |
*2025: Annualized projection.
Details: Growth consistently outpaced inflation (typically 3-5% annually), driven by promotions, new hires (e.g., teachers, health workers), and cost-of-living adjustments. The 2023 peak (11.8%) aligned with post-COVID hiring surges.
| Year | Average Monthly Payment | Monthly Growth from Prior Year |
| 2020 | 599 | - |
| 2021 | 644 | +7.5% |
| 2022 | 710 | +10.3% |
| 2023 | 794 | +11.8% |
| 2024 | 876 | +10.3% |
| 2025 | 961 | +9.7% (9-month avg) |
| Month | 2020 | 2021 | 2022 | 2023 | 2024 | 2025 (Jan-Sep Avg) |
| Jan-Feb | 590 | 604 | 693 | 749 | 835 | 941 |
| Mar-Apr | 595 | 621 | 679 | 753 | 836 | 952 |
| May-Jun | 596 | 626 | 680 | 781 | 847 | 965 |
| Jul-Aug | 612 | 655 | 743 | 812 | 905 | 1,072 |
| Sep-Oct | 601 | 662 | 747 | 824 | 926 | 1,080 |
| Nov-Dec | 602 | 677 | 751 | 836 | 932 | - |
Patterns: Payments are steady (minimal variance month-to-month), with slight upticks in July (new fiscal year adjustments). This reliability contrasts with volatile revenue streams, underscoring wages as a "sticky" commitment.
| Year | Total Revenue | Wages & Salaries | Wage Bill as % of Revenue |
| 2020 | 21,828 | 7,187 | 32.9% |
| 2021 | 23,013 | 7,725 | 33.6% |
| 2022 | 27,921 | 8,526 | 30.5% |
| 2023 | 29,454 | 9,528 | 32.3% |
| 2024 | 32,492 | 10,515 | 32.4% |
| 2025 (9 months) | 25,331 | 8,649 | 34.1% |
| Benchmark | Recommended | Tanzania (2024) | Status |
| Wages as % of Revenue | <35% | 32.4% | ✓ Within limits |
| Wages as % of Tax Revenue | <40% | 43.4% | ⚠ Borderline |
| Annual Wage Growth | ≤ Revenue Growth | 10.4% vs 10.3% | ✓ Aligned |
The wage bill data reflects a public sector acting as an economic stabilizer during recovery and expansion, but it also signals mounting fiscal pressures that could constrain investment in growth drivers.
Key Economic Development Takeaways:
The post-election unrest in Tanzania, erupting after the October 29, 2025, general elections and escalating through November with hundreds of deaths, curfews, and international condemnation, poses severe risks to fiscal stability. President Samia Suluhu Hassan's November 14 announcement of a probe into protest deaths and her November 18 admission that the violence could limit access to international funding underscore the crisis's economic fallout. As of November 29, 2025, the EU has suspended aid, inflation has spiked to a two-year high of ~5.2% amid supply disruptions, and the government has redirected Independence Day funds for rebuilding—signaling immediate budget strains. These challenges threaten the public wage bill, a "sticky" recurrent expenditure that grew to ~11.5T TZS in 2025 (projected) and consumes 32-34% of revenue. Below, I detail projected 2026 impacts, drawing on the document's trends (e.g., 9-10% growth baseline) adjusted for unrest effects like aid cuts and revenue shortfalls.
Summary Table of Projected Impacts on Wages & Salaries (in Billions TZS, Annual)
| Aspect | 2025 Actual (Annualized) | Baseline 2026 Projection (Pre-Unrest) | Adjusted 2026 Projection (Post-Unrest) | Key Impact Drivers |
| Total Wage Bill | 11,500 | 12,600-12,900 (+9-10%) | 11,800-12,200 (-3-5% from baseline) | Revenue shortfalls; aid suspensions |
| % of Revenue | 32-34% | 32-33% | 35-38% (breaches benchmark) | Fiscal tightening; inflation pressures |
| Annual Growth Rate | +9.8% | +9-10% | +5-7% (capped) | Hiring freezes; increment delays |
| Average Monthly Payment | 961 | 1,050-1,075 | 980-1,020 (-5-7%) | Payment disruptions; reallocations |
| % of Total Expenditure | ~27% | ~27% | 28-30% (crowding out other spending) | Security/rebuild priorities |
Notes: Baselines assume document trends (e.g., aligned with 10.3% revenue growth). Adjustments factor 5-10% revenue hit from unrest (e.g., tourism/FDI drops), per economic outlooks. Sustainability status shifts from "✓ Aligned" to "⚠ Borderline" across benchmarks.
Detailed Impacts on Wages & Salaries
Broader Economic Development Implications for 2026
These wage impacts amplify fiscal stress, projecting GDP growth at 3-4% (down from 5%) as public consumption—~20% of GDP via salaries—weakens. High wage rigidity (sticky commitments) crowds out infrastructure (e.g., 10-15% cut in development loans, per prior analysis), stalling industrialization and poverty reduction. The "tough times" warned by President Hassan could manifest as austerity, eroding middle-income progress if unrest prolongs beyond Q1 2026. Positively, the probe and international pressure (e.g., AU mediation) might unlock ~$500M in frozen aid by mid-year, easing pressures if reforms address governance.
Mitigation Pathways: Implement efficiency measures like digitizing payroll (saving 5-10%) or performance-linked pay; diversify revenue via mining taxes; and prioritize dialogue to restore donor confidence. Without action, the wage bill risks becoming a flashpoint for further unrest, as delayed salaries fuel protests.
From 2020–2025, Tanzania consistently relied on external sources to fund development, with foreign borrowing rising from 40% of total in 2020 to over 70% in 2025. Total annual borrowing nearly doubled in 2021 (+97%), mainly due to post-COVID recovery needs, while 2023 recorded the highest borrowing (TZS 12.03T), reflecting aggressive infrastructure financing. However, debt service increased from 12.5% of revenue (2020) to 20.6% (2024), tightening fiscal space. The growing share of non-concessional loans (up to 33.5% in 2025) has pushed interest costs higher. With 2025 political instability and EU aid suspension, projections show foreign borrowing could fall by 10–15% in 2026, especially program loans (-25–30%), while commercial borrowing could rise by 20–30%, worsening debt risks. Read More: Tanzania External Debt at USD 35.44 Billion
| Year | Foreign Borrowing | Domestic Borrowing | Total Borrowing | Foreign % | Domestic % |
| 2020 | 2,221 | 3,305 | 5,526 | 40.2% | 59.8% |
| 2021 | 7,574 | 3,331 | 10,905 | 69.4% | 30.6% |
| 2022 | 5,315 | 3,721 | 9,036 | 58.8% | 41.2% |
| 2023 | 8,268 | 3,766 | 12,034 | 68.7% | 31.3% |
| 2024 | 6,688 | 4,009 | 10,697 | 62.5% | 37.5% |
| 2025 (Jan-Sep) | 5,835 | 2,339 | 8,174 | 71.4% | 28.6% |
Trends: Total borrowing peaked at 12,034B TZS in 2023, driven by foreign loans. 2025 shows a slowdown, with foreign sources dominating (71.4% YTD).
| Year | Net Foreign Financing | Net Domestic Financing | Total Net Financing |
| 2020 | -252 | 3,057 | 2,805 |
| 2021 | 4,950 | 2,358 | 7,308 |
| 2022 | 2,455 | 2,935 | 5,390 |
| 2023 | 4,520 | 2,726 | 7,246 |
| 2024 | 2,486 | 1,533 | 4,019 |
| 2025 (Jan-Sep) | 3,396 | 2,434 | 5,830 |
Insight: Net financing stayed positive throughout, meaning new borrowing outpaced repayments, providing fiscal space for spending. However, foreign net inflows fluctuated with amortization spikes.
| Category | 2020 | 2021 | 2022 | 2023 | 2024 | 2025* |
| Program Loans | 277 | 1,358 | 1,499 | 2,015 | 1,777 | 2,114 |
| Development Project Loans | 1,944 | 6,216 | 3,816 | 6,253 | 4,911 | 3,721 |
| Non-Concessional Loans | 0 | 4,503 | 979 | 3,222 | 2,113 | 1,956 |
Domestic Borrowing Composition (Primarily Bank Borrowing; Non-Bank = 0 Across Years)
| Category | 2020 | 2021 | 2022 | 2023 | 2024 | 2025* |
| Bank Borrowing | 3,305 | 3,331 | 3,721 | 3,766 | 4,009 | 2,339 |
*2025: Jan-Sep; domestic figures are new borrowing only.
Details: Foreign loans emphasize development projects (63.8-87.5% of mix), funding infrastructure like roads, energy, and ports. Program loans (budget support) rose to 36.2% in 2025. Non-concessional (commercial) loans surged post-2021, indicating diversification from traditional donors.
| Year | Foreign Amortization | Domestic Amortization | Total Debt Service | As % of Revenue |
| 2020 | 2,473 | 248 | 2,721 | 12.5% |
| 2021 | 2,624 | 973 | 3,597 | 15.6% |
| 2022 | 2,860 | 786 | 3,646 | 13.1% |
| 2023 | 3,748 | 1,040 | 4,788 | 16.3% |
| 2024 | 4,202 | 2,476 | 6,678 | 20.6% |
| 2025 (Jan-Sep) | 2,439 | -95 | 2,344 | 9.3% |
| Year | Total Revenue (B TZS) | Total Borrowing (B TZS) | Borrowing/Revenue Ratio |
| 2020 | 21,828 | 5,526 | 25.3% |
| 2021 | 23,013 | 10,905 | 47.4% |
| 2022 | 27,921 | 9,036 | 32.4% |
| 2023 | 29,454 | 12,034 | 40.9% |
| 2024 | 32,492 | 10,697 | 32.9% |
| 2025 (9m) | 25,331 | 8,174 | 32.3% |
| Year | Total Revenue (B TZS) | Debt Service (B TZS) | Coverage Ratio | Status |
| 2020 | 21,828 | 2,721 | 8.0x | ✓ Strong |
| 2021 | 23,013 | 3,597 | 6.4x | ✓ Good |
| 2022 | 27,921 | 3,646 | 7.7x | ✓ Strong |
| 2023 | 29,454 | 4,788 | 6.2x | ✓ Good |
| 2024 | 32,492 | 6,678 | 4.9x | ⚠ Moderate |
| 2025 (9m) | 25,331 | 2,344 | 10.8x | ✓ Strong |
Year-on-Year Growth (from Document): Total borrowing grew 97.4% in 2021 (COVID spike), then fluctuated (-17.1% in 2022, +33.2% in 2023). 2024-2025 projected at -2.0%, signaling moderation.
| Type | 2020 | 2021 | 2022 | 2023 | 2024 | 2025* |
| Program Loans | 12.5 | 17.9 | 28.2 | 24.4 | 26.6 | 36.2 |
| Development Projects | 87.5 | 82.1 | 71.8 | 75.6 | 73.4 | 63.8 |
| Non-Concessional | 0.0 | 59.5 | 18.4 | 39.0 | 31.6 | 33.5 |
The data paints a picture of resilient but strained economic growth, with borrowing as a key enabler of development amid external shocks like COVID-19 and global inflation.
Key Economic Development Takeaways:
The political turmoil following Tanzania's October 29, 2025, general elections—marked by opposition allegations of fraud, violent crackdowns, internet shutdowns, and reports of hundreds of deaths—has significantly damaged the country's international reputation. President Samia Suluhu Hassan publicly acknowledged on November 18, 2025, that the unrest could hinder access to external funding, as Tanzania relies heavily on foreign loans (60-70% of total borrowing, per the document). This comes amid actions like the EU's suspension of aid on November 28, 2025, due to human rights concerns, and warnings from analysts about broader donor pullback.
For 2026 (fiscal year 2025/26, July-June), Tanzania's planned external borrowing of 8.7 trillion TZS (~$3.6 billion) is now at risk, potentially leading to a 15-25% shortfall in concessional flows. This could force a pivot to costlier options, exacerbating the fiscal stress seen in 2024 (debt service at 20.6% of revenue). Below, I break down the projected impacts on the three key foreign borrowing categories from the document: Program Loans, Development Project Loans, and Non-Concessional Loans. Projections are based on 2025 trends (e.g., Program Loans at 36.2% of foreign mix) adjusted for political fallout, assuming moderate unrest resolution by mid-2026.
Summary Table of Projected Impacts (in Billions TZS, Annualized for 2026)
| Category | 2025 Actual (Jan-Sep) | Projected 2026 Baseline (Pre-Unrest) | Adjusted 2026 Projection (Post-Unrest) | Key Impact Drivers |
| Program Loans | 2,114 | 2,800-3,000 | 2,000-2,300 (-25-30%) | Donor suspensions; governance conditions |
| Development Project Loans | 3,721 | 4,500-5,000 | 4,000-4,500 (-10-15%) | Project delays; bilateral caution |
| Non-Concessional Loans | 1,956 | 2,200-2,500 | 2,800-3,200 (+20-30%) | Shift from concessional; higher commercial demand |
| Total Foreign Borrowing | 5,835 (YTD) | 7,500-8,000 | 6,800-7,000 (-10-15%) | Overall aid tap-shut; image damage |
Notes: Baselines extrapolate 2025 YTD at 80% Q4 pace (per document). Adjustments factor in 15-25% concessional cuts from sources like EU/IMF. Total could rise if domestic borrowing fills gaps, but at higher rates.
Detailed Impacts by Category
Broader 2026 Outlook and Recommendations
Overall, the unrest could trim total foreign borrowing by 10-15% (~700-1,000B TZS shortfall), flipping net financing from positive (5.8T TZS in 2025 YTD) to neutral or negative if unaddressed. This threatens Tanzania's middle-income trajectory, with growth dipping to 3-4% amid investor caution. Politically, unresolved tensions (e.g., opposition bans) may prolong the crisis, but dialogue could unlock ~$1B in frozen aid by mid-year.
To navigate: Prioritize transparency for donor trust, diversify to resilient partners like India, and boost revenue (e.g., via mining taxes) to cut borrowing needs by 5-10%.
From 2020 to 2025, Tanzania’s government budget showed significant growth in revenue, rising from TZS 21,828B in 2020 to approximately 34,000B in 2025, representing a 56% increase, while expenditures grew even faster, from TZS 23,449B to ~42,000B, widening the fiscal gap. Pre-grant deficits remained large, moving from –1.6T in 2020 to –8.0T in 2025, and post-grant deficits averaged between –4T and –7T, accounting for 15–28% of revenue, signaling sustained fiscal pressure. Revenue growth was strong in key years, with 2022 up 21.3%, 2024 up 10.3%, and a projected 12.5% in 2025, while tax revenue consistently dominated total receipts at 72–76%, reaching 76.3% in 2025. Expenditure composition shifted notably, with recurrent spending rising from 55% in 2020 to 64% in 2025, while development expenditure fell from a 50.7% peak in 2022 to 35.8% in 2025, limiting investment in growth and job creation.
Deficits as a share of revenue after grants highlight the fiscal risk trajectory: –7.4% in 2020, –28.8% in 2021 (COVID-19 stimulus impact), –12.4% in 2022, –16.4% in 2023, –16.8% in 2024, and a projected –22–23% in 2025, returning the budget to high-risk levels. Looking ahead to 2026 under political instability, the post-election crisis—with market shutdowns, travel advisories, donor freezes, and a 33% tourism drop—reduces the baseline revenue projection from TZS 36.5–37.5T to 33–34.5T, a 5–10% shortfall, while expenditures are expected to rise to 42.5–43.5T due to security and emergency costs. Post-grant deficits could widen to –9.0T to –9.8T (≈27–30% of revenue), surpassing fiscal safety thresholds, recurrent spending could climb to 65–68%, squeezing development down to 32–35%, and grants may fall 25–40%, particularly after the EU’s €156M (~400B TZS) suspension. Overall, while the 2020–2025 data demonstrates fiscal resilience, the 2026 outlook signals the most severe budgetary stress Tanzania has faced in a decade. Read More: TIC, LGAs, TRA, and PPPC, Tackling Economic and Social Challenges for Tanzania’s 114-Million Population by 2050
| Category | 2020 | 2021 | 2022 | 2023 | 2024 | 2025 (Jan-Sep) |
| Total Revenue | 21,828 | 23,013 | 27,921 | 29,454 | 32,492 | 25,331 |
| Total Expenditure | -23,449 | -30,507 | -31,378 | -34,277 | -37,938 | -31,786 |
| Overall Balance (before grants) | -1,621 | -7,494 | -3,457 | -4,823 | -5,446 | -6,485 |
| Grants | 753 | 869 | 793 | 569 | 858 | 687 |
| Overall Balance (after grants) | -868 | -6,625 | -2,664 | -4,254 | -4,588 | -5,798 |
Trends: Expenditures outpaced revenue consistently, widening deficits—peaking at -6.6T TZS in 2021 (COVID stimulus). Grants mitigated ~20-30% of gaps but declined post-2023. 2025 YTD projects -7.8T TZS annual deficit, driven by recurrent pressures.
| Year | Growth (%) |
| 2021 | +5.4% |
| 2022 | +21.3% |
| 2023 | +5.5% |
| 2024 | +10.3% |
| 2025 | +12.5% (projected) |
| Year | Deficit (% of Revenue) |
| 2020 | -7.4% |
| 2021 | -28.8% |
| 2022 | -12.4% |
| 2023 | -16.4% |
| 2024 | -16.8% |
| 2025 | -25.6% (9 months, projected annualized ~22-23%) |
| Year | Tax % of Total Revenue |
| 2020 | 77.7% |
| 2021 | 71.9% |
| 2022 | 73.0% |
| 2023 | 73.2% |
| 2024 | 74.6% |
| 2025 | 76.3% (9 months) |
| Type | 2020 | 2021 | 2022 | 2023 | 2024 | 2025* |
| Recurrent | 55.2 | 52.7 | 49.3 | 56.0 | 58.0 | 64.2 |
| Development | 44.8 | 47.3 | 50.7 | 44.0 | 42.0 | 35.8 |
*2025: Annualized projection from Jan-Sep.
Details: Tax reliance strengthened (71-77%), with income taxes (per prior doc) driving 2024-2025 gains. Recurrent spending surged to 64% in 2025 (wages/subsidies), squeezing development to <40%—a reversal from 2022's balanced 50/50 split.
The budgetary data underscores a fiscal engine powering post-COVID resilience, with revenue growth enabling ~5% average GDP expansion, but deficits and recurrent dominance highlight trade-offs in sustainable development.
Key Economic Development Takeaways:
The post-October 29, 2025, election crisis in Tanzania has intensified as of November 29, 2025, with President Samia Suluhu Hassan's 97.7% victory declaration sparking ongoing protests, over 2,000 arrests, and claims of 3,000+ deaths from security crackdowns. The government has canceled December 9 Independence Day events amid fears of mass "D9" demonstrations, while CNN's investigation exposed alleged mass graves and police shootings, drawing UN calls for probes. Nepotism allegations surged after Hassan's daughter and son-in-law were appointed to key ministries on November 17, fueling #SamiaMustGo trends. The EU Parliament's November 28 decision to freeze €156 million (~400B TZS) in aid marks a major blow, compounding revenue strains from tourism collapses (33% drop est.) and business sabotage. These events threaten the budgetary operations outlined in the document—revenue growth at +12.5% projected for 2025, deficits at -16-25% of revenue, and a recurrent spending tilt to 64%—potentially derailing fiscal recovery. Below, I project 2026 impacts (fiscal year July-June), adjusting baselines for a 10-15% overall shortfall from unrest.
Summary Table of Projected Impacts on Budgetary Operations (in Billions TZS, Annual)
| Category | 2025 Actual (Annualized) | Baseline 2026 Projection (Pre-Unrest) | Adjusted 2026 Projection (Post-Unrest) | Key Impact Drivers |
| Total Revenue | 34,000 | 36,500-37,500 (+10-12%) | 33,000-34,500 (-5-10%) | Tourism/FDI flight; grant freezes |
| Total Expenditure | -42,000 | -41,500-42,500 (+8-10%) | -42,500-43,500 (+10-15%) | Security/rebuild costs; recurrent surge |
| Overall Balance (before grants) | -8,000 | -5,000-5,500 | -9,500-10,500 (-15-20%) | Revenue erosion; spending hikes |
| Grants | 900 | 800-1,000 | 500-700 (-25-40%) | EU/ donor suspensions |
| Overall Balance (after grants) | -7,100 | -4,200-4,700 (-11-13%) | -9,000-9,800 (-25-28%) | Widened deficits; borrowing reliance |
| Budget Deficit (% of Revenue) | -22% | -13-15% | -27-30% (breaches thresholds) | Fiscal volatility; inflation (5.2%) |
| Tax Revenue (% of Total) | 76% | 76-78% | 78-80% (higher tax burden) | Compliance strains; evasion rise |
| Recurrent (% of Expenditure) | 64% | 60-62% | 65-68% | Wages/security dominance |
| Development (% of Expenditure) | 36% | 38-40% | 32-35% | Project delays; capex cuts |
Notes: Baselines from document trends (e.g., +10% revenue growth). Adjustments factor 5-10% GDP drag (growth to 3-4% vs. 5%), per analyses of tourism/mining hits and aid losses. High-unrest (e.g., D9 escalation) could worsen by 5%.
Detailed Impacts on Budgetary Operations
Broader Economic Development Implications for 2026
These shocks could slash GDP growth to 3-4% (from 5%), stalling formalization and exports while intergenerational trauma from 2,000+ deaths hampers social cohesion. Recurrent dominance erodes capex, risking a "lost year" for middle-income goals—e.g., 10-15% cuts to infrastructure amid AU/UN scrutiny. Positively, if Hassan's November 14 probe leads to releases (e.g., 1,736 detainees) and AU mediation by Q1, ~300B TZS in aid could unlock, trimming deficits to -20%. Otherwise, austerity (5-10% recurrent trims) may spark further unrest, perpetuating cycles seen in 2007 Kenya.
Mitigation Pathways: Boost digital tax enforcement; diversify grants to China/India; and pursue reconciliation for investor return. Urgent D9 de-escalation is critical to avert catastrophe.
As Tanzania steps into 2026, the nation finds itself at a crossroads where economic promise collides with political uncertainty. With a population exceeding 67 million and a track record of resilient growth, the economy is forecasted to expand by 6.3% in real GDP terms next year, building on a solid 6.0% performance in 2025. This trajectory is fueled by infrastructure investments, sectoral diversification, and integration into regional trade frameworks like the African Continental Free Trade Area (AfCFTA). Yet, the shadow of the October 2025 general elections looms large. President Samia Suluhu Hassan's landslide re-election amid allegations of fraud and violent post-election protests has sparked international condemnation and domestic unrest, potentially derailing investor confidence and aid flows. This article navigates Tanzania's economic landscape for 2026, weaving in the political context to assess opportunities, risks, and pathways to stability. Drawing on projections from the IMF, World Bank, and local authorities, it underscores how addressing these tensions could unlock sustainable prosperity.
Tanzania's economy demonstrated vigor in 2025, with fiscal year 2024/25 (ending June) registering 5.6% growth, surpassing targets through public spending on infrastructure and a rebound in exports. The 2025/26 national budget, totaling TShs 56.49 trillion (about US$20.5 billion), sets an ambitious tone for the coming year, prioritizing revenue mobilization and deficit control at 3.0% of GDP.
Looking ahead to 2026, macroeconomic indicators paint an optimistic yet cautious picture. Growth is expected to accelerate slightly, supported by mining booms and tourism recovery, though political volatility could trim these gains by 1-2 percentage points if unresolved.
| Indicator | 2025 Estimate | 2026 Projection | Key Influences |
| Real GDP Growth | 6.0% | 6.3% (base case; 4.3-5.3% with risks) | Infrastructure, exports; tempered by unrest |
| Nominal GDP | US$85.98bn | US$91.5bn | Inflation moderation, FDI inflows |
| Inflation (CPI) | 3.3% | 3.5% | Commodity stability; potential spikes from disruptions |
| Fiscal Deficit (% of GDP) | 3.0% | 3.0% | Tax reforms; aid suspensions a risk |
| Current Account Deficit (% of GDP) | 2.6% | 2.8% | Export growth vs. import pressures |
| Public Debt (% of GDP) | 48% | 48-50% | Borrowing for projects; donor scrutiny |
Tax revenues are slated to reach 13.3% of GDP, funding essentials like education and health, while the Bank of Tanzania maintains an accommodative stance to keep inflation below 5%. Unemployment, at around 10%, persists as a youth challenge, but emerging sectors could generate 500,000 jobs if stability returns. The political fallout—marked by AU and SADC condemnations—has already prompted donor pauses on loans, signaling fiscal headwinds that could widen deficits if protests escalate.
Tanzania's economy derives strength from its tripartite structure: agriculture (25% of GDP), industry (33%), and services (42%). The 2025/26 budget allocates resources to enhance value chains, but political disruptions threaten supply lines and investor appetite.
| Sector | GDP Contribution (%) | 2026 Growth Projection | 2026 Drivers and Risks |
| Agriculture | 25 | 5.5-6.0% | Irrigation projects, cashew/tobacco exports; vulnerable to protest-related transport halts |
| Industry (incl. Mining) | 33 | 7.0% (mining-led) | Gold (1.6M oz target), nickel/graphite; FDI dips from image risks |
| Services (incl. Tourism) | 42 | 6.5% | 1.7M visitors, fintech boom; tourism bookings down 15-20% post-elections |
Agriculture, employing over 65% of the workforce, stands to benefit from climate-resilient initiatives, potentially boosting exports by 10% under AfCFTA. Yet, border closures with Kenya amid unrest have already disrupted maize and coffee shipments, risking food inflation. Mining, a FDI magnet, eyes record outputs in critical minerals for global green transitions, but foreign firms may hesitate amid governance concerns. Services, led by tourism's projected US$3 billion revenue, face the sharpest blow: safety fears have slashed bookings, echoing 2020's COVID slump, while fintech innovations offer a buffer through digital inclusion.
No discussion of 2026 is complete without confronting the elephant in the room: the 2025 elections' aftermath. President Hassan's 97% victory and CCM's near-sweep of parliament have been decried as undemocratic, with opposition claims of intimidation fueling deadly protests that claimed thousands of lives. International bodies like the EU and media giants such as CNN have amplified calls for accountability, leading to aid freezes and travel advisories.
These tensions cascade into economic vulnerabilities. Investor sentiment, already fragile, could see FDI inflows—targeted at US$3 billion—plunge by 20-30%, per expert analyses, as "democracy erosion" repels capital. Tourism, a forex lifeline, risks a 15% visitor drop, costing jobs in a sector employing 1.5 million. Regional trade suffers from logistical snarls, inflating import costs for fuel and machinery, while debt servicing (48% of GDP) grows burdensome without concessional aid.
Broader structural issues compound this: climate shocks could exacerbate food price hikes to 4-5%, urbanization strains infrastructure, and a 49% poverty rate (at $3.20/day PPP) underscores inequality. The IMF warns that without private sector reforms, growth could stagnate below 5%. Yet, these challenges also spotlight urgency: resolving unrest through dialogue could swiftly restore confidence, turning crisis into catalyst.
Tanzania's response to this juncture lies in bold reforms. The Tanzania Investment and Special Zones Authority (TISEZA), operational since mid-2025, has fast-tracked over 200 projects worth US$2.3 billion, offering tax incentives for green and digital ventures. The 2025/26 budget's excise hikes on luxuries and green bonds aim to diversify revenues, while Vision 2050 prioritizes human capital via STEM training and vocational programs.
Opportunities abound for 2026: renewables could hit 10,000 MW capacity, powering industrial hubs; AfCFTA integration might lift exports 20%; and the blue economy—fisheries and marine tourism—holds untapped potential. IMF-backed fiscal discipline under the Extended Credit Facility could unlock fresh funding if political reconciliation progresses. President Hassan's overtures for national dialogue signal intent, positioning 2026 as a "reset year" for inclusive growth, with private investments potentially surging 15-20% in renewables and ICT.
If political stability is restored by early 2026—through mediated talks and electoral audits—growth could exceed 6.5%, propelling Tanzania toward US$1 trillion nominal GDP by 2050. Demographics favor this, with a youthful workforce driving innovation, but sustained 10% annual expansion demands poverty cuts below 30% and 1 million annual jobs. Upsides include mining's global edge and tourism's eco-rebound; downsides, like prolonged unrest or global slowdowns (at 3.0%), could shave growth to 4%.
Long-term, upper-middle-income status by 2030 hinges on diversification and resilience, aligning with regional goals.
Tanzania's 2026 economic story is one of duality: 6.3% growth beckons as a beacon of potential, yet political tremors from the 2025 elections threaten to dim its shine. By channeling unrest into unifying reforms—bolstering TISEZA, mending international ties, and safeguarding key sectors—the nation can mitigate risks and harness its strengths. Stakeholders, from government to global partners, must prioritize dialogue over division to ensure prosperity reaches every corner. In the words of President Hassan amid the crisis, this is a moment for "shared resolve." With agility and ambition, 2026 could mark not just recovery, but renaissance—for an economy, and a people, ready to thrive.
Balancing Ambition and Pragmatism in Tanzania's Inclusive Growth Agenda
Authored by Dr. Bravious Felix Kahyoza (PhD, FMVA, CP3P) and Amran Bhuzohera, this timely economic analysis examines President Samia Suluhu Hassan's November 14, 2025 Parliamentary Address launching Tanzania's 2025-2050 National Development Vision under the rallying slogan "Kazi na Utu, Tunasonga Mbele" (Work and Humanity, Moving Forward)—revealing both the transformative potential and implementation challenges of the administration's ambitious growth agenda.
With Tanzania's economy demonstrating resilient 5.6% growth in 2025 driven by record gold exports (USD 4.43 billion, +35.8% YoY) and tourism revenues (USD 3.92 billion), the President's vision targets accelerated expansion to over 7% by 2030 while creating 8.5 million jobs—a bold agendatempered by post-election violence costs (USD 200-300 million) and fiscal constraints (TZS 57 trillion budget with 15% debt servicing).
Key Economic Promises and Strategic Priorities
Economic Context and Performance Snapshot
The analysis situates promises against Tanzania's November 2025 economic realities:
Strengths:
Vulnerabilities:
Feasibility Assessment:
The research employs quantitative metrics to evaluate implementation potential:
High Feasibility Elements:
Moderate Challenges:
Critical Risks:
Key Recommendations for Implementation Success
1. Accelerate Reconciliation (Critical - First 100 Days):
2. Bridge Skills-Jobs Gap (High Priority):
3. Optimize Resource Mobilization (Continuous):
4. Strengthen Anti-Corruption Frameworks:
Impact Projections and Developmental Outcomes
If 70% of promises are delivered (realistic given historical benchmarks):
Short-Term (2026):
Medium-Term (2027-2029):
Long-Term (2030):
Downside Scenarios:
Conclusion: Transformative Potential with Execution Imperative
President Hassan's "Kazi na Utu" agenda represents a decisive pivot toward human-centered economics, integrating microeconomic interventions (youth funds, SME support) with macroeconomic stability (debt management, inflation control). The 7/10 feasibility rating reflects strong fundamentals—policy continuity, sectoral alignment, early actions—tempered by political, fiscal, and capacity constraints.
The authors emphasize three critical success factors:
By 2030, if reforms hold, Tanzania could achieve the "triple win" of inclusive growth (8.5 million jobs), fiscal sustainability (debt <45% GDP), and regional leadership (AfCFTA integration)—positioning the nation as a model for African agency in equitable development.
The ultimate choice is binary: "Tunasonga Mbele" (Moving Forward) through collective resolve, or risk stagnation amid unrealized potential. Parliament's oversight and citizen engagement will determine whether President Hassan's vision becomes transformative reality or unfulfilled promise.
📘 Read the Full Economic Analysis:
"Economic Analysis of President Samia Suluhu Hassan's 2025 Parliamentary Address: Balancing Ambition and Pragmatism in Tanzania's Inclusive Growth Agenda"
Authored by Dr. Bravious Felix Kahyoza (PhD, FMVA, CP3P) and Amran Bhuzohera
Published by TICGL | Tanzania Investment and Consultant Group Ltd
🌐 www.ticgl.com
Insights from Tanzania Investment and Consultant Group Ltd (TICGL)
By Amran Bhuzohera, Economist – TICGL
As Tanzania moves confidently toward its Vision 2050 goals, we stand at a defining moment in our nation’s economic journey. Across the country, the energy for progress is visible — from infrastructure expansion and industrial growth to innovations in agriculture and digital transformation. Yet, unlocking the full potential of these business and investment opportunities requires a clear understanding of our local markets, institutional frameworks, and the dynamics that drive both public and private investment.
At TICGL, this is exactly what we do.
As an Economist at TICGL, We have seen first-hand how data-driven insights can turn ambitious ideas into sustainable investments. TICGL is more than a consulting firm — we are a bridge between economic knowledge and strategic action. Our work helps investors, policymakers, and entrepreneurs navigate Tanzania’s evolving investment environment with clarity and confidence.
We combine local expertise with global standards to provide our clients with evidence-based analysis, advisory support, and market intelligence. Our mission is simple: to empower decisions that create value, jobs, and long-term growth for Tanzania.
At TICGL, our services are designed to serve the entire investment ecosystem:
One of our most exciting initiatives is the Tanzania Investment Portfolio (TIP) — a comprehensive compilation of both public and private investment projects, as well as PPP initiatives from across the country.
This portfolio showcases over 100 investment and business opportunities across sectors such as energy, agriculture, tourism, transport, manufacturing, mining, real estate, and technology. It highlights Tanzania’s diverse economic potential and the unique local advantages that make each project both viable and impactful.
More importantly, the TIP is built to help investors understand Tanzania from the inside out — its policies, institutions, and emerging market realities.
Tanzania’s steady growth, political stability, and demographic momentum make it one of Africa’s most promising investment frontiers. By 2050, with a projected population of over 114 million, our domestic market will be one of the largest in the region.
At TICGL, we believe that informed investment is the key to unlocking this potential — turning opportunities into industries, and industries into livelihoods. Through our research and advisory work, we continue to connect vision with opportunity, and ideas with action.
We invite investors, development partners, and business leaders to engage with TICGL and explore the Tanzania Investment Portfolio. Together, we can shape an investment environment that is inclusive, data-driven, and globally competitive — one that reflects Tanzania’s growing confidence on the continental and international stage.
📍 Head Office: Dar es Salaam, Tanzania
🌐 Website: www.ticgl.com
📧 Email: economist@ticgl.com
📞 Phone: +255 768 699 002