Tanzania's external debt portfolio presents a critical case study in emerging market debt management. As of end-November 2025, the country's total external debt reached USD 36.1 billion, with a pronounced concentration in US dollar-denominated obligations. This analysis examines whether this currency composition poses risks to macroeconomic stability.
The dominance of the US dollar reflects Tanzania's engagement with multilateral development banks, commercial lenders, and international capital markets where the USD serves as the primary lending currency. While this structure provides access to global development financing, it also creates vulnerabilities related to exchange rate fluctuations, debt servicing pressures, and foreign exchange management.
The external debt portfolio shows significant concentration in major global currencies, with the US dollar accounting for more than two-thirds of total obligations. This distribution reflects Tanzania's borrowing relationships with different creditor groups and the currency preferences of multilateral and commercial lenders.
Currency
Amount (USD Million)
Percentage Share
Economic Significance
US Dollar (USD)
24,127.7
66.8%
Dominant exposure - Primary risk factor
Euro (EUR)
6,333.6
17.5%
Moderate diversification
Japanese Yen (JPY)
3,219.0
8.9%
Bilateral development financing
Chinese Yuan (CNY)
1,334.5
3.7%
Growing partnership potential
Other Currencies
1,112.9
3.1%
Limited alternative exposure
Total External Debt
36,127.8
100.0%
Full Portfolio
Portfolio Diversification Assessment
While the US dollar dominates with 66.8% share, the portfolio demonstrates partial risk diversification through exposure to other major currencies. The combined EUR and JPY exposure of 26.4% provides some buffer against USD-specific risks, though the limited 3.7% CNY exposure suggests potential for further diversification as Tanzania deepens economic ties with China.
Exchange Rate Risk: The Primary Vulnerability
The concentration of debt in US dollars creates substantial exposure to exchange rate movements. The Tanzanian shilling's performance against the USD directly impacts the local currency value of debt obligations and debt servicing costs, making exchange rate management a critical policy priority.
Period
Exchange Rate (TZS/USD)
Year-on-Year Change
Impact Assessment
November 2024
2,662.4
-6.3% (depreciation)
Increased debt burden
November 2025
2,444.8
+8.1% (appreciation)
Reduced real debt burden
⚠️ Exchange Rate Risk Scenario
Critical Finding: A hypothetical 10% depreciation of the Tanzanian shilling would increase the TZS-equivalent value of USD-denominated external debt by approximately TZS 5.9 trillion. This scenario illustrates the scale of vulnerability associated with the 66.8% USD concentration and underscores the importance of maintaining exchange rate stability.
The 8.1% appreciation of the shilling in November 2025 demonstrates favorable exchange rate dynamics that have eased the real burden of USD debt. However, this also highlights the sensitivity of Tanzania's debt sustainability to currency movements, particularly given the size of USD-denominated obligations relative to the economy.
Debt Servicing Dynamics and Foreign Exchange Pressure
The currency composition directly influences Tanzania's debt servicing obligations and the associated demands on foreign exchange resources. Monthly debt service payments represent a significant drain on USD reserves and export earnings, with the majority of these payments linked to dollar-denominated debt.
Debt Service Component
Amount (USD Million)
Percentage of Total
Principal Repayments
75.4
69.2%
Interest Payments
33.6
30.8%
Total Debt Service (November 2025)
109.0
100.0%
With 66.8% of external debt denominated in USD, the overwhelming majority of these servicing costs are sensitive to USD exchange rate movements and depend on the availability of dollar foreign exchange. This creates sustained pressure on export performance, foreign exchange reserves management, and balance-of-payments stability.
Foreign Exchange Reserve Position
Tanzania's gross official reserves stood at USD 6.43 billion in November 2025, providing 4.9 months of import cover. While reserves covered approximately 26.7% of USD-denominated external debt, they covered only 17.8% of total external debt, highlighting limited room for maneuver during prolonged exchange rate pressure or external shocks.
Reserve Indicator
Value
Assessment
Gross Official Reserves
USD 6,432.9 million
Adequate for short-term needs
Import Cover
4.9 months
Above minimum threshold
Reserves to Total External Debt
17.8%
Limited buffer capacity
Reserves to USD Debt
26.7%
Partial coverage
External Sector Performance: Export Earnings and Trade Balance
Tanzania's ability to service USD-denominated debt depends fundamentally on export performance and the generation of foreign exchange earnings. Strong export growth in 2025 has provided critical support for debt sustainability, though persistent trade deficits indicate continued reliance on capital inflows.
External Sector Indicator
Amount (USD Million)
Year-on-Year Change
Exports of Goods & Services
17,561.5
+13.1%
Imports of Goods & Services
17,757.1
+5.3%
Trade Balance (Goods)
-4,468.9
-17.0% (improvement)
Current Account Deficit
-1,907.7
-29.0% (improvement)
✓ Positive Export Performance
The 13.1% year-on-year growth in exports represents a significant achievement, generating USD earnings that directly support debt servicing capacity. The narrowing of the current account deficit by 29% to USD 1.91 billion indicates improving external balance dynamics, though structural trade deficits remain.
Sectoral Export Composition and Concentration Risks
Tanzania's export earnings show heavy concentration in specific sectors, particularly gold mining and tourism. While these sectors generate substantial USD inflows, they also create vulnerability to external demand shocks and commodity price fluctuations.
Export Category
Amount (USD Million)
Share of Total Exports
Risk Profile
Gold
4,719.8
26.9%
High - Commodity price sensitive
Tourism (Travel)
4,036.7
23.0%
High - Demand sensitive
Transport Services
2,772.4
15.8%
Medium - Trade volume dependent
Manufactured Goods
1,530.8
8.7%
Medium - Competitive dynamics
⚠️ Export Concentration Risk
Gold and tourism together account for nearly 50% of Tanzania's total export earnings. This concentration creates dual risks: vulnerability to global gold price fluctuations and sensitivity to tourism demand shocks from economic downturns, health crises, or geopolitical events. Diversifying export sources remains a strategic priority for strengthening debt servicing capacity.
Macroeconomic Environment and Stability Indicators
Tanzania's macroeconomic environment has remained supportive of debt sustainability through 2025, with low inflation, stable monetary policy, and favorable exchange rate dynamics contributing to overall economic stability.
Macroeconomic Indicator
November 2025
November 2024
Trend
Headline Inflation
3.4%
3.0%
Stable and low
Core Inflation
2.3%
3.3%
Declining
Central Bank Rate
5.75%
-
Accommodative stance
Overall Lending Rate
15.27%
-
Stable credit conditions
✓ Favorable Inflation Environment
Low and stable inflation at 3.4% supports macroeconomic stability by maintaining the shilling's purchasing power and making USD-denominated debt more manageable in real terms. The decline in core inflation from 3.3% to 2.3% demonstrates effective monetary policy management and price stability.
Risk Assessment: Vulnerability and Mitigation Factors
The USD concentration in Tanzania's external debt creates three primary categories of risk that require careful monitoring and proactive management.
Primary Vulnerabilities
Exchange Rate Shock Risk: A 10% shilling depreciation would increase the TZS equivalent of USD debt by approximately TZS 5.9 trillion, placing immediate strain on fiscal resources and debt sustainability
Export Dependency: Debt servicing capacity heavily depends on sustained USD earnings from gold (26.9% of exports) and tourism (23.0%), creating concentration risk
Global Financial Conditions: Changes in US monetary policy affect both the USD exchange rate and potentially the cost of new USD borrowing, transmitting external shocks directly to Tanzania's debt portfolio
Mitigating Factors
Mitigating Factor
Current Status
Effectiveness
Foreign Exchange Reserves
USD 6,432.9 million (4.9 months import cover)
Adequate for short-term stability
Export Growth Rate
+13.1% year-on-year
Strong USD generation capacity
Current Account Improvement
Deficit narrowed 29% to USD 1,907.7 million
Reduced external financing needs
Shilling Performance
Appreciated 8.1% against USD
Reduced real debt burden
Controlled Debt Growth
Only +0.3% month-on-month expansion
Sustainable accumulation pace
Strategic Policy Recommendations
Based on the analysis of Tanzania's external debt currency composition, several strategic policy priorities emerge to strengthen macroeconomic stability and debt sustainability.
1. Enhanced Exchange Rate Management
The 66.8% USD exposure reinforces the critical importance of maintaining shilling stability through prudent monetary policy, effective foreign exchange market intervention, and continued reserve accumulation. Policy coordination between fiscal and monetary authorities remains essential.
2. Export Diversification Strategy
Reducing dependency on gold and tourism for USD earnings would strengthen debt servicing capacity and reduce vulnerability to sector-specific shocks. Priority areas include manufacturing exports, agricultural value addition, and services sector development.
3. Debt Portfolio Diversification
Gradually increasing the share of EUR, JPY, and CNY debt could reduce USD concentration risk. This strategy should focus on accessing concessional financing from bilateral and multilateral partners while maintaining debt sustainability thresholds.
4. Reserve Buffer Enhancement
Maintaining reserves above the current 4.9 months of import cover provides crucial protection against exchange rate volatility and external shocks. Target levels should consider both traditional metrics and debt servicing requirements.
5. Prudent Borrowing Strategy
Prioritizing concessional loans with longer maturities and grace periods helps manage refinancing risk associated with USD concentration. Careful assessment of project viability and revenue generation remains critical for new borrowing.
Conclusion: Balanced Risk Assessment
The dominance of the US dollar in Tanzania's external debt—accounting for 66.8% of a total debt stock of USD 36.1 billion as of end-November 2025—represents a structural vulnerability rather than an immediate macroeconomic crisis.
Current macroeconomic stability has been preserved by several supportive factors: the 8.1% appreciation of the Tanzanian shilling, strong export growth of 13.1%, adequate foreign exchange reserves of USD 6.43 billion providing 4.9 months of import cover, and low inflation at 3.4%. These conditions have successfully contained debt servicing pressures despite monthly external debt service payments of USD 109.0 million.
However, Tanzania's macroeconomic position remains highly sensitive to exchange rate movements and external shocks. The hypothetical scenario of a 10% shilling depreciation raising the local currency value of USD-denominated debt by approximately TZS 5.9 trillion illustrates the scale of potential vulnerability. Additionally, reliance on gold and tourism for nearly 50% of export earnings creates concentration risk that could materialize during global economic downturns or commodity price volatility.
Final Assessment: The USD dominance does not currently threaten macroeconomic stability, but it amplifies underlying risks that could emerge under less favorable conditions. Sustaining stability requires continued prudent monetary and exchange rate management, strengthening foreign exchange reserves, diversifying exports, and gradually broadening the currency composition of external borrowing toward EUR, JPY, and other alternative currencies.
Proactive management of these factors will be essential to ensure that Tanzania's external debt remains sustainable while supporting long-term development financing objectives and building economic resilience against future shocks.
Related Resources & Dashboards
TICGL Economic Dashboard
Access real-time economic indicators, macroeconomic data, and comprehensive analysis of Tanzania's economic performance.
Tanzania National Debt Analysis 2025 | TZS 128.4 Trillion Breakdown | TICGL
Tanzania National Debt Stock Analysis
Comprehensive Assessment of TZS 128.4 Trillion Debt Position
Data as of End-November 2025
128.4T
Total National Debt
Tanzanian Shillings
69.7%
External Debt Share
TZS 90.0T / USD 36.1B
30.3%
Domestic Debt Share
TZS 38.4 Trillion
0.4%
Monthly Growth Rate
Controlled Accumulation
Introduction
Tanzania's national debt stock reached approximately TZS 128.4 trillion by the end of November 2025, reflecting a strategic development financing approach heavily anchored on external resources. This comprehensive analysis reveals a debt structure characterized by external dominance at 69.7% of the total, with domestic debt providing a crucial 30.3% stabilizing buffer against foreign exchange volatility.
The debt composition demonstrates the government's continued role as the primary borrower, with the public sector accounting for TZS 103.5 trillion (80.5%) of total obligations, while private sector debt stood at TZS 24.9 trillion (19.5%). This distribution underscores the central government's strategic focus on financing critical infrastructure, social services, and transformative investments essential for Tanzania's development trajectory.
Critically, the monthly debt growth rate of 0.4% signals controlled and sustainable accumulation, a positive indicator for fiscal stability and macroeconomic management. Despite the external-heavy debt structure, sustainability risks remain well-managed through robust foreign exchange reserves covering approximately 4.9 months of imports, an expanding domestic debt market, and prudent fiscal policies maintained by the Bank of Tanzania and Ministry of Finance.
✓ Debt Sustainability Assessment
Tanzania's debt position remains manageable and sustainable under current fiscal frameworks, with moderate growth rates, adequate reserve buffers, and development-oriented borrowing strategies supporting long-term economic growth objectives.
National Debt Stock Overview
Debt Category
Amount (TZS Trillion)
USD Equivalent
Percentage Share
External Debt
90.0
USD 36.1 billion
69.7%
Domestic Debt
38.4
USD 15.4 billion
30.3%
Total National Debt
128.4
USD 51.5 billion
100.0%
Tanzania's debt architecture reveals significant reliance on external financing sources, with nearly 70% of total obligations denominated in foreign currencies. This structure reflects the country's development financing strategy, where concessional loans and development partner financing play pivotal roles in funding large-scale infrastructure projects, including transportation networks, energy facilities, and social infrastructure.
The domestic debt component, while smaller, serves as a critical stabilizing mechanism. It reduces overall foreign exchange exposure, provides diversification in funding sources, and supports the development of local capital markets. The 30.3% domestic share offers important insulation against currency depreciation risks that could otherwise amplify debt servicing costs.
External vs Domestic Debt Analysis
External Debt Profile
TZS Amount90.0 Trillion
USD Amount$36.1 Billion
Share of Total69.7%
Primary UseInfrastructure
Domestic Debt Profile
TZS Amount38.4 Trillion
USD Equivalent$15.4 Billion
Share of Total30.3%
Risk BufferFX Protection
External Debt Characteristics
Currency Composition: Predominantly USD-denominated, with some exposure to EUR, CNY, and other currencies
Creditor Mix: Multilateral institutions (World Bank, IMF, AfDB), bilateral partners (China, Japan, development partners), and commercial lenders
Terms Structure: Mix of concessional loans with favorable interest rates and longer commercial borrowings
Exchange Rate Risk: Depreciation of TZS against USD increases repayment burden in local currency terms
Strategic Purpose: Financing large capital projects with long gestation periods and high development impact
Domestic Debt Characteristics
Instruments: Treasury bills, treasury bonds, government securities with various maturities
Currency Advantage: TZS-denominated, eliminating foreign exchange risk on these obligations
Market Development: Growing domestic capital market provides increasing absorption capacity
Flexibility: Easier to manage and restructure compared to external obligations
Indicator
Value
Implication
Monthly Debt Growth
0.4%
Controlled, sustainable pace
Dominant Component
External (69.7%)
Development-focused financing
FX Reserve Cover
4.9 months
Strong external buffer
Exchange Rate
~2,490 TZS/USD
Stable currency environment
Public vs Private Sector Debt Distribution
Sector
Amount (TZS Trillion)
Percentage Share
Primary Purpose
Public Sector
103.5
80.5%
Infrastructure, social services, strategic investments
Private Sector
24.9
19.5%
Business expansion, trade finance, investments
Total National Debt
128.4
100.0%
Combined development financing
The public sector's commanding 80.5% share of national debt reflects Tanzania's development model, where government-led investment drives economic transformation. This concentration is consistent with comparable emerging economies pursuing infrastructure-intensive growth strategies, where public sector borrowing finances critical projects with high social returns but long payback periods.
Public Sector Debt Utilization
Transportation Infrastructure: Roads, railways, ports, and airports facilitating economic connectivity
Energy Sector: Power generation, transmission, and distribution infrastructure
Social Services: Healthcare facilities, educational institutions, water and sanitation systems
Economic Infrastructure: Industrial parks, special economic zones, agricultural development
Digital Infrastructure: Telecommunications networks and digital government systems
Private sector debt at 19.5% represents borrowing by businesses, financial institutions, and individuals for commercial purposes. While significantly smaller than public debt, private sector external borrowing supports trade finance, business expansion, and private investment in productive sectors, complementing public sector development efforts.
Debt Sustainability Assessment
Sustainability Indicator
Current Status
Assessment
Risk Level
Debt Composition
External-heavy (69.7%)
FX exposure present
Medium
Domestic Debt Buffer
30.3% of total
Reduces currency risk
Low
Monthly Growth Rate
0.4%
Moderate, controlled
Low
FX Reserve Coverage
4.9 months imports
Strong buffer
Low
Debt Purpose
Development-oriented
Growth-enhancing
Low
✓ Positive Sustainability Factors
Growing Domestic Market: Expanding local debt market provides alternative financing and reduces FX dependency
Adequate Reserves: 4.9 months of import cover significantly exceeds the 3-month adequacy threshold
Productive Investment: Debt financing infrastructure and services with long-term growth potential
Exchange Rate Volatility: TZS depreciation increases local currency debt service burden on external obligations
Global Interest Rates: Rising international rates affect borrowing costs and refinancing terms
Revenue Performance: Debt sustainability depends on continued strong domestic revenue mobilization
Economic Growth: Maintaining robust GDP growth essential for manageable debt-to-GDP ratios
Tanzania's debt sustainability outlook remains positive under current macroeconomic conditions and fiscal policies. The combination of moderate debt accumulation, productive use of borrowed funds, adequate reserve buffers, and growing domestic financing capacity creates a resilient debt management framework. However, continued vigilance on exchange rate movements, global financial conditions, and revenue performance is essential.
Debt Management Strategy and Policy Framework
Tanzania's debt management approach balances development financing needs with fiscal sustainability objectives. The government, through the Ministry of Finance and Bank of Tanzania, employs several strategic mechanisms to maintain debt sustainability while funding critical national priorities.
Key Debt Management Strategies
Concessional Financing Priority: Maximizing access to low-interest, long-tenor loans from multilateral and bilateral development partners
Domestic Market Development: Strengthening local capital markets to reduce reliance on external sources
Currency Risk Management: Maintaining diverse currency composition and building FX reserves
Debt Service Optimization: Strategic timing of bond issuances and refinancing to minimize costs
Transparency and Reporting: Regular debt stock reporting and adherence to international standards
The growth of Tanzania's domestic debt market from 30.3% of total debt represents a strategic achievement with multiple benefits. A deeper local capital market reduces vulnerability to external shocks, provides more flexible financing options, and supports broader financial sector development. The increasing participation of pension funds, insurance companies, and retail investors signals growing confidence in government securities.
Domestic: 30.3%
External: 69.7%
Future debt strategy aims to gradually increase the domestic share to 40-45% over the medium term, further reducing foreign exchange exposure while supporting local financial market deepening. This transition requires continued macroeconomic stability, competitive domestic interest rates, and sustained investor confidence.
Economic Context and Debt-to-GDP Analysis
Understanding Tanzania's debt position requires context of the broader economy. With GDP estimated at approximately TZS 200-210 trillion in 2025, the debt-to-GDP ratio stands around 61-64%, a level considered manageable for a developing economy pursuing infrastructure-intensive growth.
Economic Metric
Value
Implication for Debt
Nominal GDP (est.)
~TZS 205 trillion
Growing denominator improves ratios
Debt-to-GDP Ratio
~62-63%
Within sustainable range
GDP Growth Rate
6.0-6.5%
Outpacing debt growth
Revenue-to-GDP
~15-16%
Supports debt service capacity
Tanzania's GDP growth consistently exceeding 6% provides crucial debt sustainability support. When economic growth outpaces debt accumulation, debt-to-GDP ratios naturally stabilize or decline over time, even with continued borrowing for development purposes. This dynamic creates fiscal space for strategic investments while maintaining macroeconomic stability.
Comparative Regional Context
Tanzania's debt-to-GDP ratio (~62%) remains below many regional peers and well below the 70% threshold often cited for emerging markets
The composition favoring concessional external loans is more favorable than commercial debt-heavy structures seen in some countries
The 4.9 months of import cover provided by foreign exchange reserves represents a critical strength in Tanzania's debt sustainability framework. This substantial buffer significantly exceeds the 3-month international adequacy standard, providing protection against external shocks and confidence to international creditors.
Reserve Metric
Value
Assessment
Import Cover
4.9 months
Well above 3-month adequacy threshold
Reserve Trend
Stable to growing
Strengthening external position
External Debt Ratio
69.7% of total
Reserves provide servicing buffer
Currency Stability
Relatively stable TZS
Supports debt servicing capacity
Strong reserve levels perform multiple functions: they enable smooth debt servicing on external obligations, provide confidence to foreign investors and creditors, support currency stability, and offer protection against unexpected external shocks such as commodity price swings or global financial turbulence.
Future Outlook and Strategic Priorities
Looking ahead, Tanzania's debt management success will depend on maintaining the prudent approach evident in current data while adapting to evolving economic circumstances and opportunities. Several strategic priorities emerge from this analysis:
Short-Term Priorities (1-2 years)
Maintain moderate debt growth below 1% monthly
Continue building domestic market capacity
Preserve FX reserves above 4 months cover
Optimize debt service scheduling
Medium-Term Goals (3-5 years)
Increase domestic debt to 40-45% of total
Enhance revenue-to-GDP ratio to 18-20%
Ensure infrastructure investments boost growth
Diversify external creditor base
Long-Term Vision (5-10 years)
Achieve balanced domestic-external composition
Transition toward market-based financing
Stabilize debt-to-GDP below 60%
Build regional financial hub capacity
✓ Strengths to Build Upon
Controlled Growth: 0.4% monthly pace demonstrates disciplined borrowing
Growing Domestic Market: Reducing FX dependency over time
Robust GDP Growth: 6%+ growth outpacing debt accumulation
The combination of prudent debt management, strong economic growth, adequate reserves, and strategic investment focus positions Tanzania well for sustainable development financing. Continued attention to these fundamentals, alongside adaptive responses to global economic conditions, will be essential for maintaining this positive trajectory.
Conclusion: Manageable and Sustainable Debt Position
Tanzania's national debt stock of TZS 128.4 trillion as of end-November 2025 reflects a deliberate development financing strategy that balances growth imperatives with fiscal sustainability. The external-dominated structure (69.7%) enables access to large-scale, concessional financing for transformative infrastructure, while the growing domestic component (30.3%) provides critical currency risk mitigation.
Several factors support a positive sustainability assessment. The moderate 0.4% monthly growth rate indicates disciplined borrowing aligned with absorptive capacity. Foreign exchange reserves covering 4.9 months of imports provide a robust external buffer well above international adequacy standards. The productive, development-oriented use of borrowed funds supports future revenue generation and economic growth that outpaces debt accumulation.
The public sector's 80.5% share of total debt reflects government-led development strategy common in infrastructure-intensive growth phases. This concentration, while creating fiscal obligations, finances critical assets with long-term economic and social returns—transportation networks, energy systems, social infrastructure, and economic facilities that enhance productivity and competitiveness.
Risks exist and require ongoing attention. The external-heavy structure creates vulnerability to exchange rate fluctuations, with TZS depreciation increasing local currency debt service costs. Global interest rate trends affect borrowing conditions and refinancing costs. Revenue performance must keep pace with debt service obligations to maintain fiscal balance.
However, these risks are actively managed through strategic debt policies, reserve accumulation, domestic market development, and prudent fiscal management. The expanding domestic debt market, improving revenue mobilization, strong economic growth, and careful project selection all contribute to sustainable debt dynamics.
Looking forward, maintaining this positive trajectory requires continued policy discipline, strategic borrowing focused on high-return investments, ongoing domestic market development, and adaptive responses to global economic conditions. With these elements in place, Tanzania's debt position supports rather than constrains development ambitions, providing financing for transformative investments while preserving macroeconomic stability.
Tanzania External Debt Stock Analysis - November 2025 | TICGL Economic Insights
Tanzania External Debt Stock Analysis
Comprehensive Breakdown by Borrower, Currency & Usage
November 2025 Report
$36.1B
Total External Debt
78.9%
Central Government Share
66.8%
USD-Denominated Debt
77.3%
General Government Usage
Introduction
As of November 2025, Tanzania's external debt profile reveals a development-oriented structure predominantly driven by government borrowing. With total external debt standing at USD 36.1 billion, the central government accounts for USD 28.5 billion (78.9%), underscoring the critical role of public financing in infrastructure and social development projects. The debt composition shows significant USD exposure (66.8%), making exchange rate stability essential for sustainable debt management.
Key Takeaway:
Tanzania's external debt structure supports large-scale development financing but requires continued fiscal discipline, export growth, and prudent debt management to maintain macroeconomic stability. Recent shilling appreciation and ample foreign exchange reserves provide important buffers against currency risk.
1. External Debt Stock by Borrower
The borrower structure reveals overwhelming concentration in the central government, placing primary responsibility for debt management and repayment on public finances.
Borrower Category
Amount (USD Million)
Percentage Share
Central Government
28,528.1
78.9%
Private Sector
7,040.8
19.5%
Public Corporations
558.9
1.5%
Total External Debt
36,127.8
100%
Analysis:
External borrowing is heavily concentrated in the central government, emphasizing the critical importance of fiscal discipline and effective debt management to maintain macroeconomic stability. The private sector's 19.5% share indicates moderate but growing participation in external financing.
2. Disbursed Outstanding External Debt by User of Funds
The allocation of external funds demonstrates government-led development financing, with significant resources directed toward infrastructure and social services.
User of Funds
Amount (USD Million)
Percentage Share
General Government
27,922.7
77.3%
Non-Financial Private Sector
6,109.4
16.9%
Financial Institutions
2,095.7
5.8%
Total Disbursed Debt
36,127.8
100%
Policy Insight:
The general government's dominant position reflects strategic use of foreign financing for high-impact public projects. The growing private sector share demonstrates deepening financial integration and productive investment in sectors like mining and manufacturing.
3. Currency Composition Analysis
Currency composition reveals significant USD exposure with partial diversification across major international currencies.
Currency
Amount (USD Million)
Percentage Share
US Dollar (USD)
24,127.7
66.8%
Euro (EUR)
6,333.6
17.5%
Japanese Yen (JPY)
3,219.0
8.9%
Chinese Yuan (CNY)
1,334.5
3.7%
Other Currencies
1,112.9
3.1%
Total
36,127.8
100%
Risk Assessment:
The dominance of USD-denominated debt creates vulnerability to exchange rate fluctuations. However, Tanzania's recent shilling appreciation to approximately 2,445 TZS/USD in November 2025 has helped reduce the real burden. Diversification into EUR, JPY, and CNY from multilateral and bilateral lenders provides important risk mitigation.
4. Comprehensive Assessment
Strengths
Government-led borrowing focused on productive infrastructure investments
Limited public corporation participation in external financing
Potential crowding out effects on private sector
Dependence on export performance for debt servicing capacity
Policy Implications
Sustained exchange rate stability is critical for debt management
Continued export growth (gold, tourism) essential for FX earnings
Prudent debt management and preference for concessional loans
Strong fiscal oversight and discipline required
Focus on productive investments with high returns
5. Macroeconomic Context & Outlook
Integration with Broader Fiscal Picture
This external debt profile complements Tanzania's overall debt position, with total national debt standing at approximately USD 51.87 billion, indicating that external debt represents roughly 70% of total obligations. Key contextual factors include:
Tanzania's external debt profile as of November 2025 demonstrates a strategic, development-focused borrowing approach with total obligations of USD 36.1 billion. The structure—predominantly government-borrowed, government-used, and USD-denominated—supports essential infrastructure and social development while creating specific vulnerabilities that require careful management.
The path forward requires balancing development financing needs with prudent debt management, maintaining exchange rate stability through robust export performance, and ensuring borrowed funds generate productive returns. With continued fiscal discipline and strategic economic management overseen by the Bank of Tanzania, the current debt structure remains sustainable and supportive of Tanzania's long-term development objectives.
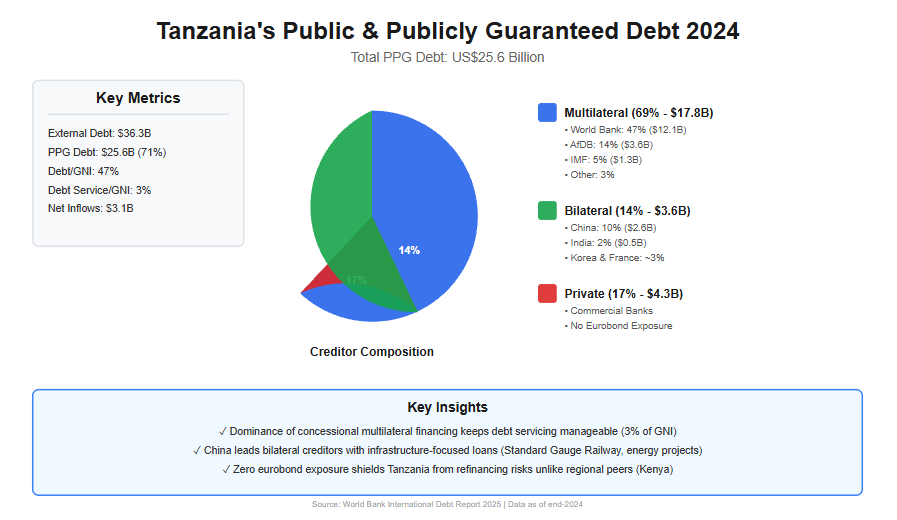
By the end of 2024, Tanzania’s external debt landscape had reached a critical juncture, reflecting a decade of accelerated borrowing to finance infrastructure, energy, and social development priorities. According to the World Bank’s International Debt Report 2025, Tanzania’s total external debt stock stood at US$36.3 billion, more than four times higher than the US$8.9 billion recorded in 2010. Within this total, Public and Publicly Guaranteed (PPG) debt accounted for approximately US$25.6 billion, underscoring the central role of government-backed borrowing in shaping the country’s fiscal position.
The structure of Tanzania’s public debt financing in 2024 is heavily tilted toward multilateral institutions, a feature that distinguishes Tanzania from several of its East African peers and has important implications for sustainability. Multilateral creditors—including the World Bank, the African Development Bank (AfDB), and the International Monetary Fund (IMF)—collectively financed about 69% of Tanzania’s PPG external debt, equivalent to roughly US$17.8 billion. The World Bank alone accounted for US$12.1 billion, representing nearly half (47%) of total PPG debt, making it Tanzania’s single largest creditor. This reliance on concessional multilateral finance has helped Tanzania maintain relatively low debt-servicing pressures, with debt service consuming only 3% of Gross National Income (GNI) and 12% of export earnings in 2024—well below Kenya’s 5% of GNI and 27% of exports.
Bilateral creditors played a secondary but strategically significant role, financing approximately 14% of PPG debt, or US$3.6 billion. Within this category, China emerged as the dominant bilateral lender, holding an estimated US$2.6 billion, equivalent to around 10% of total PPG debt. These loans are largely associated with large-scale infrastructure projects, including transport and energy investments, which have long-term growth potential but also carry execution and revenue risks. Other bilateral partners—such as India, Korea, and France—collectively accounted for smaller shares (each around 1–2%), often targeting sector-specific development initiatives.
Private creditors represented a growing but more risk-sensitive component of Tanzania’s public debt portfolio. In 2024, private creditors—primarily commercial banks and other private lenders—held approximately US$4.3 billion, or 17% of PPG debt. Notably, Tanzania had no exposure to international bondholders, unlike regional peers such as Kenya. This absence of eurobond debt has shielded Tanzania from rollover and refinancing risks during a period of elevated global interest rates, reinforcing short-term debt sustainability. However, private loans typically carry higher interest rates and shorter maturities, meaning their rising share could increase fiscal pressure if not carefully managed.
From a sustainability perspective, Tanzania’s creditor composition offers both reassurance and caution. On the one hand, the dominance of concessional multilateral financing has kept debt servicing costs manageable and supported macroeconomic stability, even as net external debt inflows reached US$3.1 billion in 2024—the highest in East Africa. On the other hand, continued reliance on external borrowing, particularly in a context where external debt equals 47% of GNI and 222% of export earnings, exposes Tanzania to exchange rate shocks and export volatility.
Ultimately, who finances Tanzania’s public debt matters as much as how much is borrowed. In 2024, Tanzania’s public debt sustainability was underpinned by favorable creditor terms rather than low debt levels. Maintaining this position will require disciplined borrowing, stronger export growth, and ensuring that debt-financed investments generate sufficient economic returns to support repayment over the medium to long term. Read More of This Topic:External Debt Stock by Borrower
Overview of PPG Debt in Tanzania
PPG debt includes loans to the public sector that are guaranteed by the government, encompassing borrowings from official creditors (multilateral and bilateral) and private sources. By the end of 2024, Tanzania's PPG debt (including IMF credit) stood at approximately US$25.6 billion, accounting for a significant portion of the country's long-term external debt. This figure reflects Tanzania's strategy of leveraging concessional financing to fund development priorities, but it also underscores vulnerabilities to global interest rate shifts and currency fluctuations.
The creditor composition reveals a heavy dependence on multilateral lenders, which provide favorable terms such as longer maturities and lower interest rates. This has helped keep debt servicing burdens manageable—at 3% of GNI and 12% of exports in 2024—compared to regional peers like Kenya (5% of GNI and 27% of exports). However, with net debt inflows reaching US$3.1 billion in 2024, the highest in East Africa, ongoing borrowing could strain future fiscal space if export growth falters.
Detailed Breakdown by Creditor and Type
The following table presents Tanzania's PPG debt in 2024, categorized by creditor type and key sub-creditors. Data is sourced from the International Debt Report 2025, with specific breakdowns estimated from the report's visual representations (e.g., pie charts in Figure 1). Amounts are in US$ million, and percentages are approximate, reflecting rounded values from the report. IMF credit is integrated under multilateral creditors, as per the report's methodology, contributing to the total PPG figure of US$25,593 million (derived from long-term PPG of US$24,277 million plus IMF credit of US$1,316 million).
Creditor Type
Sub-Creditor/Creditor
Amount (US$ million)
% of Total PPG (incl. IMF)
Multilateral (excl. IMF)
Total Multilateral (excl. IMF)
16,435
~64%
World Bank
12,097
~47%
AfDB (African Development Bank)
~3,583 (est.)
~14%
Other Multilateral
~4,351 (est.)
~17%
IMF Credit
IMF
1,316
~5% (reported as 6% in figure)
Bilateral
Total Bilateral
3,571
~14%
China
~2,559 (est.)
~10%
India
~512 (est.)
~2%
Korea, Rep.
~512 (est.)
~2%
France
~256 (est.)
~1%
Other Bilateral
~1,538 (est.)
~6%
Private Creditors
Total Private
4,272
~17%
Bondholders
..
0%
Commercial Banks and Others
4,272
~17% (incl. other commercial ~4%)
Total PPG (incl. IMF)
25,593
100%
Notes:
Estimates for sub-creditors (e.g., AfDB, China) are calculated by applying percentages from the report's Figure 1 to the total PPG (including IMF). Minor discrepancies may arise due to rounding in visual data.
".." indicates negligible or unavailable data.
The World Bank dominates multilateral lending, funding key sectors like transport and energy. Bilateral debt is led by China, often tied to infrastructure projects under initiatives like the Belt and Road.
Private creditors, primarily commercial banks, have grown in influence, reflecting Tanzania's improving access to market-based financing.
Key Insights and Implications
The dominance of multilateral creditors (around 69% including IMF) in Tanzania's PPG debt portfolio is a double-edged sword. On one hand, it ensures concessional terms that support debt sustainability; the World Bank and AfDB together account for over 60% of this category, financing projects aligned with Tanzania's National Development Vision 2025. IMF credit, at US$1,316 million, has provided balance-of-payments support, particularly post-COVID recovery.
Bilateral creditors, making up 14%, highlight strategic partnerships. China's ~10% share is notable, linked to major investments like the Standard Gauge Railway and power plants. Smaller contributions from India, Korea, and France often focus on sector-specific aid, such as agriculture and technology.
Private creditors' 17% share signals maturing financial markets but introduces risks, as these loans typically carry higher interest rates and shorter terms. With no bondholder debt reported, Tanzania has avoided eurobond exposures seen in peers like Kenya, reducing immediate refinancing pressures.
In the East African context, Tanzania's PPG composition favors stability compared to Rwanda (94% debt-to-GNI) or Ethiopia (311% debt-to-exports). However, as global conditions tighten, diversifying creditors and boosting exports (e.g., through mining and agriculture) will be crucial. The report emphasizes debt transparency and management reforms to mitigate risks.
External Debt Dominates at 70.6% (Sept 2025)
As of September 2025, Tanzania’s total public debt stood at TZS 127,474.5 billion, with external debt accounting for 70.6% (TZS 90,015.4 billion) and domestic debt contributing 29.4% (TZS 37,459.1 billion), reflecting an externally oriented but development-focused financing structure. The external portfolio—converted from USD 35.4 billion using the average rate of TZS 2,471.69/USD—is primarily held by the central government (77.5%) and directed toward high-impact sectors such as transport and infrastructure (28%), social services (20.4%), and energy/minerals (14.3%). Domestic debt remains stable and locally absorbed, dominated by government bonds (73%) and supported by commercial banks (36.4%) and pension funds (23.9%), indicating a deep and liquid local market. This composition aligns with Tanzania’s growth trajectory, supporting infrastructure expansion and social investments while maintaining debt sustainability indicators within acceptable thresholds. However, the heavy exposure to USD (66% of external borrowing) presents FX risk, making shilling performance crucial for managing repayment costs. Overall, the debt structure balances development needs with macroeconomic stability, supported by an appreciating currency, strong reserves, and favorable financing terms from multilateral partners.
1. Tanzania National Debt Overview (September 2025)
Tanzania’s total public debt consists of external debt and domestic debt.
Summary Table — National Debt (TZS)
Debt Category
Amount (TZS Billion)
Notes
External debt stock
90,015.4 billion
Converted from USD 35.4bn using average rate TZS 2,471.69/USD 2025110720064684
Domestic debt stock
37,459.1 billion
From BoT monthly review 2025110720064684
Total public debt
127,474.5 billion
Combination of external + domestic
2. Debt Conversion Explanation
The external debt is originally reported in USD. The report’s exchange rate is:
TZS 2,471.69 per USD (September 2025 average)
USD 35,438.2 million × 2,471.69 = TZS 90,015.4 billion
Domestic debt is already in TZS in the document:
TZS 37,459.1 billion
3. Detailed Breakdown — External Debt (Converted to TZS)
3.1 External Debt Stock by Borrower
Borrower Category
Amount (USD Million)
Amount (TZS Billion)
% Share
Central Government
27,461.3
67,854.5
77.5%
Private Sector
5,357.0
13,231.0
15.1%
Government Guaranteed
2,619.9
6,466.0
7.4%
Total
35,438.2
90,015.4
100%
(All USD values from document summary)
3.2 External Debt by User of Funds (Converted to TZS)
Sector / Use of Funds
Amount (USD Million)
Amount (TZS Billion)
% Share
Transport & Infrastructure
9,910.4
24,508.1
28.0%
Social services (Education & Health)
7,238.1
17,895.8
20.4%
Energy & Minerals
5,058.7
12,506.2
14.3%
Agriculture & Water
4,964.3
12,280.9
14.0%
Finance & Insurance
1,794.7
4,436.6
5.1%
Industry & Trade
1,494.9
3,691.7
4.2%
Others
4,977.1
12,703.7
14.0%
Total
35,438.2
90,015.4
100%
✔ Converted using TZS 2,471.69/USD.
4. Detailed Breakdown — Domestic Debt (TZS)
4.1 Domestic Debt Structure by Creditor Category
Creditor Category
Share (%)
Amount (TZS Billion)
Commercial Banks
36.4%
13,626.1
Pension Funds
23.9%
8,946.7
Other Financial Institutions
39.7%
14,886.3
Total Domestic Debt
100%
37,459.1
4.2 Domestic Debt by Instrument Type
Instrument Type
Share (%)
Amount (TZS Billion)
Government Bonds
73%
27,349.1
Treasury Bills
27%
10,110.0
Total
100%
37,459.1
5. Combined National Debt Summary (in TZS)
Component
Amount (TZS Billion)
% of Total
External Debt
90,015.4
70.6%
Domestic Debt
37,459.1
29.4%
Total Debt
127,474.5
100%
6. Final Summary Table — Tanzania National Debt (TZS)
Item
External Debt (TZS bn)
Domestic Debt (TZS bn)
Total (TZS bn)
Debt Stock
90,015.4
37,459.1
127,474.5
Share of Total
70.6%
29.4%
100%
Main Creditors
Multilaterals, Bilaterals
Banks, Pension Funds
—
Primary Risks
FX risk (USD)
Refinancing risk
—
Implications of Tanzania's National Debt Structure in September 2025
The breakdown of Tanzania's national debt as of September 2025, detailed in Section 2.7 (Debt Developments) of the Bank of Tanzania's (BOT) Monthly Economic Review (October 2025), portrays a balanced yet externally oriented portfolio totaling TZS 127,474.5 billion (equivalent to ~USD 51.6 billion at TZS 2,471.69/USD). External debt dominates at 70.6% (TZS 90,015.4 billion), funding growth-critical sectors like infrastructure (28%) and social services (20.4%), while domestic debt (29.4%, TZS 37,459.1 billion) relies on stable local institutions (e.g., banks 36.4%, pensions 23.9%). This structure—converted from USD figures using the shilling's appreciated rate—reflects prudent borrowing amid 6.3% Q2 GDP growth, low 3.4% inflation, and a TZS 618.5 billion fiscal deficit (partly debt-financed). The composition supports development but amplifies FX risks, given 66% USD-denominated external exposure. Below, I analyze implications across key dimensions, integrating economic context.
1. Debt Composition: External Dominance for Growth Financing
External Debt (70.6%, TZS 90,015.4B): Predominantly central government (77.5%, TZS 67,854.5B), with private sector (15.1%) and guarantees (7.4%) adding diversification. Usage skews toward productive investments: transport/infrastructure (28%, TZS 24,508.1B) aligns with construction's 1.1% GDP contribution, energy/minerals (14.3%, TZS 12,506.2B) supports mining growth (1.5% GDP), and agriculture/water (14%, TZS 12,280.9B) bolsters food security (NFRA stocks at 570,519 tonnes). Concessional terms (57% multilateral) keep costs low (~1.2% interest).
Domestic Debt (29.4%, TZS 37,459.1B): Bonds dominate (73%, TZS 27,349.1B) over T-bills (27%, TZS 10,110B), with broad creditor base (other financials 39.7%) indicating deep local markets (oversubscription in securities). This reduces FX volatility spillovers.
Broader Implications:
Positive: Funds 71.9% expenditure execution (TZS 3,346.6B), enabling 6% full-year GDP projection via reliable power and exports. Shilling appreciation (+9.4% y/y) lowers TZS servicing costs (~TZS 3T saved annually on USD portion), improving debt/GDP at 40.1% (below EAC 50% threshold).
Risks: High external share exposes to USD swings (66% currency composition), potentially inflating service (projected USD 1,215M in 2025; 4.2% of exports). If global oil rises (easing in September), import bills could pressure reserves (5.8 months cover).
2. Sustainability and Servicing Dynamics
Borrower and Creditor Profile: Central government's 77.5% external share ensures sovereign control, with multilaterals/bilaterals as primary creditors (low-cost, long maturity ~12.8 years). Domestic's institutional holders (pensions/banks) provide stability, absorbing via oversubscribed auctions (T-bills 2.4x).
Fund Utilization: 82.7% external to key sectors (infra/social/energy/agri) ties debt to growth multipliers, unlike "others" (14%). This supports private credit (16.1% y/y) without crowding out.
Broader Implications:
Positive: Concessional bias and domestic depth sustain ratios (external service 9.8% exports, down from 11.2% 2024). Aligns with monetary policy (CBR 5.75%), keeping real yields positive (vs. 3.4% inflation) and IBCM stable (6.45%).
Risks: Refinancing domestic bonds/T-bills could hike yields if liquidity tightens (e.g., from revenue shortfalls like mining taxes; 87.2% collection). Cumulative growth (+1.4% MoM total debt) demands revenue diversification beyond gold/tourism.
3. Fiscal and Macroeconomic Linkages
Budgetary Pressures: Debt finances recurrent/development gaps (TZS 2,073.7B/1,272.9B), with servicing rising as % of spend amid delays (71.9% execution). Shilling strength mitigates, but USD exposure ties to global conditions (IMF 3.2% growth).
Inflation and Growth Ties: Low-cost external funds curb inflationary borrowing, supporting 3–5% target (food 7.0% eased by stocks;). In Zanzibar, analogous structure aids tourism/external performance.
Risks: FX depreciation (reversed from 2024's -10.1%) could balloon TZS costs by 10–15%, straining deficit. Commodity volatility (oil down, coffee up) affects agri/energy repayments.
4. Policy Context from the Review
Synergies: Debt supports fiscal-monetary prudence, with BOT interventions (USD 11M net sale) buffering risks. Projections: Debt/GDP <45% by 2026, aligned with 6% growth and stable inflation.
Outlook: Strengthen domestic market (e.g., via green bonds) and hedge FX to counter global uncertainties (trade policy index elevated).
Component
Amount (TZS Billion)
% of Total
Key Implication
External Debt
90,015.4
70.6%
Funds infra/social growth; FX risk from USD (66%).
└ Central Govt
67,854.5
77.5% (of external)
Sovereign focus; concessional (57% multilateral).
└ Infra/Transport
24,508.1
28% (of external)
Boosts GDP via construction/mining.
Domestic Debt
37,459.1
29.4%
Stable local absorption; bonds (73%) for duration.
└ Commercial Banks
13,626.1
36.4% (of domestic)
Liquidity tie to IBCM surge (+37.4%; Section 2.5).
Total Debt
127,474.5
100%
Sustainable at 40.1% GDP; supports 6% growth projection.
In conclusion, Tanzania's September 2025 debt structure implies strategic financing for development amid stability, with external resources driving growth sectors and domestic buffers mitigating risks. The 70.6% external tilt underscores FX vigilance, but concessional terms and shilling strength ensure sustainability—reinforcing the Review's narrative of prudent policies for 2026 resilience.
As of June/July 2025, Tanzania’s national debt reached approximately TZS 115.0 trillion, up 1% from the previous month, with external debt (TZS 81.0 trillion, 70.7%) dominating over domestic debt (TZS 34.0 trillion, 29.3%). The bulk of external borrowing is owed by the central government (85.4%), largely to multilateral institutions (58.7%) and commercial lenders (34.8%), while domestic debt remains concentrated in Treasury bonds (79.7%) held mainly by commercial banks and pension funds. Despite rising obligations, debt levels remain manageable, supported by strong tax performance and a June fiscal surplus. On the currency front, the Tanzania Shilling averaged TZS 2,666.79 per USD in July 2025, a 1.3% monthly depreciation but only a 0.11% annual decline, underscoring relative stability. This resilience is underpinned by robust foreign reserves (USD 6.2 billion, equivalent to ~TZS 16.5 trillion, covering five months of imports), strong export inflows (gold and tourism), and timely BoT interventions, which together cushion external risks while sustaining investor confidence.
Other creditors (public institutions, companies, individuals): 18.3%
Insurance Companies: 5.1%
BoT Special Funds: 2.2%
Table: Tanzania National Debt (June/July 2025)
Category
Amount (USD Million / TZS Billion)
Share (%)
Total National Debt
USD 46,586.6m
100
External Debt
USD 32,955.5m
70.7
├─ Central Government
USD 28,133.7m
85.4*
├─ Private Sector
USD 4,820.6m
14.6*
└─ Public Corporations
USD 1.3m
0.0*
Domestic Debt
TZS 35,351.4b (~USD 13,631m)
29.3
├─ Treasury Bonds
TZS 28,189.8b (79.7%)
—
├─ Treasury Bills
TZS 2,016.9b (5.7%)
—
├─ Other (Overdraft, etc.)
TZS 5,008.9b (14.2%)
—
*Percentages within external debt.
2. Tanzania Shilling (TZS) – Stability and Performance
Exchange Rate (July 2025):
Averaged TZS 2,666.79 per USD, compared to TZS 2,631.56 per USD in June 2025.
This is a monthly depreciation of about 1.3%.
Annual Movement:
Shilling depreciated at an annual rate of 0.11%, compared to 0.21% in June 2025.
Shows relative stability year-on-year.
Reserves:
FX reserves stood at USD 6,194.4m at end-July 2025, enough to cover 5 months of imports, meeting EAC and SADC benchmarks.
Drivers of Stability:
Export inflows (gold, cashew, cereals, tourism).
BoT interventions (USD 17.5m sold in July 2025).
High reserves acting as a buffer against shocks.
Economic Implications of Tanzania’s National Debt and Shilling Performance – June/July 2025
1. Tanzania National Debt (June/July 2025)
Total National Debt: Reached USD 46,586.6 million by June 2025, up 1% from the previous month, with 70.7% (USD 32,955.5 million) as external debt and 29.3% (TZS 35,351.4 billion, ~USD 13,631 million) as domestic debt.
External Debt:
Stock at USD 32,955.5 million, with 85.4% owed by the central government (USD 28,133.7 million), 14.6% by the private sector (USD 4,820.6 million), and a negligible 0.0% by public corporations (USD 1.3 million).
Domestic Debt: TZS 35,351.4 billion, with 79.7% in Treasury bonds, 5.7% in Treasury bills, 0.4% in government stocks, and 14.2% in non-securitized debt (e.g., overdrafts). Creditors are led by commercial banks (28.8%), pension funds (26.4%), Bank of Tanzania (19.2%), other creditors (18.3%), insurance companies (5.1%), and BoT special funds (2.2%).
Economic Implications:
The 1% debt increase reflects ongoing financing needs, with external debt’s 70.7% share (USD 32,955.5 million) highlighting reliance on foreign capital, manageable at ~40% of GDP per IMF estimates. Multilateral loans (58.7%) offer concessional terms, reducing interest burdens, but commercial debt’s 34.8% share (USD 11,458.3 million) exposes Tanzania to market volatility and higher costs (e.g., global rates at 2.8% per IMF 2025 forecast).
Domestic debt’s stability (TZS 35,351.4 billion, down 0.4% from June) and bond dominance (79.7%) indicate strong local absorption by banks and pension funds (55.2% combined), supporting fiscal operations (TZS 403.4 billion surplus in June). However, the 14.2% non-securitized portion (overdrafts) suggests short-term liquidity pressures.
Risks include a moderate debt distress risk (World Bank), with 68.9% of external debt USD-denominated, amplifying costs if the shilling weakens further. Opportunities lie in leveraging multilateral support for infrastructure (e.g., SGR, USD 7.6 billion) to boost 6% GDP growth.
2. Tanzania Shilling (TZS) – Stability and Performance
Exchange Rate: Averaged TZS 2,666.79 per USD in July 2025, a 1.3% monthly depreciation from TZS 2,631.56 in June, but an annual depreciation of just 0.11% (down from 0.21% in June), indicating year-on-year stability.
Reserves: Foreign exchange reserves hit USD 6,194.4 million, covering 5 months of imports, exceeding EAC/SADC benchmarks (4 months).
Drivers: Stability is fueled by export inflows (gold USD 3,977.6 million, tourism USD 3,871.9 million), BoT interventions (USD 17.5 million sold in July), and robust reserves.
Economic Meaning:
The 1.3% monthly depreciation reflects seasonal import pressures (USD 17,603.1 million) and USD demand for debt servicing (USD 234.4 million in June), yet the 0.11% annual rate underscores stability, supported by a 17.7% export rise (gold +21.9%, cereals tripled). Reserves (USD 6,194.4 million) provide a strong buffer, enhancing investor confidence (Fitch B+ rating).
BoT’s active management (e.g., USD 62.3 million sold in March) and export growth (USD 9,479.4 million) counter depreciation, aligning with a 6% GDP projection. However, 70% USD-denominated external debt poses a risk if depreciation accelerates, potentially raising debt servicing costs by TZS 1-2 trillion annually.
Compared to 2023’s 8% depreciation, the current stability (0.11% annual) reflects policy success (CBR 5.75%), though import reliance and global rate hikes could challenge this if export growth slows.
Summary of Broader Economic Significance
Debt Dynamics: The USD 46,586.6 million debt, with a balanced external-domestic mix, supports growth (6%) but requires cautious management to avoid distress, especially with commercial debt exposure (34.8%).
Shilling Resilience: The shilling’s stability (0.11% annual depreciation) and reserves (5 months cover) bolster trade and investment, though USD debt sensitivity remains a vulnerability.
Outlook: Sustained export growth and reserve strength could mitigate risks, but fiscal discipline and import control are key to maintaining this trajectory amid global uncertainties (e.g., oil at USD 69.2/barrel).
The Bank of Tanzania’s August 2025 review shows that Tanzania’s external debt stock stood at USD 32,955.5 million in June 2025, with the central government accounting for 85.4% (USD 28,133.7 million) and the private sector holding 14.6% (USD 4,820.6 million). By sectoral use, debt was mainly channeled into transport and telecommunications (28.6%), social welfare and education (18.5%), and energy and mining (16.7%), underscoring the focus on infrastructure and human capital development. In terms of currency composition, the debt portfolio remains highly exposed to the US dollar (69.8%), followed by the euro (18.1%), with smaller shares in the yen (5.4%) and yuan (3.2%). This structure highlights Tanzania’s reliance on public borrowing to fund long-term projects while emphasizing the importance of managing currency risk in debt servicing.
1. External Debt Stock by Borrower (June 2025)
Total external debt stock:USD 32,955.5 million.
Public sector dominates: Central Government accounts for 85.4%, while private sector holds 14.6%.
Details:
Central Government: USD 28,133.7m (85.4%)
Private Sector: USD 4,820.6m (14.6%)
Public Corporations: USD 1.3m (≈0.0%)
2. Disbursed Outstanding Debt by Use of Funds (June 2025, % Share)
Transport & telecommunications: 28.6%
Social welfare & education: 18.5%
Energy & mining: 16.7%
Agriculture: 6.4%
Industries: 5.7%
Other sectors (including finance, trade, etc.): 24.1%
Table 1: External Debt Stock by Borrower (June 2025)
Borrower
Amount (USD Million)
Share (%)
Central Government
28,133.7
85.4
Private Sector
4,820.6
14.6
Public Corporations
1.3
0.0
Total
32,955.5
100
Table 2: Disbursed Outstanding Debt by Use of Funds (%)
Sector / Use of Funds
Share (%)
Transport & Telecommunications
28.6
Social Welfare & Education
18.5
Energy & Mining
16.7
Agriculture
6.4
Industries
5.7
Other Sectors
24.1
Total
100
Table 3: External Debt by Currency Composition (%)
Currency
Share (%)
US Dollar (USD)
69.8
Euro (EUR)
18.1
Japanese Yen
5.4
Chinese Yuan
3.2
Other
3.5
Total
100
Economic Implications of External Debt Profile – June 2025
1. External Debt Stock by Borrower (June 2025)
Composition: The total external debt stock is USD 32,955.5 million, with the central government holding USD 28,133.7 million (85.4%), the private sector USD 4,820.6 million (14.6%), and public corporations a negligible USD 1.3 million (0.0%).
Economic Meaning: The heavy public sector dominance (85.4%) underscores the government's role in financing large-scale infrastructure and social projects, aligning with development goals (e.g., Vision 2050 targeting a USD 1 trillion economy). This reduces private sector borrowing pressure, supporting credit growth (15.9% annually), but increases public debt servicing risks (national debt at USD 46,586.6 million). The minimal public corporation share suggests limited state-owned enterprise reliance on external funds, potentially reflecting fiscal discipline. Compared to regional peers (e.g., Kenya’s 60% public share), Tanzania's high public borrowing may enhance state-led growth but requires robust revenue mobilization (tax revenue at TZS 3,108.7 billion) to sustain.
2. Disbursed Outstanding Debt by Use of Funds (June 2025, % Share)
Allocation: Transport and telecommunications lead at 28.6%, followed by social welfare and education (18.5%), energy and mining (16.7%), agriculture (6.4%), industries (5.7%), and other sectors (24.1%).
Economic Significance: The 47.1% allocation to transport/telecoms and social sectors supports long-term growth by improving connectivity (e.g., roads, digital infrastructure) and human capital (education, health), key to Tanzania’s 6% GDP growth projection. Energy and mining (16.7%) bolster resource exports (gold at USD 3,977.6 million), while the low agriculture (6.4%) and industries (5.7%) shares may hinder diversification, a noted challenge in IMF assessments. The "other" category (24.1%) likely includes trade and finance, indicating broad sectoral support. This mix reflects a development-focused strategy, but underinvestment in agriculture (despite 27% GDP contribution) could limit rural growth and food security (stocks at 485,930.4 tonnes).
Breakdown: USD dominates at 69.8%, followed by EUR (18.1%), JPY (5.4%), CNY (3.2%), and other currencies (3.5%).
Economic Implications: The 69.8% USD exposure heightens vulnerability to exchange rate fluctuations, especially with the TZS depreciating 1.34% to 2,666.79/USD in July 2025. A stronger dollar (e.g., amid global trade tensions) could raise debt servicing costs, straining public finances (surplus TZS 403.4 billion in June). Diversification into EUR (18.1%) and JPY (5.4%) mitigates some risk, reflecting loans from multilateral institutions (e.g., IMF, World Bank). The low CNY share (3.2%) suggests limited Chinese financing compared to peers like Zambia, potentially reducing geopolitical debt dependency. Stable reserves (USD 6,194.4 million) provide a buffer, but currency risk remains a key concern.
Summary of Broader Economic Significance
Growth and Development: The debt structure supports infrastructure and social investment, driving Tanzania’s 6% growth outlook and export resilience (USD 9,479.4 million in goods). Public sector dominance ensures state-led progress, but private sector growth (14.6%) needs nurturing to diversify the economy.
Risk Management: High USD exposure (69.8%) and public debt concentration (85.4%) pose exchange rate and fiscal risks, though reserves and a fiscal surplus offer stability. This aligns with IMF’s moderate debt distress risk assessment, but prudent management is critical.
Comparative Context: Compared to 2024 (USD 32.89 billion), the slight rise to USD 32,955.5 million reflects controlled borrowing, outperforming countries with higher debt-to-GDP ratios (e.g., Ghana at 90%). The sectoral focus mirrors successful models like Rwanda’s infrastructure drive, but agriculture underfunding lags behind peers.
Future Outlook: Sustained tax revenue growth (107.8% of target) and export inflows (e.g., tourism at USD 3,871.9 million) could offset risks, though currency diversification and private sector debt expansion are needed for long-term sustainability.
Central Government Dominates Borrowing as USD Exposure Heightens Currency Risks
As of June 2025, Tanzania’s external debt stock stood at USD 32,955.5 million (approximately TZS 82.4 trillion, assuming an exchange rate of TZS 2,500/USD), reflecting a marginal increase of 0.1% from the previous month. This external debt comprises about 70.7% of the total national debt, highlighting the country's continued reliance on foreign financing. The central government remains the primary borrower, holding 85.4% of the external debt (USD 28.1 billion), followed by the private sector with 14.6% (USD 4.8 billion), while public corporations account for a negligible share. Most of the disbursed debt is allocated to priority sectors such as transport & telecommunications (25.4%), social welfare & education (21.3%), and energy & mining (16.4%). However, 67.6% of the debt is denominated in USD, exposing the country to significant exchange rate risks amid recent currency depreciation. Despite prudent debt servicing—interest arrears are relatively low—the narrow fiscal space underscores the need for careful management and stronger domestic revenue mobilization.
1. External Debt Stock by Borrower – June 2025
The external debt stock represents the total outstanding debt owed to foreign creditors, including principal and interest arrears. As of June 2025, Tanzania’s external debt stock stood at USD 32,955.5 million (approximately TZS 82.4 trillion, assuming an exchange rate of ~TZS 2,500/USD, consistent with recent BoT reports). This reflects a marginal monthly increase of 0.1% from May 2025 and accounts for approximately 70.7% of Tanzania’s total national debt (external and domestic combined).
Total External Debt
Amount: USD 32,955.5 million
Monthly Increase: +0.1% (approximately USD 32.9 million, assuming May 2025 debt was ~USD 32,922.6 million).
Share of Total National Debt: ~70.7%, indicating a significant reliance on external financing compared to domestic debt (e.g., TZS 32,615.7 billion in September 2024, per TICGL).
Context: The slight increase aligns with trends observed in earlier months, such as a 0.5% decline from December 2024 to January 2025 (USD 33,905.1 million to USD 33,137.7 million), followed by an increase to USD 35,039.8 million by February 2025, reflecting fluctuations due to new disbursements and debt servicing. The African Development Bank notes that Tanzania’s fiscal deficit, projected at 2.5% of GDP in FY 2024/25, is partly financed by external borrowing, supporting this trend.
Breakdown by Borrower
The following table summarizes the external debt stock by borrower category for June 2025:
Borrower
Amount (USD Million)
Share of Total External Debt (%)
DOD (USD Million)
Interest Arrears (USD Million)
Central Government
28,133.7
85.4%
28,055.0
78.7
Private Sector
4,820.6
14.6%
4,630.7
189.9
Public Corporations
1.3
Negligible
—
—
Central Government:
Amount: USD 28,133.7 million (85.4% of total external debt).
Disbursed Outstanding Debt (DOD): USD 28,055.0 million, indicating that nearly all central government debt is disbursed and actively financing projects.
Interest Arrears: USD 78.7 million, a minor portion (0.28% of central government debt), suggesting effective debt servicing for public debt.
Context: The central government’s dominance (85.4%) is consistent with historical trends, with shares of 76.8% in November 2024 and 78.1% in September 2024. This reflects the government’s role in funding major infrastructure projects (e.g., Standard Gauge Railway, Julius Nyerere Hydropower Project) and social services, as noted in the FY 2024/25 budget allocating TZS 14.08 trillion for development expenditure.
Implications: The high share underscores the public sector’s reliance on external financing for development goals, placing a significant repayment burden on public finances. The low interest arrears indicate prudent debt management, supported by multilateral concessional loans (54.5% of external debt in November 2024).
Private Sector:
Amount: USD 4,820.6 million (14.6% of total external debt).
DOD: USD 4,630.7 million, with interest arrears of USD 189.9 million (3.9% of private sector debt).
Context: The private sector’s share has declined slightly from 23.6% in January 2025 (USD 8,004.7 million) and 21% in December 2019, reflecting reduced access to foreign credit, possibly due to tighter global lending conditions or currency risks. The World Bank notes that private sector borrowing constraints may hinder economic diversification.
Implications: The higher interest arrears (relative to the central government) suggest challenges in private sector debt servicing, potentially due to exchange rate fluctuations (67.6% USD-denominated debt) or weaker cash flows in sectors like agriculture and industry.
Public Corporations:
Amount: USD 1.3 million (negligible share).
Context: Public corporations (e.g., TANESCO, Tanzania Ports Authority) have minimal external debt exposure, consistent with January 2025 (USD 3.8 million). This reduces government liability risks from state-owned enterprises.
Implications: The negligible share reflects a deliberate strategy to limit public corporation borrowing, aligning with fiscal reforms to improve state-owned enterprise performance, as evidenced by TZS 1.028 trillion in dividends collected in FY 2024/25.
Key Takeaway
The central government’s 85.4% share of external debt highlights its role in driving debt-financed development, particularly in infrastructure and social services. The private sector’s reduced share and higher arrears indicate challenges in accessing and servicing foreign credit. The negligible debt of public corporations minimizes fiscal risks but limits their role in external financing.
2. Disbursed Outstanding Debt (DOD) by Use of Funds – % Share
The DOD represents the portion of external debt that has been disbursed and is actively funding projects or sectors. The allocation of DOD reflects Tanzania’s development priorities under Vision 2050 and the Third Five-Year Development Plan (FYDP III).
Breakdown by Use of Funds
The following table summarizes the percentage share of DOD by sector for June 2025:
Use of Funds
% Share
Transport & Telecommunication
25.4%
Social Welfare & Education
21.3%
Energy & Mining
16.4%
Budget Support
15.2%
Agriculture
6.5%
Finance & Insurance
5.1%
Industry
4.0%
Others (including water, BoP, etc.)
6.1%
Transport & Telecommunication (25.4%):
Context: This sector receives the largest share, consistent with historical trends (21.4% in November 2024, 21.5% in September 2024). Key projects include the Standard Gauge Railway (SGR), port expansions, and ICT infrastructure, aligning with Tanzania’s goal to enhance connectivity and trade under FYDP III.
Implications: Investments in transport (e.g., SGR, Dar es Salaam port) and telecommunications (e.g., 5G networks) support economic growth by improving logistics and digital access. However, the high allocation may crowd out funding for other sectors like agriculture.
Social Welfare & Education (21.3%):
Context: This sector’s significant share (20.4% in November 2024, 20.8% in September 2024) reflects investments in human capital, such as free education programs and healthcare infrastructure. The World Bank’s USD 227 million financing for climate and marine conservation in June 2025 also supports social welfare.
Implications: Funding education and social welfare enhances workforce development and poverty reduction, critical for long-term growth. However, recurrent costs (e.g., teacher salaries) may compete with capital investments.
Energy & Mining (16.4%):
Context: Investments in energy (e.g., Julius Nyerere Hydropower Plant) and mining (e.g., gold, critical minerals) align with Tanzania’s energy access goals and export growth (gold exports up 24.5% in April 2025). The sector’s share is slightly higher than November 2024 (15%).
Implications: Energy investments address power shortages, supporting industrial growth, while mining boosts export revenues. However, environmental and governance risks in mining require careful management.
Budget Support (15.2%):
Context: This share (19.9% in January 2025) reflects external loans used to finance recurrent expenditures, such as salaries and debt servicing. The African Development Bank notes that reliance on budget support poses fiscal risks if external financing decreases.
Implications: High budget support allocation indicates fiscal pressures, as seen in the TZS 270.2 billion deficit in May 2025. Reducing reliance on external budget support through domestic revenue mobilization (e.g., TZS 2,880.2 billion in May 2025) is critical.
Agriculture (6.5%):
Context: The low share (5.1% in September 2024) is surprising given agriculture’s role in Tanzania’s economy (25% of GDP, 65% of employment). Investments support irrigation and agribusiness but are limited compared to infrastructure.
Implications: Underfunding agriculture may constrain rural development and food security, despite export growth in cashew nuts (141% in April 2025).
Finance & Insurance (5.1%) and Industry (4.0%):
Context: These sectors receive minimal allocations (4.0% for industry in January 2025), reflecting limited focus on manufacturing and financial sector development. The World Bank highlights declining industrial productivity as a constraint on economic diversification.
Implications: Low funding may hinder Tanzania’s industrialization goals under Vision 2050, limiting job creation and export diversification.
Others (6.1%):
Context: Includes water, balance of payments support, and miscellaneous projects. The World Bank’s USD 300 million financing for disaster preparedness in June 2025 may contribute to this category.
Implications: Diverse allocations support resilience but dilute focus on priority sectors.
Key Takeaway
The focus on Transport & Telecommunication (25.4%) and Social Welfare & Education (21.3%) reflects Tanzania’s commitment to infrastructure-driven growth and human capital development. However, the low shares for agriculture (6.5%) and industry (4.0%) may limit inclusive growth, given their economic significance.
3. DOD by Currency Composition – % Share
The currency composition of DOD indicates the foreign currencies in which Tanzania’s external debt is denominated, exposing the country to exchange rate risks.
Breakdown by Currency
The following table summarizes the percentage share of DOD by currency for June 2025:
Currency
% Share
US Dollar (USD)
67.6%
Euro (EUR)
17.2%
Japanese Yen (JPY)
4.9%
Chinese Yuan (CNY)
3.4%
Special Drawing Rights (SDR)
3.0%
Others
3.9%
US Dollar (USD) (67.6%):
Context: The USD’s dominance is consistent with historical trends (67.4% in September 2024, 68.1% in January 2025). This reflects borrowing from multilateral institutions (e.g., World Bank, IMF) and commercial creditors, often denominated in USD.
Implications: High USD exposure makes Tanzania vulnerable to exchange rate fluctuations. The Tanzanian Shilling depreciated by 8% in 2023, increasing debt servicing costs. A stronger USD in 2025 could further strain public finances, as noted by The Citizen.
Euro (EUR) (17.2%):
Context: Euro-denominated debt (16.1% in January 2025) reflects loans from European institutions (e.g., European Investment Bank). The slight increase may indicate new Euro-based financing.
Implications: Diversification into Euros reduces USD reliance but exposes Tanzania to Eurozone economic conditions.
Japanese Yen (JPY) (4.9%) and Chinese Yuan (CNY) (3.4%):
Context: JPY and CNY shares align with bilateral loans from Japan and China, supporting infrastructure projects like the SGR. The CNY share is lower than in January 2025 (6.3%), possibly due to reduced Chinese lending.
Implications: These currencies provide some diversification, but their small shares limit risk mitigation.
Special Drawing Rights (SDR) (3.0%) and Others (3.9%):
Context: SDRs are used by multilateral institutions like the IMF, while “Others” include British Pound and minor currencies. The low SDR share reflects limited IMF financing in June 2025.
Implications: Diversified borrowing in SDRs and other currencies offers some stability but is insufficient to offset USD risks.
Key Takeaway
The 67.6% USD share exposes Tanzania to significant exchange rate risks, particularly with Shilling depreciation. Diversification into Euros, JPY, and CNY helps but is limited by their smaller shares. Prudent debt management and revenue mobilization are critical to mitigate currency risks.
The following table consolidates the key figures for June 2025:
Category
Key Figures / Shares
Total External Debt
USD 32,955.5 million (~TZS 82.4 trillion)
By Borrower
Central Govt: 85.4%, Private Sector: 14.6%, Public Corporations: Negligible
Top Use of Funds
Transport & Telecom: 25.4%, Social Welfare & Education: 21.3%, Energy & Mining: 16.4%
Top Currency
USD: 67.6%, EUR: 17.2%, JPY: 4.9%
Debt Servicing (May 2025 Context)
External debt servicing absorbs ~40% of government expenditures annually
Policy Implications and Insights
Central Government Borrowing:
The central government’s 85.4% share of external debt aligns with its role in funding infrastructure and social services, as seen in the TZS 937.3 billion development expenditure in May 2025. However, this concentrates repayment risks on public finances, requiring robust revenue mobilization (e.g., TZS 2,880.2 billion in May 2025).
The low interest arrears (USD 78.7 million) indicate effective debt management, supported by concessional loans from multilateral creditors (54.5% of debt).
Private Sector Constraints:
The private sector’s 14.6% share and higher arrears (USD 189.9 million) suggest challenges in accessing and servicing foreign credit, potentially due to USD appreciation or global tightening. This aligns with TICGL’s observation of declining private sector borrowing slowing economic diversification.
Sectoral Allocation:
The focus on Transport & Telecommunication (25.4%) and Social Welfare & Education (21.3%) supports Tanzania’s Vision 2050 goals of connectivity and human capital development. However, the low shares for agriculture (6.5%) and industry (4.0%) may hinder inclusive growth, given agriculture’s role in employment and GDP.
Currency Risks:
The 67.6% USD share exposes Tanzania to exchange rate risks, as noted by The Citizen, with Shilling depreciation increasing debt servicing costs. The African Development Bank emphasizes the need for domestic revenue mobilization to mitigate these risks.
Diversification into Euros (17.2%) and other currencies is positive but insufficient to offset USD dominance.
Debt Sustainability:
The IMF’s 2024 Debt Sustainability Analysis (DSA) indicates a moderate risk of external debt distress, with public debt at 45.5% of GDP in 2022/23, well below the 55% benchmark. The slight debt increase in June 2025 suggests controlled borrowing, but monitoring debt servicing capacity is critical, given annual costs absorb ~40% of expenditures.
Strong tax revenue performance (TZS 2,339.7 billion in May 2025, 4.1% above target) supports debt servicing but requires sustained efforts to reduce reliance on budget support loans (15.2%)
Tanzania’s current account deficit narrowed significantly to USD 2,117.6 million in the year ending June 2025, a 24.3% improvement from USD 2,797.7 million in June 2024. This USD 680.1 million reduction reflects robust growth in goods and services exports, especially from tourism and transport, which drove the net goods & services deficit down by 61.7% to USD 676.6 million. Service receipts rose to USD 7,110.4 million (+8.1%), led by travel (USD 3,934.5 million, +6.9%) and transport (USD 2,530.0 million, +9.8%), supported by a 10% increase in tourist arrivals. However, rising primary income outflows (USD 1,949.6 million, +17.9%) due to external debt servicing and a drop in remittances (USD 508.7 million, -18.1%) partially offset these gains. Meanwhile, foreign reserves stood at USD 5,307.7 million, covering 4.3 months of imports, above the national benchmark. Despite a surge in outbound travel spending (+51.4%), Tanzania’s external sector continues to show resilience, highlighting the importance of export diversification, tourism investment, and policy measures to manage foreign exchange outflows.
1. Current Account Performance
The current account balance reflects Tanzania’s trade in goods and services, primary income (e.g., interest and dividends), and secondary income (e.g., personal transfers and remittances) with the rest of the world. A deficit indicates that outflows exceed inflows, often financed by external borrowing or reserves.
Key Figures (Year Ending June 2025)
Item
2024 (USD Million)
2025p (USD Million)
% Change
Current Account Balance
-2,797.7
-2,117.6
+24.3%
Goods & Services (Net)
-1,764.7
-676.6
+61.7%
Primary Income (Net)
-1,653.9
-1,949.6
-17.9%
Secondary Income (Net)
+620.9
+508.7
-18.1%
Current Account Balance:
June 2025: Deficit of USD 2,117.6 million, a 24.3% improvement (USD 680.1 million reduction) from USD 2,797.7 million in June 2024.
Context: The narrowing deficit aligns with trends observed in earlier periods, such as a 31.1% reduction to USD 2,021.5 million in January 2025 and a 35% reduction to USD 2,025.8 million in November 2024. This improvement is driven by robust export growth (+17.7%) and better services performance, supported by global economic recovery and favorable commodity prices.
Drivers:
Goods & Services (Net): Improved by 61.7% to a deficit of USD 676.6 million from USD 1,764.7 million, reflecting strong export performance (e.g., gold, cashew nuts, tourism) and moderated import growth.
Primary Income (Net): Deficit widened by 17.9% to USD 1,949.6 million, driven by higher interest and dividend payments abroad, likely linked to external debt servicing (e.g., USD 32,955.5 million external debt, 67.6% USD-denominated) and foreign investments.
Secondary Income (Net): Surplus declined by 18.1% to USD 508.7 million, reflecting lower personal transfers (e.g., remittances), possibly due to global economic tightening or migration patterns.
Implications: The narrowing deficit signals improved external sector resilience, supported by tourism and commodity exports. However, persistent deficits and rising primary income outflows highlight the need for enhanced export diversification and remittance strategies. The African Development Bank projects a current account deficit of 4.2% of GDP in 2025, indicating sustained but manageable pressures.
Foreign Exchange Reserves:
June 2025: USD 5,307.7 million, covering 4.3 months of projected imports, above the national benchmark of 4 months.
Context: Reserves increased from USD 5,056.8 million in November 2024 and USD 5,323.6 million in January 2025, reflecting improved export inflows and IMF disbursements (e.g., USD 148.6 million under the Extended Credit Facility in December 2024).
Implications: Adequate reserves mitigate exchange rate volatility (Tanzanian Shilling depreciated 8% in 2023), but sustained export growth is critical to maintain cover above 4 months.
2. Exports – Service Receipts by Category
Service receipts represent earnings from Tanzania’s service exports, including tourism (travel), transport, and other services (e.g., financial, insurance, ICT). These are critical to narrowing the current account deficit.
Total Service Receipts (Year Ending June 2025)
Amount: USD 7,110.4 million
Change: +8.1% from USD 6,578.7 million in 2024 (USD 531.7 million increase).
Context: The growth aligns with earlier trends, such as a 14% increase to USD 6,985.9 million in November 2024 and a 7.3% increase to USD 6,940.8 million in April 2025, driven by tourism and transport earnings.
Category Breakdown
Service Category
2023 (USD Mn)
2024 (USD Mn)
2025p (USD Mn)
% Change (2024–2025)
Travel (Tourism)
2,944.9
3,679.7
3,934.5
+6.9%
Transport
2,015.0
2,304.3
2,530.0
+9.8%
Other Services
440.9
594.6
645.9
+8.6%
Travel (Tourism):
June 2025: USD 3,934.5 million (55.3% of total service receipts).
Change: +6.9% from USD 3,679.7 million in 2024 (USD 254.8 million increase).
Tourist Arrivals: Increased by 10% to 2,193,322 in 2025 from 1,994,242 in 2024, consistent with a 20% annual increase to 2,662,219 in 2024 and 2,106,870 in November 2024.
Context: Tourism receipts reflect Tanzania’s growing global appeal, with awards like Africa’s Leading Destination 2025 and investments in promotion (e.g., TZS 359.9 billion tourism budget for 2025/26). Key markets include Europe, Kenya, and the U.S., with new initiatives like Marriott’s Mapito Safari Camp in Serengeti.
Drivers: Increased arrivals are driven by post-COVID recovery, reduced tourism license fees (up to 80% cuts), and infrastructure improvements (e.g., Dodoma Transport Project),.
Implications: Tourism’s 55.3% share of service receipts underscores its role as a foreign exchange earner, supporting Vision 2050’s 19.5% GDP contribution target by 2025/26. Sustained marketing and conservation investments are critical.
Transport:
June 2025: USD 2,530.0 million (35.6% of total service receipts).
Change: +9.8% from USD 2,304.3 million in 2024 (USD 225.7 million increase).
Context: Growth aligns with earlier periods, such as USD 2,718.7 million in November 2024 (+15.8%) and USD 2,690.0 million in October 2024, driven by freight earnings from improved port efficiency and trade with landlocked neighbors (e.g., Zambia, Rwanda).
Drivers: Investments in transport infrastructure (e.g., Standard Gauge Railway, TAZARA Railway revitalization with USD 1.4 billion from China) and intra-African trade growth (24% to USD 5.18 billion in 2024) boost earnings.
Implications: Transport’s growth supports Tanzania’s role as a regional trade hub, but reliance on freight requires sustained infrastructure funding.
Other Services:
June 2025: USD 645.9 million (9.1% of total service receipts).
Change: +8.6% from USD 594.6 million in 2024 (USD 51.3 million increase).
Context: Includes financial, insurance, and ICT services. The growth is consistent with digital payment advancements (e.g., Tanzania Instant Payment System with 453.7 million transactions in 2024) and financial inclusion efforts (87% adult target by 2030).
Implications: Growth in “Other Services” reflects financial sector deepening, but its small share limits its impact on the current account.
Tourism Highlight
Arrivals: The 10% increase to 2,193,322 tourists reflects sustained recovery, with 2024 seeing 2,662,219 arrivals and November 2024 at 2,106,870. Key drivers include global promotion, reduced fees, and awards like Africa’s Leading Destination 2025.
Implications: Tourism’s resilience supports foreign exchange inflows, but seasonality (e.g., low season pressures in Q1 2025) and global competition require ongoing investment in infrastructure and marketing.
3. Imports – Service Payments
Service payments represent Tanzania’s expenditures on imported services, such as outbound travel, freight, and other services (e.g., financial, consulting).
Total Service Payments (Year Ending June 2025)
Amount: USD 2,894.0 million
Change: +22.7% from USD 2,359.5 million in 2024 (USD 534.5 million increase).
Context: The increase follows a 22.8% rise to USD 2,842.6 million in April 2025 and a 10.2% rise to USD 2,533.8 million in January 2025, driven by freight and outbound travel.
Category Breakdown
Service Category
2023 (USD Mn)
2024 (USD Mn)
2025p (USD Mn)
% Change (2024–2025)
Travel (Outbound)
388.0
573.2
867.9
+51.4%
Transport
1,280.4
1,453.0
1,453.2
≈ 0%
Other Services
691.1
691.1
573.2
-17.1%
Travel (Outbound):
June 2025: USD 867.9 million (30.0% of total service payments).
Change: +51.4% from USD 573.2 million in 2024 (USD 294.7 million increase).
Context: The surge aligns with increased consumer spending abroad, possibly driven by a growing middle class and business travel. Earlier data (e.g., April 2025) lacks specific outbound travel figures, but service payments rose due to freight.
Drivers: Increased outbound travel reflects economic growth (5.6% in 2024) and higher disposable incomes, but it strains foreign exchange reserves.
Implications: The sharp increase offsets export gains, requiring policies to promote domestic tourism and manage foreign exchange outflows.
Transport:
June 2025: USD 1,453.2 million (50.2% of total service payments).
Change: Near-flat (≈ 0%) from USD 1,453.0 million in 2024.
Context: Stable payments reflect consistent freight costs tied to trade volumes. Earlier data shows freight accounted for 53.3% of service payments in April 2025, driven by industrial transport equipment imports.
Drivers: Imports of capital goods (e.g., machinery, transport equipment) for infrastructure projects (e.g., SGR, TAZARA) sustain freight costs,.
Implications: Stable transport payments align with trade growth but highlight reliance on imported goods, necessitating export diversification.
Other Services:
June 2025: USD 573.2 million (19.8% of total service payments).
Change: -17.1% from USD 691.1 million in 2024 (USD 117.9 million decrease).
Context: The decline suggests cost efficiencies or reduced outsourcing in financial, insurance, or consulting services, aligning with digital payment growth and financial inclusion.
Implications: Reduced payments improve the services balance, but the small share limits its impact on the current account.
Summary Snapshot
Indicator
2024
2025p
Change
Current Account Deficit
-2.8 Bn USD
-2.1 Bn USD
↓ 24.3%
Service Receipts (Total)
6.58 Bn USD
7.11 Bn USD
↑ 8.1%
— Travel
3.68 Bn USD
3.93 Bn USD
↑ 6.9%
— Transport
2.30 Bn USD
2.53 Bn USD
↑ 9.8%
Service Payments (Total)
2.36 Bn USD
2.89 Bn USD
↑ 22.7%
— Outbound Travel
573 Mn USD
867 Mn USD
↑ 51.4%
Final Insights and Policy Implications
Current Account Improvement:
The 24.3% deficit reduction (USD 2,117.6 million) reflects strong export growth (+17.7%) and services performance, supported by tourism (2.2 million arrivals) and transport infrastructure. However, rising primary income outflows (USD 1,949.6 million) due to external debt servicing (40% of government expenditures) and declining remittances (USD 508.7 million) temper gains.
Policy: Diversify exports (e.g., horticulture, manufactured goods) and boost remittance inflows through diaspora engagement to further narrow the deficit.
Tourism’s Critical Role:
Tourism receipts (USD 3,934.5 million, +6.9%) are a cornerstone of service exports, driven by a 10% increase in arrivals and global recognition. Investments in infrastructure (e.g., Dodoma Transport Project, TAZARA) and promotion (TZS 359.9 billion budget) are paying off.
Policy: Sustain tourism growth through conservation, reduced fees, and targeting high-value markets (e.g., Europe, U.S.) while addressing seasonality risks.
Transport Sector Growth:
Transport receipts (USD 2,530.0 million, +9.8%) reflect Tanzania’s role as a regional trade hub, supported by port efficiency and intra-African trade growth (USD 5.18 billion in 2024). Projects like SGR and TAZARA enhance freight earnings.
Policy: Continue infrastructure investments and regional trade agreements (e.g., AfCFTA) to boost transport earnings, but monitor freight cost stability.
Outbound Travel Pressures:
The 51.4% surge in outbound travel payments (USD 867.9 million) reflects growing consumer spending abroad, straining foreign exchange reserves. Stable transport payments (USD 1,453.2 million) indicate consistent trade-related costs.
Policy: Promote domestic tourism and manage foreign exchange outflows through targeted incentives (e.g., tax breaks for local travel).
Economic Context:
GDP Growth: Tanzania’s 5.6% growth in 2024 and projected 6.0% in 2025 support export performance, driven by agriculture, tourism, and manufacturing.
Monetary Policy: The BoT’s 6% Central Bank Rate and 3%–5% inflation target ensure liquidity and exchange rate stability, supporting external sector performance.
Reserves: USD 5,307.7 million (4.3 months of import cover) provide a buffer against global shocks, but USD appreciation risks remain.
Risks and Opportunities:
Risks: Rising outbound travel costs, USD-denominated debt servicing (67.6% of external debt), and global commodity price volatility could widen the deficit. Climate shocks and geopolitical tensions also pose risks.
Opportunities: Investments in tourism, transport, and digital payments (e.g., TIPS), alongside reforms like MKUMBI II, can sustain export growth and financial inclusion
Tanzania’s external debt has surged from 2,469.7 USD Million in December 2011 to 34,056 USD Million in March 2025, representing a 13.8-fold increase over 14 years, or an average annual growth rate of approximately 20.8%. This dramatic rise reflects a combination of economic, infrastructural, and policy drivers that have fueled borrowing to support Tanzania’s development ambitions. Below, I outline the key factors driving this growth, supported by figures and data from available sources, including the Bank of Tanzania and other economic analyses.
1. Economic Drivers
Tanzania’s economic growth and structural transformation goals have necessitated significant external borrowing to bridge fiscal deficits and finance development projects. Key economic factors include:
Fiscal Deficits and Revenue Shortfalls: Tanzania’s fiscal deficit has consistently required external financing, as tax revenues (e.g., 13% of GDP in 2024) remain low compared to regional peers. The fiscal deficit was 3.8% of GDP in 2022/23, up from 3.4% in 2021/22, driven by increased public spending. To cover this, external debt rose to USD 34.1 billion (TZS 91.29 trillion at TZS 2,677/USD) by March 2025, with 78.3% held by the central government.
Foreign Exchange Needs: A 2.6% shilling depreciation in 2024/25 and an 8% depreciation in 2023 increased the cost of servicing USD-denominated debt (67.7% of external debt, or USD 23.1 billion). Declining export revenues from commodities like coffee (-2%) and sugar (-1.5%) strained foreign exchange reserves, necessitating borrowing to maintain import cover (e.g., USD 5.7 billion, 3.8 months of imports in 2025).
Economic Growth Ambitions: Tanzania’s GDP grew from USD 33.2 billion in 2011 to USD 75.5 billion in 2022, with projections of 5.6% growth in 2024 and 6% in 2025. This growth, driven by agriculture, manufacturing, and tourism, required external financing to sustain investments in productive sectors. For example, foreign direct investment (FDI) rose to USD 922 million in 2021, supporting projects like the Kabanga Nickel Project, which increased borrowing needs.
2. Infrastructural Drivers
Tanzania’s ambitious infrastructure agenda has been a primary driver of external debt growth, with significant borrowing to fund transformative projects in transport, energy, and urban development. Key projects include:
Standard Gauge Railway (SGR): The SGR, a flagship project to connect Dar es Salaam to inland regions and neighboring countries, has been a major contributor to debt growth. The project’s cost, estimated at USD 7.6 billion for multiple phases, has been largely financed through external loans, particularly from China and multilateral institutions.
Energy Infrastructure: Investments in energy, such as the 532 km gas pipeline from Mnazi Bay to Dar es Salaam (completed in 2015, costing USD 1.2 billion) and plans to increase electricity capacity to 10,000 MW by 2025, have driven borrowing. In 2013, 49.7% of electricity came from natural gas, and projects like the Ntorya gas field (projected to produce 40 million cubic feet/day by 2025) required external financing.
Port and Transport Upgrades: The modernization of Dar es Salaam Port, including a USD 250 million investment by DP World (UAE) in 2023, and the East African Crude Oil Pipeline (EACOP, USD 5 billion), have increased external debt. These projects aim to position Tanzania as a regional trade hub.
World Bank Financing: As of March 2025, 48% of the World Bank’s USD 10 billion portfolio in Tanzania supports infrastructure, including roads, railways, and power projects, significantly contributing to the external debt stock.
3. Policy Drivers
Government policies aimed at economic diversification, poverty reduction, and structural reforms have shaped borrowing patterns, with a focus on concessional and non-concessional loans. Key policy drivers include:
Concessional Borrowing from Multilateral Institutions: Multilateral creditors account for 53.9% of external debt (USD 18.3 billion) as of January 2025, with the World Bank, IMF, and African Development Bank providing concessional loans. In 2021, the IMF provided USD 567.25 million in emergency assistance for COVID-19 recovery, and the 2022–2025 Extended Credit Facility (ECF) program unlocked USD 150 million in 2025 to support fiscal sustainability.
Non-Concessional Borrowing: External non-concessional borrowing has risen to finance infrastructure, accounting for 36.3% of external debt (USD 12.4 billion) in January 2025. Commercial creditors, including Chinese loans for projects like the SGR, have driven debt growth, increasing exposure to higher interest rates.
Vision 2025 and Development Goals: Tanzania’s Vision 2025 aims for a GDP growth rate of 8% annually, requiring investments in infrastructure, education, and health. The FY 2024/25 budget of TZS 49.35 trillion (USD 18.4 billion) included TZS 29.41 trillion (59.6%) from tax revenue, with the deficit financed by external borrowing. The planned 13.4% spending increase to TZS 57.04 trillion in FY 2025/26 further drives borrowing.
Business Environment Reforms: Policies to improve the investment climate, such as tax code revisions and the creation of the Tanzania Investment Centre, have attracted FDI but also increased borrowing for co-financed projects. For example, Chinese investments in the Mchuchuma coal and Liganga iron ore projects (USD 3 billion) in 2011 required complementary government borrowing.
Quantitative Insights
Debt Growth Trajectory:
2011: USD 2,469.7 million (Bank of Tanzania).
2019: USD 22.4 billion (40% of GDP, 6% YoY increase from 2018).
2023: USD 32,090 million (disbursed, January 2025).
March 2025: USD 34,056 million, a 6.1% increase from January 2025 (USD 32,090 million).
Debt-to-GDP Ratio: Rose from 32.68% in 2013 to 46.87% in 2023 (total public debt), with external debt at ~32-35% of GDP in 2025, assuming a GDP of ~USD 100 billion.
Debt Composition (January 2025):
Multilateral: 53.9% (USD 18.3 billion).
Commercial: 36.3% (USD 12.4 billion).
Bilateral: 4.2% (USD 1.4 billion).
Export Credit: 5.6% (USD 1.9 billion).
Debt Servicing: Absorbs ~40% of government expenditures, with external debt service estimated at USD 1-2 billion annually and domestic at TZS 5.31 trillion in 2025.
Challenges and Risks
Exchange Rate Risks: With 67.7% of external debt in USD, the 2.6% shilling depreciation in 2024/25 increases servicing costs by approximately TZS 2.38 trillion for the USD-denominated portion.
Global Economic Pressures: The IMF’s global growth forecast of 2.8% for 2025 and rising interest rates elevate borrowing costs, particularly for non-concessional loans.
Fiscal Space Constraints: High debt servicing limits investments in social sectors, with 3% of GDP spent on debt servicing in 2024.
COVID-19 Impact: Emergency borrowing, including USD 567.25 million from the IMF in 2021, contributed to debt spikes to address health and economic costs.
Conclusion
The 13.8-fold increase in Tanzania’s external debt from 2,469.7 USD Million in 2011 to 34,056 USD Million in March 2025 is driven by economic needs (fiscal deficits, foreign exchange shortages), major infrastructure projects (SGR, energy, ports), and policy choices favoring concessional and non-concessional borrowing to achieve Vision 2025 goals. While debt remains sustainable (moderate risk per IMF DSA), with a debt-to-GDP ratio of ~32-35%, challenges like shilling depreciation and high debt servicing costs underscore the need for prudent fiscal management and revenue mobilization.
This table consolidates the key figures driving Tanzania’s external debt growth, highlighting economic factors (fiscal deficits, GDP growth), infrastructure projects (SGR, energy, ports), and policy decisions (concessional and non-concessional borrowing). The 13.8-fold increase reflects Tanzania’s development ambitions, balanced by a sustainable debt-to-GDP ratio of ~32-35% in 2025.
Metric
Value (USD Million, unless specified)
Reference Year
Notes
External Debt (2011)
2,469.7
Dec 2011
Record low, per Bank of Tanzania
External Debt (2019)
22,400
Dec 2019
40% of GDP, 6% YoY increase
External Debt (2023)
32,090
Jan 2025
Disbursed debt, reflecting steady growth
External Debt (Mar 2025)
34,056
Mar 2025
13.8-fold increase from 2011, 6.1% increase from Jan 2025
Average Annual Debt Growth Rate
~20.8%
2011–2025
Calculated from 2,469.7 to 34,056 USD Million
GDP (2011)
33,200
2011
Base for early debt-to-GDP ratio
GDP (2023)
75,500
2023
IMF/World Bank estimate
Projected GDP (2025)
~100,000
2025
Based on 5.6% growth (2024), 6% (2025)
Debt-to-GDP Ratio (2013)
32.68%
2013
Total public debt, external ~70%
Debt-to-GDP Ratio (2023)
46.87%
2023
Total public debt, external ~32-35% in 2025
Fiscal Deficit (2022/23)
3.8% of GDP
2022/23
Financed partly by external borrowing
Shilling Depreciation (2023)
8%
2023
Increased USD debt servicing costs
Shilling Depreciation (2024/25)
2.6%
2024/25
Added ~TZS 2.38 trillion to servicing costs
Standard Gauge Railway (SGR)
7,600
2015–2025
Major infrastructure project, China-funded
Gas Pipeline (Mnazi Bay)
1,200
2015
Energy infrastructure, completed
Dar es Salaam Port Upgrade
250
2023
DP World investment, part of trade hub strategy
EACOP (Partial Contribution)
5,000
Ongoing
Regional pipeline, co-financed
Multilateral Debt Share
18,300 (53.9%)
Jan 2025
World Bank, IMF, AfDB dominate
Commercial Debt Share
12,400 ( Ascot in 2025 (36.3%)
Jan 2025
Non-concessional, higher interest rates
IMF Emergency Assistance
567.25
2021
COVID-19 response, added to debt stock
Debt Service (% of Expenditure)
~40%
2024/25
Limits fiscal space for social spending
Foreign Exchange Reserves
5,700
2025
3.8 months of import cover
FDI (2021)
922
2021
Supports projects like Kabanga Nickel
Notes:
Debt Growth: From 2,469.7 USD Million (2011) to 34,056 USD Million (Mar 2025), driven by fiscal deficits, infrastructure, and policy goals.
Infrastructure Costs: SGR (USD 7.6 billion), gas pipeline (USD 1.2 billion), and port upgrades (USD 250 million) are major contributors.
Debt Composition: Multilateral (53.9%, USD 18.3 billion), commercial (36.3%, USD 12.4 billion), bilateral (4.2%, USD 1.4 billion), export credit (5.6%, USD 1.9 billion) as of Jan 2025.
Economic Context: GDP growth from USD 33.2 billion (2011) to ~USD 100 billion (2025) supports debt sustainability, but shilling depreciation (8% in 2023, 2.6% in 2024/25) increases servicing costs.
Policy Impact: Vision 2025 and FY 2024/25 budget (TZS 49.35 trillion, USD 18.4 billion) drive borrowing, with 59.6% funded by taxes and the rest by loans.