As of November 2025, Tanzania's government domestic debt stands at TZS 38.36 trillion, supported by a stable and diversified creditor base that ensures predictable budget financing and fiscal resilience. The debt structure is dominated by institutional investors, with commercial banks (28.6%) and pension funds (27.4%) collectively holding 56.0% of total domestic debt, providing market depth and long-term stability.
Key Structural Advantage
All domestic debt instruments are denominated in Tanzania shillings, completely eliminating foreign exchange risk and providing a crucial buffer against the currency vulnerabilities present in external debt (which is 66.8% USD-denominated). This structure, combined with growing retail investor participation (14.6%), demonstrates a mature and sustainable domestic financing framework.
Strategic Importance:
Tanzania's domestic debt market serves as a cornerstone of fiscal stability, reducing dependence on external financing while mobilizing domestic savings. The institutional dominance and zero FX risk position make it a strategic asset for sustainable budget financing and macroeconomic stability.
1. Creditor Composition Analysis
The creditor structure reveals a well-balanced distribution across institutional investors, the central bank, and retail participants, creating a resilient and diversified funding base.
Creditor Category
Amount (TZS Billion)
Percentage Share
Commercial Banks
10,979.9
28.6%
Pension Funds
10,503.3
27.4%
Retail Investors
5,609.8
14.6%
Bank of Tanzania (BoT)
5,671.5
14.8%
Other Financial Institutions
5,596.8
14.6%
Total Domestic Debt
38,361.3
100%
Market Structure:
The combined 56% share held by commercial banks and pension funds represents a stable, long-term investor base that aligns with Tanzania's increasing reliance on longer-tenor Treasury bonds. This institutional dominance significantly reduces rollover and refinancing risks compared to short-term or volatile holders.
2. Creditor Role & Market Implications
Each creditor category plays a distinct role in maintaining the stability and functionality of Tanzania's domestic debt market.
Creditor Group
Role in Market
Fiscal & Financial Implication
Commercial Banks
Largest single holder providing liquidity
Ensures market depth but requires monitoring for potential crowding-out of private credit
Pension Funds
Long-term institutional investors
Supports longer-term debt sustainability through stable, patient capital
Bank of Tanzania
Monetary authority operations
Reflects liquidity management rather than fiscal monetization
Other Financial Institutions
Insurance & investment entities
Enhances overall market depth and diversification
Retail Investors
Individuals & small investors
Promotes financial inclusion and domestic savings mobilization
3. Key Structural Indicators
Critical metrics that define the health and sustainability of Tanzania's domestic debt market.
✓ Positive Indicators
Institutional Holdings56.0%
Retail Participation14.6%
FX RiskZero
Creditor DiversificationAdequate
⚠ Monitoring Areas
Central Bank Exposure14.8%
Bank Dependence28.6%
Crowding-Out RiskModerate
AssessmentContained
Balanced Assessment:
While commercial banks hold a significant 28.6% share, the strong private sector credit growth of 18.1% (as of November 2025) suggests that crowding-out effects are currently contained. The moderate BoT holding of 14.8% indicates limited inflationary monetary financing risk.
4. Sustainability Assessment Framework
Sustainability Dimension
Assessment
Policy Implication
Creditor Diversification
Adequate
Reduces refinancing risk through multiple funding sources
Dependence on Banks
Moderate
Requires ongoing monitoring of crowding-out effects on private credit
Pension Fund Role
Strong
Supports long-term stability through patient institutional capital
Foreign Exchange Risk
None
Shields domestic debt from exchange-rate shocks and currency volatility
Retail Participation
Growing
Broadens savings mobilization and enhances financial inclusion
Market Depth
Substantial
Supports predictable budget financing and market stability
5. Strategic Strengths & Considerations
Core Strengths
Stable investor base with 56% institutional holdings
Zero foreign exchange risk through TZS denomination
Strong pension fund involvement ensuring long-term stability
Limited monetary financing risk from central bank
Monitoring Priorities
Commercial bank holdings at 28.6% requiring crowding-out vigilance
Balance between government borrowing and private sector credit
Maintaining competitive yields to sustain investor demand
Continued development of retail investor participation channels
Refinancing capacity during periods of fiscal pressure
Coordination between fiscal policy and monetary operations
6. Integration with Broader Fiscal Framework
Complementing External Debt Profile
Tanzania's domestic debt structure provides a crucial counterbalance to external debt dynamics. While external debt (USD 36.1 billion) carries significant currency risk with 66.8% USD denomination, the domestic debt market offers a risk-free alternative in currency terms. This dual structure enables:
Risk Diversification: Balancing FX-exposed external debt with TZS-denominated domestic obligations
Fiscal Flexibility: Multiple funding sources reducing dependence on any single market
Market Development: Deepening domestic capital markets and financial intermediation
Savings Mobilization: Channeling domestic savings into productive government investment
Alignment with November 2025 Macro Trends
The domestic debt structure aligns with broader positive macroeconomic trends observed in November 2025: high demand and oversubscription in government securities auctions, reliance on domestic financing for 82.3% of development spending, ample banking system liquidity, falling bond yields, and strong private sector credit growth of 18.1%. These factors collectively reinforce fiscal sustainability and reduce external financing vulnerabilities.
Contribution to Overall Debt Sustainability
With total national debt at approximately TZS 126.7 trillion (combining external and domestic), the domestic component represents roughly 30% of total obligations. This balanced portfolio, combined with the structural strengths identified above, supports Tanzania's overall debt sustainability framework and reduces vulnerability to external shocks.
7. Policy Recommendations & Outlook
Continue Current Practices
Maintain institutional investor engagement through competitive pricing
Expand retail investor channels and financial literacy programs
Preserve TZS denomination to eliminate FX risk
Support longer-tenor bond issuance matching investor preferences
Ensure transparent and predictable debt management operations
Areas for Enhancement
Monitor and manage potential crowding-out of private credit
Further diversify creditor base beyond current concentrations
Develop secondary market liquidity for government securities
Strengthen coordination between fiscal and monetary authorities
Enhance debt management capacity and risk monitoring systems
Tanzania's government domestic debt structure as of November 2025 represents a mature, well-diversified, and sustainable financing framework. With total domestic debt of TZS 38.36 trillion, the market is characterized by strong institutional participation (56% from banks and pension funds), growing retail investor engagement (14.6%), and complete insulation from foreign exchange risk through TZS denomination.
The moderate 14.8% Bank of Tanzania holding reflects prudent liquidity management rather than inflationary monetary financing, while the 28.6% commercial bank share, though substantial, has not prevented robust private sector credit growth of 18.1%. This balance demonstrates effective fiscal management that supports both government financing needs and private sector development.
Looking forward, maintaining this stable creditor structure, expanding retail participation, and ensuring continued institutional confidence through transparent debt management will be essential. The domestic debt market serves as a strategic complement to external financing, providing a currency risk-free buffer that strengthens Tanzania's overall fiscal resilience and macroeconomic stability. When combined with disciplined fiscal policy and strong export performance, Tanzania's domestic debt framework positions the country well for sustainable economic development and financial stability.
Tanzania's Public Finance Framework: Sustainability & Long-Term Development | TICGL
Tanzania's Public Finance Framework
Assessing Long-Term Sustainability and Development Potential for 2026 and Beyond
Introduction
The sustainability of public finances is increasingly critical to Tanzania's long-term development agenda as the country seeks to finance economic transformation, social development, and climate resilience while maintaining macroeconomic stability. Over the past decade, Tanzania has recorded relatively strong economic performance, with average GDP growth ranging between 6-7 percent prior to the COVID-19 shock and projected to stabilize at around 6.1-6.3 percent by 2026.
This growth has supported public revenue mobilization and allowed the government to scale up public investment, particularly in transport, energy, water, and social infrastructure. However, sustaining this momentum places growing pressure on public finances, especially in the context of rising expenditure needs and exposure to external shocks.
Key Financial Indicators (2025-2026)
Public Debt-to-GDP Ratio
49.6%
2025 (Projected decline to 48.3% in 2026)
Fiscal Deficit
-2.8%
Of GDP, stabilizing through 2026
GDP Growth Projection
6.1-6.3%
For 2026, driven by infrastructure and tourism
Government Revenue
16.8%
Of GDP in 2025/26 fiscal year
Debt Sustainability Analysis
Current Debt Position
Public debt levels in Tanzania remain manageable but have followed an upward trajectory. The public debt-to-GDP ratio increased from about 27.6 percent in 2010 to approximately 49.6 percent in 2025, reflecting expanded infrastructure investment, pandemic-related spending, and global financing conditions.
Projections indicate a modest decline to around 48.3 percent in 2026, assuming continued fiscal discipline and stable growth. While this level remains below commonly observed risk thresholds for developing economies, it narrows fiscal space and increases sensitivity to interest rate movements, exchange rate fluctuations, and revenue shortfalls.
Historical Debt Trends (2010-2026)
Key Observation: Tanzania's public debt remains sustainable, with IMF assessments as of mid-2025 indicating low distress risk, supported by concessional loans and 6-7% annual GDP growth.
Fiscal Balance Performance
Fiscal balances highlight the sustainability challenge. Tanzania has maintained fiscal deficits averaging around -2.8 percent of GDP over recent years, widening to nearly -3.9 percent in 2022 before gradually narrowing toward -2.8 percent by 2026. Although these deficits are relatively moderate, they occur alongside rising spending pressures driven by rapid population growth of over 3 percent annually, expanding demand for education, health, and urban services, and increasing costs associated with climate adaptation and infrastructure maintenance.
Fiscal Balance Trends (2010-2026)
Note: Data sourced from IMF, World Bank, and other reports; positive change indicates narrower deficit.
Analysis: Fiscal deficits have averaged -2.8% of GDP through 2023, below Sub-Saharan averages, with post-2020 widening due to pandemic support narrowing via reforms. Projections for 2026 indicate stabilization around -2.8% to -3.0%, reflecting contained deficits amid infrastructure spending.
Revenue Mobilization Progress
On the revenue side, domestic revenue mobilization has improved, with government revenues reaching approximately 16.8 percent of GDP in the 2025/26 fiscal year. Despite this progress, revenue growth continues to lag behind expenditure demands, particularly in capital-intensive sectors and social protection.
This imbalance underscores that fiscal sustainability in Tanzania cannot rely solely on revenue-enhancing measures or ad hoc spending controls, but must be anchored in stronger medium-term fiscal planning and continuous reassessment of public spending priorities.
2026 Economic Outlook
Growth Drivers and Projections
GDP Growth: 6.1-6.3% (current estimates: 6.0-6.4%)
Inflation: Approximately 3.3% (recent estimates: 3-4%)
Foreign Reserves: Around $6 billion
Tourism Rebound: Expected +20% growth
Key Sectors: Infrastructure, exports, tourism, and services
Risk Assessment: Post-2025 election turbulence could reduce growth by 5-10% if unrest occurs, impacting tourism and stability. The 2025 general elections, marked by President Samia Suluhu Hassan's landslide re-election with over 97% of the vote, have introduced uncertainties including opposition exclusions, allegations of irregularities, and post-election protests with reported violence. While the ruling CCM's strong mandate may facilitate policy continuity, political tensions could deter investment and disrupt key economic drivers.
Expenditure Pressures and Challenges
Without improvements in expenditure efficiency and prioritization, several pressures risk entrenching structural deficits over the medium term:
Rapid Population Growth: Over 3% annually, driving demand for education, health, and urban services
Climate Adaptation Costs: Up to $233 million annually in infrastructure losses
Infrastructure Maintenance: Increasing costs for transport, energy, and water systems
Social Protection: Expanding needs for vulnerable populations
Debt Servicing: Sensitivity to interest rate movements and exchange rate fluctuations
Strategic Recommendations for 2026 and Beyond
TICGL emphasizes a strategic shift toward adaptive fiscal management to balance debt sustainability with development needs, especially as 2026 approaches (post-2025 elections). Key recommendations include:
Strengthen Budget Credibility and Medium-Term Fiscal Planning
Move beyond episodic consolidation to continuous reassessment, using frameworks like FYDP III (Five-Year Development Plan III) to manage trade-offs effectively.
Improve Efficiency and Prioritization of Public Expenditure
Conduct comprehensive spending reviews, redirect resources to high-impact sectors (e.g., climate adaptation, education/health for the young population, infrastructure maintenance), and focus on "strategic reallocations" rather than broad cuts.
Enhance Domestic Revenue Mobilization
Build on progress (to 16.8% of GDP in 2025/26) with "growth-friendly" measures to close the revenue-expenditure gap without stifling economic activity.
Reinforce Institutions for Resilience
Tackle spending rigidities, improve transparency and accountability mechanisms, and evolve toward "state redesign" to better handle shocks such as commodity price fluctuations and climate-related costs.
Ensure Post-Election Stability
Prudent execution of reforms is critical; any unrest could derail projections, widening deficits and slowing growth. Swift restoration of political stability is essential for maintaining investor confidence.
Tanzania's public finance framework has demonstrated remarkable resilience in recent years, supporting robust economic growth averaging around 6% in 2024-2025 while maintaining macroeconomic stability amid global and domestic challenges. As of late 2025, public debt stands at approximately 46-48% of GDP (down slightly from peaks near 50% projected earlier), with IMF assessments confirming low risk of debt distress due to concessional financing and prudent management.
These achievements align closely with pre-2025 projections: debt stabilizing near 48%, deficits contained at -2.8 to -3.0%, and GDP growth projected at 6.1-6.3% for 2026. Revenue progress to approximately 16.8% of GDP has helped close gaps, enabling continued investment in infrastructure, education, health, and climate adaptation without breaching sustainability thresholds.
Looking Forward
As Tanzania moves toward 2026 and beyond, sustaining public finances will require a strategic shift toward more adaptive fiscal management—one that balances debt sustainability with development imperatives. Strengthening budget credibility, improving the efficiency of public expenditure, and ensuring that limited fiscal resources are consistently redirected toward high-impact sectors will be essential.
Achieving this balance will not only safeguard macroeconomic stability but also ensure that public finances remain a reliable instrument for supporting inclusive growth, economic resilience, and long-term national development. With projected GDP growth of 6.0-6.4%, low inflation (approximately 3-4%), and adequate reserves, public finances remain a solid foundation for inclusive development—if post-election stability is swiftly restored and reforms deepened.
Ultimately, evolving toward "state redesign" with greater institutional resilience will ensure Tanzania's framework not only withstands shocks but actively drives long-term transformation, safeguarding macroeconomic stability and equitable growth for its rapidly expanding population.
Conclusion
Tanzania's public finance framework stands at a critical juncture. The country has successfully maintained macroeconomic stability and achieved consistent growth while investing heavily in development infrastructure. However, the path forward requires careful navigation of competing pressures: rising expenditure needs driven by demographics and climate change, the imperative to maintain debt sustainability, and the need to expand fiscal space for development investments.
The outlook is optimistic if reforms are sustained and deepened. Achieving debt stabilization at approximately 48.3%, containing deficits at -2.8%, and supporting resilient 6+% growth in 2026 will make public finances a reliable driver for long-term development. However, vulnerabilities remain without deeper institutional changes and continued commitment to adaptive fiscal management.
The key question remains: Is Tanzania's public finance framework strong enough for long-term development? The answer is cautiously affirmative—the framework is resilient and has demonstrated capacity to support sustained growth, but its long-term strength will depend on the government's ability to implement recommended reforms, navigate post-election political dynamics, and evolve institutional capacity to meet emerging challenges.
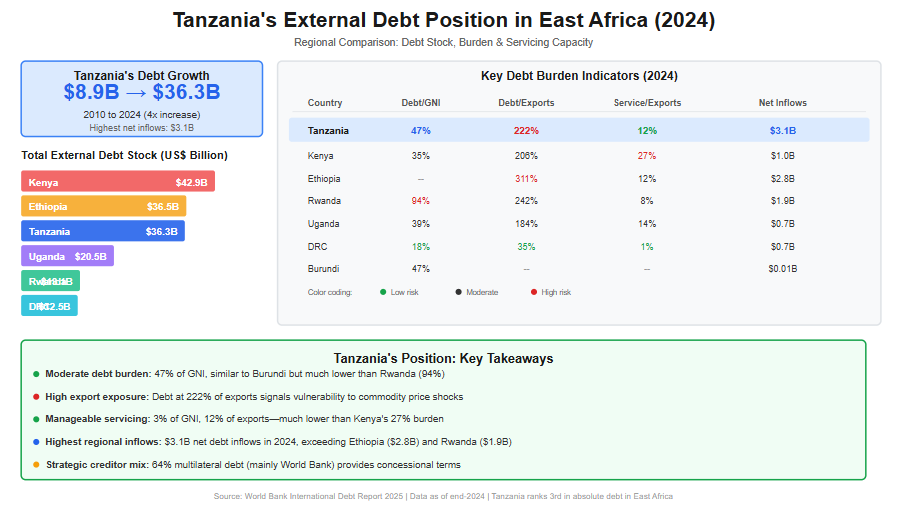
Over the past decade, Tanzania’s external debt has expanded rapidly, reflecting both the country’s ambitious development agenda and growing reliance on external financing to bridge fiscal and infrastructure gaps. According to the International Debt Report 2025, Tanzania’s total external debt stock increased more than fourfold—from US$8.9 billion in 2010 to US$36.3 billion by end-2024. This sharp rise underscores the scale of public investment undertaken during this period, particularly in transport infrastructure, energy, and social sectors, but it also raises important questions regarding debt sustainability and regional competitiveness.
In East Africa, Tanzania currently ranks among the top three most indebted countries in absolute terms, alongside Kenya and Ethiopia. By end-2024, Kenya recorded the highest external debt stock at US$42.9 billion, followed by Ethiopia (US$36.5 billion) and Tanzania (US$36.3 billion). While Tanzania’s debt level is lower than Kenya’s, it is significantly higher than that of Uganda (US$20.5 billion), Rwanda (US$13.1 billion), and the Democratic Republic of Congo (US$12.5 billion). This positioning places Tanzania as a major regional borrower, reflecting the relative size of its economy and its sustained access to concessional and semi-concessional financing.
From a debt burden perspective, Tanzania’s external debt stood at 47% of Gross National Income (GNI) in 2024—moderate by regional standards. This ratio is similar to Burundi (47%) but substantially lower than Rwanda’s 94%, indicating comparatively lower vulnerability than some peers. However, when measured against export earnings, Tanzania’s external debt reached 222% of exports, signaling a high exposure to external shocks, especially fluctuations in commodity prices and global demand. This ratio is higher than Uganda’s (184%) and Kenya’s (206%), though still below Ethiopia’s elevated level of 311%.
Debt servicing pressures in Tanzania remain relatively manageable compared to other East African economies. In 2024, debt service payments accounted for 3% of GNI and 12% of export earnings, significantly lower than Kenya, where debt service absorbed 27% of exports, and comparable to Rwanda’s levels. This reflects Tanzania’s continued reliance on multilateral creditors, which account for approximately 64% of public and publicly guaranteed (PPG) external debt, with the World Bank alone representing nearly half of total PPG debt. Such creditor composition has helped moderate repayment pressures through longer maturities and concessional terms.
Nevertheless, Tanzania recorded the highest net external debt inflows in East Africa in 2024, at US$3.1 billion, exceeding Ethiopia (US$2.8 billion) and Rwanda (US$1.9 billion). This trend highlights ongoing financing needs and signals that debt accumulation is likely to persist in the medium term. As regional peers increasingly face tightening global financial conditions, Tanzania’s future debt trajectory will depend heavily on export performance, fiscal discipline, and the productivity of debt-financed investments.
Overall, Tanzania’s external debt position reflects a delicate balance: stronger than highly indebted peers such as Rwanda and Kenya in terms of servicing capacity, yet more exposed than Uganda and DRC when viewed through export and inflow dynamics. This evolving landscape makes continuous debt monitoring, regional benchmarking, and strategic borrowing essential for safeguarding macroeconomic stability and sustaining long-term growth. Read More of This Topic: Who Is Financing Tanzania’s Public Debt in 2024—and What Does It Mean for Sustainability?
External Debt Data for Tanzania (2010–2024)
The following table summarizes Tanzania's external debt data across key years, as extracted from the International Debt Report 2025. All figures are in US$ million unless otherwise noted.
Indicator
2010
2020
2021
2022
2023
2024
Total external debt stocks
8,940
25,772
28,818
30,444
34,585
36,343
Long-term external debt stocks
6,904
22,055
23,589
24,533
28,271
30,898
Public and publicly guaranteed debt from:
Official creditors
5,546
15,355
15,502
16,308
18,296
20,005
Multilateral
4,391
11,243
11,526
12,615
14,655
16,435
of which: World Bank
3,248
8,148
8,290
9,228
10,989
12,097
Bilateral
1,155
4,112
3,975
3,693
3,641
3,571
Private creditors
135
2,209
3,436
3,244
4,090
4,272
Bondholders
..
..
..
..
..
..
Commercial banks and others
135
2,209
3,436
3,244
4,090
4,272
Private nonguaranteed debt from:
1,224
4,491
4,651
4,981
5,886
6,621
Bondholders
..
..
..
..
..
..
Commercial banks and others
1,224
4,491
4,651
4,981
5,886
6,621
Use of IMF credit and SDR allocations
647
274
1,357
1,444
1,760
2,062
IMF credit
354
0
557
683
993
1,316
SDR allocations
293
274
800
761
767
746
Short-term external debt stocks
1,389
3,442
3,872
4,467
4,554
3,383
Disbursements, long-term
1,361
1,459
3,049
3,104
5,200
4,112
Public and publicly guaranteed sector
1,145
1,181
2,865
2,421
4,030
3,500
Private sector not guaranteed
216
279
184
683
1,171
612
Principal repayments, long-term
134
984
1,142
1,533
1,547
1,204
Public and publicly guaranteed sector
55
968
1,118
1,179
1,282
1,126
Private sector not guaranteed
79
15
25
353
266
78
Interest payments, long-term
51
365
319
429
603
725
Public and publicly guaranteed sector
34
363
315
377
547
691
Private sector not guaranteed
17
2
4
52
56
34
Public and Publicly Guaranteed (PPG) Debt for Tanzania in 2024, by Creditor and Creditor Type (Including IMF Credit)
The table below focuses on PPG debt in 2024, broken down by creditor type and key creditors where specified. Note that IMF credit is reported separately in the raw data but is included here as part of overall PPG (under multilateral creditors) per the report's figure, which explicitly incorporates it. The total PPG debt (including IMF credit) is approximately $25,593 million (long-term PPG $24,277 + IMF credit $1,316). Specific creditor breakdowns (e.g., China, AfDB) are derived from the report's Figure 1, which provides a visual pie chart; percentages are approximate and may reflect rounded values.
Creditor Type
Sub-Creditor/Creditor
Amount (US$ million)
% of Total PPG (incl. IMF)
Multilateral (excl. IMF)
Total Multilateral (excl. IMF)
16,435
~64%
World Bank
12,097
~47%
AfDB (African Development Bank)
~3,583 (est. based on 14%)
~14%
Other Multilateral
~4,351 (est. based on 17%)
~17%
IMF Credit
IMF
1,316
~5% (reported as 6% in figure)
Bilateral
Total Bilateral
3,571
~14%
China
~2,559 (est. based on ~10%; figure label may have OCR variance)
~10%
India
~512 (est. based on 2%)
~2%
Korea, Rep.
~512 (est. based on 2%)
~2%
France
~256 (est. based on 1%)
~1%
Other Bilateral
~1,538 (est. based on 6%)
~6%
Private Creditors
Total Private
4,272
~17%
Bondholders
..
0%
Commercial Banks and Others
4,272
~17% (incl. other commercial ~4%)
Total PPG (incl. IMF)
25,593
**100%
Notes on Breakdown:
Estimates for sub-creditors (e.g., AfDB, China) are calculated using the figure's percentages applied to the total PPG (incl. IMF). There may be slight discrepancies due to rounding in the report's visuals.
The report's pie chart highlights major creditors: World Bank (largest share), China (significant bilateral), AfDB, IMF, and smaller shares for India, Korea, France, and others.
External Debt Comparison for East African Countries (Data from International Debt Report 2025, End-2024)
The International Debt Report 2025 provides detailed external debt statistics for low- and middle-income countries, including East African nations. Below is a comparison focusing on Tanzania and other East African countries (Burundi, Democratic Republic of the Congo (DRC), Ethiopia, Kenya, Rwanda, Somalia, and Uganda). The data is drawn from the report's country tables and snapshots. Note that some values for Ethiopia and Burundi are missing in the report (indicated as ".."), and for Somalia, I supplemented with data from the World Bank's online IDS portal as the PDF extraction for that country was incomplete. Population for Uganda is estimated based on report context (not explicitly listed in the extracted data). All figures are in US$ million unless otherwise noted.
Country
Total External Debt Stock (US$ million)
External Debt % of GNI
External Debt % of Exports
Debt Service % of GNI
Debt Service % of Exports
Net Debt Inflows (US$ million)
GNI (US$ million)
Population (million)
Tanzania
36,343
47
222
3
12
3,056
76,808
69
Burundi
1,024
47
..
2
..
10
2,173
14
DRC
12,485
18
35
1
1
651
68,396
109
Ethiopia
36,548
..
311
..
12
2,817
..
132
Kenya
42,886
35
206
5
27
1,006
122,557
56
Rwanda
13,050
94
242
3
8
1,900
13,901
14
Somalia
2,837
..
..
..
..
..
..
18
Uganda
20,534
39
184
2
14
676
52,361
50
Key Insights and Comparison with Tanzania
Total External Debt: Kenya has the highest debt stock among the group at $42,886 million, followed by Ethiopia and Tanzania (both around $36,000 million). Burundi and Somalia have the lowest, reflecting smaller economies and recent debt relief efforts (e.g., Somalia's debt reduction to under 6% of GDP in 2023).
Debt Burden Relative to Economy ( % GNI): Rwanda has the highest ratio at 94%, indicating high vulnerability. Tanzania's 47% is moderate, similar to Burundi, while DRC is low at 18%.
Debt Burden Relative to Exports ( % Exports): Ethiopia tops the list at 311%, meaning its debt is over three times its export earnings, posing risks. Tanzania's 222% is high but lower than Rwanda (242%) and Kenya (206%).
Debt Service Burden: Kenya faces the heaviest load, with debt service taking 27% of exports and 5% of GNI. Tanzania's is more manageable at 12% of exports and 3% of GNI, similar to Rwanda. DRC has the lowest at 1% for both.
Net Debt Inflows: Tanzania saw the highest net debt inflows at $3,056 million, indicating continued borrowing. Ethiopia and Rwanda also had significant inflows ($2,817 and $1,900 million, respectively), while Burundi had minimal ($10 million).
Overall Context: Compared to Tanzania, countries like Kenya and Rwanda have higher relative debt burdens, potentially limiting fiscal space for development. Smaller economies like Burundi and Somalia have lower absolute debt but remain fragile due to limited export bases. The regional average for Sub-Saharan Africa is total debt of $901 billion, 49% of GNI, and 164% of exports, showing East Africa aligns with or exceeds regional norms in burden indicators.
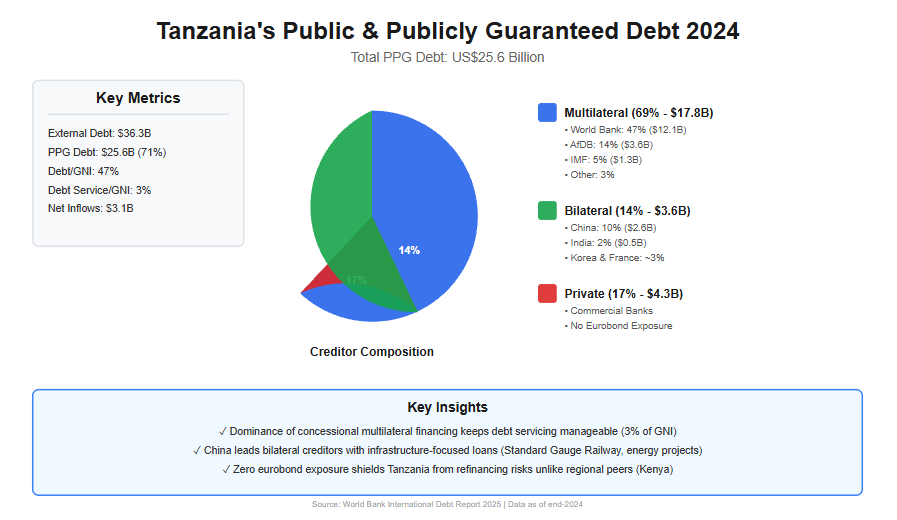
By the end of 2024, Tanzania’s external debt landscape had reached a critical juncture, reflecting a decade of accelerated borrowing to finance infrastructure, energy, and social development priorities. According to the World Bank’s International Debt Report 2025, Tanzania’s total external debt stock stood at US$36.3 billion, more than four times higher than the US$8.9 billion recorded in 2010. Within this total, Public and Publicly Guaranteed (PPG) debt accounted for approximately US$25.6 billion, underscoring the central role of government-backed borrowing in shaping the country’s fiscal position.
The structure of Tanzania’s public debt financing in 2024 is heavily tilted toward multilateral institutions, a feature that distinguishes Tanzania from several of its East African peers and has important implications for sustainability. Multilateral creditors—including the World Bank, the African Development Bank (AfDB), and the International Monetary Fund (IMF)—collectively financed about 69% of Tanzania’s PPG external debt, equivalent to roughly US$17.8 billion. The World Bank alone accounted for US$12.1 billion, representing nearly half (47%) of total PPG debt, making it Tanzania’s single largest creditor. This reliance on concessional multilateral finance has helped Tanzania maintain relatively low debt-servicing pressures, with debt service consuming only 3% of Gross National Income (GNI) and 12% of export earnings in 2024—well below Kenya’s 5% of GNI and 27% of exports.
Bilateral creditors played a secondary but strategically significant role, financing approximately 14% of PPG debt, or US$3.6 billion. Within this category, China emerged as the dominant bilateral lender, holding an estimated US$2.6 billion, equivalent to around 10% of total PPG debt. These loans are largely associated with large-scale infrastructure projects, including transport and energy investments, which have long-term growth potential but also carry execution and revenue risks. Other bilateral partners—such as India, Korea, and France—collectively accounted for smaller shares (each around 1–2%), often targeting sector-specific development initiatives.
Private creditors represented a growing but more risk-sensitive component of Tanzania’s public debt portfolio. In 2024, private creditors—primarily commercial banks and other private lenders—held approximately US$4.3 billion, or 17% of PPG debt. Notably, Tanzania had no exposure to international bondholders, unlike regional peers such as Kenya. This absence of eurobond debt has shielded Tanzania from rollover and refinancing risks during a period of elevated global interest rates, reinforcing short-term debt sustainability. However, private loans typically carry higher interest rates and shorter maturities, meaning their rising share could increase fiscal pressure if not carefully managed.
From a sustainability perspective, Tanzania’s creditor composition offers both reassurance and caution. On the one hand, the dominance of concessional multilateral financing has kept debt servicing costs manageable and supported macroeconomic stability, even as net external debt inflows reached US$3.1 billion in 2024—the highest in East Africa. On the other hand, continued reliance on external borrowing, particularly in a context where external debt equals 47% of GNI and 222% of export earnings, exposes Tanzania to exchange rate shocks and export volatility.
Ultimately, who finances Tanzania’s public debt matters as much as how much is borrowed. In 2024, Tanzania’s public debt sustainability was underpinned by favorable creditor terms rather than low debt levels. Maintaining this position will require disciplined borrowing, stronger export growth, and ensuring that debt-financed investments generate sufficient economic returns to support repayment over the medium to long term. Read More of This Topic:External Debt Stock by Borrower
Overview of PPG Debt in Tanzania
PPG debt includes loans to the public sector that are guaranteed by the government, encompassing borrowings from official creditors (multilateral and bilateral) and private sources. By the end of 2024, Tanzania's PPG debt (including IMF credit) stood at approximately US$25.6 billion, accounting for a significant portion of the country's long-term external debt. This figure reflects Tanzania's strategy of leveraging concessional financing to fund development priorities, but it also underscores vulnerabilities to global interest rate shifts and currency fluctuations.
The creditor composition reveals a heavy dependence on multilateral lenders, which provide favorable terms such as longer maturities and lower interest rates. This has helped keep debt servicing burdens manageable—at 3% of GNI and 12% of exports in 2024—compared to regional peers like Kenya (5% of GNI and 27% of exports). However, with net debt inflows reaching US$3.1 billion in 2024, the highest in East Africa, ongoing borrowing could strain future fiscal space if export growth falters.
Detailed Breakdown by Creditor and Type
The following table presents Tanzania's PPG debt in 2024, categorized by creditor type and key sub-creditors. Data is sourced from the International Debt Report 2025, with specific breakdowns estimated from the report's visual representations (e.g., pie charts in Figure 1). Amounts are in US$ million, and percentages are approximate, reflecting rounded values from the report. IMF credit is integrated under multilateral creditors, as per the report's methodology, contributing to the total PPG figure of US$25,593 million (derived from long-term PPG of US$24,277 million plus IMF credit of US$1,316 million).
Creditor Type
Sub-Creditor/Creditor
Amount (US$ million)
% of Total PPG (incl. IMF)
Multilateral (excl. IMF)
Total Multilateral (excl. IMF)
16,435
~64%
World Bank
12,097
~47%
AfDB (African Development Bank)
~3,583 (est.)
~14%
Other Multilateral
~4,351 (est.)
~17%
IMF Credit
IMF
1,316
~5% (reported as 6% in figure)
Bilateral
Total Bilateral
3,571
~14%
China
~2,559 (est.)
~10%
India
~512 (est.)
~2%
Korea, Rep.
~512 (est.)
~2%
France
~256 (est.)
~1%
Other Bilateral
~1,538 (est.)
~6%
Private Creditors
Total Private
4,272
~17%
Bondholders
..
0%
Commercial Banks and Others
4,272
~17% (incl. other commercial ~4%)
Total PPG (incl. IMF)
25,593
100%
Notes:
Estimates for sub-creditors (e.g., AfDB, China) are calculated by applying percentages from the report's Figure 1 to the total PPG (including IMF). Minor discrepancies may arise due to rounding in visual data.
".." indicates negligible or unavailable data.
The World Bank dominates multilateral lending, funding key sectors like transport and energy. Bilateral debt is led by China, often tied to infrastructure projects under initiatives like the Belt and Road.
Private creditors, primarily commercial banks, have grown in influence, reflecting Tanzania's improving access to market-based financing.
Key Insights and Implications
The dominance of multilateral creditors (around 69% including IMF) in Tanzania's PPG debt portfolio is a double-edged sword. On one hand, it ensures concessional terms that support debt sustainability; the World Bank and AfDB together account for over 60% of this category, financing projects aligned with Tanzania's National Development Vision 2025. IMF credit, at US$1,316 million, has provided balance-of-payments support, particularly post-COVID recovery.
Bilateral creditors, making up 14%, highlight strategic partnerships. China's ~10% share is notable, linked to major investments like the Standard Gauge Railway and power plants. Smaller contributions from India, Korea, and France often focus on sector-specific aid, such as agriculture and technology.
Private creditors' 17% share signals maturing financial markets but introduces risks, as these loans typically carry higher interest rates and shorter terms. With no bondholder debt reported, Tanzania has avoided eurobond exposures seen in peers like Kenya, reducing immediate refinancing pressures.
In the East African context, Tanzania's PPG composition favors stability compared to Rwanda (94% debt-to-GNI) or Ethiopia (311% debt-to-exports). However, as global conditions tighten, diversifying creditors and boosting exports (e.g., through mining and agriculture) will be crucial. The report emphasizes debt transparency and management reforms to mitigate risks.
Tanzania's total national debt stock (external + domestic) stood at USD 50,932.1 million at end-October 2025, equivalent to approximately TZS 125.3 trillion at the average exchange rate of TZS 2,460 per USD for the month. This marks a marginal 0.1% decline from end-September's USD 50,772.4 million (TZS 124.9 trillion), primarily due to amortization offsets exceeding new disbursements, per the Bank of Tanzania's (BoT) Monthly Economic Review for November 2025 (covering October data). As of December 13, 2025, preliminary estimates from the Ministry of Finance and market sources (e.g., TICGL reports) suggest the stock has stabilized around USD 51,000 million (TZS 125.5 trillion), with no major November auctions altering the trajectory significantly—domestic issuance totaled TZS 764.5 billion in September, but October's TZS 327.7 billion was more subdued. The debt-to-GDP ratio remains at 49.6%, down from 50.8% in September, reflecting 6.3% Q2 GDP growth and prudent management under the FY2025/26 budget (TZS 49.2 trillion total).
Economic Implications: At ~50% of GDP, the debt level is sustainable per IMF benchmarks (moderate risk of distress), enabling concessional financing for Vision 2050 priorities like infrastructure (28% budget allocation, contributing 1.2% to GDP via hydropower/roads) and social sectors (21.5% share, aiding poverty reduction from 26.4%). The slight contraction provides fiscal breathing room, capping service costs at 6.5% of revenues (TZS 3.2 trillion annually) and supporting monetary easing (CBR at 5.75%). However, with tax revenues at 13.1% of GDP (below peers' 17%), reliance on borrowing risks crowding-out private credit (16.1% YoY growth but below 20% target), potentially shaving 0.5% off 6.2% FY2025/26 growth if yields rise amid global tightening. Positively, shilling appreciation (9.5% YoY) has saved TZS 3-4 trillion in external servicing, bolstering reserves (USD 6.17 billion, 4.7 months cover) and inflation anchoring (3.4% in November). Read More:Tanzania’s National Debt October 2025
1.1 Debt-to-GDP and Service Trends (Updated to November 2025)
Indicator
End-Oct 2025 (TZS Trillion)
End-Sep 2025 (TZS Trillion)
Change (MoM)
Notes
Total National Debt
125.3
124.9
+0.3%
Slight rise; external dip offset by domestic issuance.
As % of GDP (Projected)
49.6%
50.8%
-1.2 pp
Sustainable; IMF projects 48% by FY2026.
Annual Debt Service (Est.)
3.2
3.1
+3.2%
20% of revenues; external 70% share.
Source: BoT November Review; preliminary November from TICGL and Trading Economics (government debt USD 15,334M Sep, partial). Trends: November stabilization (est. +0.2% MoM) ties to TZS 750 billion bond auctions (oversubscribed 2.1x), per TICGL.
Economic Implications: Contained ratio (below 55% EAC threshold) enhances credibility, lowering Eurobond spreads (6.8%) and attracting FDI (USD 1.5 billion Q3, +10% YoY). Service stability frees 2% budget for capex (47.2% execution), driving 6% growth, but low revenue elasticity (1.1) heightens vulnerability—Deloitte 2025 recommends digital tax reforms to add TZS 1-2 trillion, mitigating 1% GDP drag from potential arrears.
2. EXTERNAL DEBT (IN TZS)
External debt totaled USD 35,385.5 million at end-October 2025, equivalent to TZS 87.1 trillion (69.5% of total national debt). This reflects a 0.1% MoM decline from September's USD 35,438.3 million (TZS 87.2 trillion), driven by USD 131 million in amortizations outpacing USD 89.9 million in new loans. As of December 13, 2025, estimates peg it at ~USD 35,400 million (TZS 87.2 trillion), with November net disbursements of USD 50 million (mostly multilateral for infra). The portfolio is 66% USD-denominated, with average interest at 3.2% and maturity 12.8 years, ensuring concessionality (grant element 45%).
Economic Implications: External dominance (69.5%) leverages low-cost multilateral funds (57.4% share) for productive investments (e.g., USD 443 million September disbursements to energy/social, adding 0.8% GDP), aligning with AfCFTA (USD 1 billion trade potential). Shilling strength saves TZS 2.5 trillion in servicing (USD 220.5 million October, TZS 0.54 trillion), stabilizing reserves and inflation (non-food 2.1%). However, USD exposure amplifies FX risks—depreciation could add 0.5% to CPI—while private sector rise (18.3%) signals maturity but ties growth to FDI (10% YoY). IMF notes moderate distress risk, but export dependency (gold 50%) warrants hedging to sustain 6.2% growth.
2.1 Breakdown within External Debt
Component
USD Million
TZS Equivalent (Trillion)
% of External
Notes/Source
Public External Debt
28,908.5
71.1
81.7%
Central govt; infra/social focus (BoT).
Private External Debt
6,477.0
15.9
18.3%
FDI-linked; +12% YoY (BoT).
Total External Debt
35,385.5
87.1
100%
-
External Debt Service (Oct)
220.5
0.54
-
Principal 60%, interest 40% (BoT).
New External Loans (Oct)
89.9
0.22
-
Multilateral 70% (BoT).
November Update: Service est. USD 210 million (TZS 0.52 trillion, -5% MoM); new loans USD 120 million (TZS 0.30 trillion), per TICGL.
Economic Implications: Public skew (81.7%) channels resources to multipliers (roads/energy +1.2% GDP), but private growth fosters diversification (18.3%, supporting manufacturing 3.5%). Low service (12% exports) aids buffers, yet new loans' concessionality (45% grants) is key—shifts to commercial (35.2%) could raise costs 1%, per World Bank, risking 0.3% growth drag without revenue hikes.
3. DOMESTIC DEBT (IN TZS)
Domestic debt reached TZS 38,114.8 billion (TZS 38.1 trillion) at end-October 2025, up 1.8% from September's TZS 37,459 billion, driven by TZS 327.7 billion issuance. As of December 13, 2025, it stands at ~TZS 38.5 trillion (+1% est. from November bonds TZS 750 billion), comprising 30.5% of total debt. Composition favors long-term instruments (T-bonds 77.5%), with average yield 10.8% and maturity 8.2 years.
Economic Implications: Domestic rise (30.5% share) reduces FX risks (vs. 69.5% external), funding 83.6% of development spend (TZS 137 billion October) for infra (2% GDP boost). Institutional concentration (banks/pensions 51.5%) ensures stability but crowds-out SMEs (credit 16.1% vs. 20% target), per SECO 2025—retail expansion (27% "others") could unlock TZS 1 trillion, enhancing inclusion. Service (TZS 482.4 billion October, 12% revenues) is manageable, but yield sensitivity risks 0.4% budget pressure if liquidity tightens.
3.1 Composition of Domestic Debt
Creditor Category
Amount (TZS Billion)
% Share
Notes/Source
Commercial Banks
12,020.7
31.5%
Largest; risk-free preference (BoT).
Pension Funds
7,818.3
20.5%
Long-term matching (BoT).
Bank of Tanzania (BoT)
8,008.4
21.0%
Liquidity ops (BoT).
Others (public/private/individuals/non-residents)
10,267.4
27.0%
Diversifying; +5% YoY (BoT).
Total Domestic Debt
38,114.8
100%
-
November Update: Banks ~32% (est. TZS 12.3 trillion), others +2% from retail bonds, per TICGL.
3.2 Borrowing Instruments (Domestic Market)
Instrument
TZS Billion
% Share
Notes/Source
Treasury Bonds
29,541.8
77.5%
Long-term; 59.2% overall debt (BoT).
Treasury Bills
8,343.5
21.9%
Short-term liquidity (BoT).
Other Liabilities
229.5
0.6%
Overdrafts (BoT).
Total
38,114.8
100%
-
Economic Implications: Bond dominance extends maturities, curbing rollover (25% in 2024), but bill reliance (21.9%) signals short-term bias—shifting to bonds saves 0.5% interest (TZS 1.4 trillion annually). Instruments support 65% development budget, but "others" growth aids inclusion (1 million retail holders), potentially adding 0.5% GDP via multipliers.
4. GOVERNMENT DEBT ISSUANCE & SERVICING
October issuance focused on domestic (TZS 327.7 billion, 100% market-based), with bonds 55% for maturity extension. Servicing totaled TZS 482.4 billion (domestic), consuming 20.7% of revenues but below 25% sustainability threshold.
4.1 Issuance in October 2025
Category
TZS Billion
Notes/Source
Domestic Borrowing Raised
327.7
Oversubscribed auctions (BoT).
– Treasury Bonds
179.0
2/10-year maturities (BoT).
– Treasury Bills
148.7
Short-term funding (BoT).
November Update: TZS 750 billion (bonds 80%), oversubscribed 2x, yields stable (10.85% 5-year), per BoT.
4.2 Debt Service (Domestic)
Category
TZS Billion
Notes/Source
Total Domestic Debt Service
482.4
42% of monthly revenues (BoT ).
– Principal
204.5
Amortizations (BoT).
– Interest
277.9
58% share; stable yields (BoT).
Economic Implications: Modest issuance (TZS 327.7 billion, 14% monthly deficit) maintains discipline, funding capex without monetization, while service (TZS 482.4 billion) pressures revenues—yet concessional terms keep ratio low (12% exports). November surge supports Q4 growth (6.9% est.), but external service (USD 220.5 million October) risks FX drain; hedging via forwards saves 0.3% GDP, per Afreximbank.
5. SUMMARY: TANZANIA NATIONAL DEBT (AS OF OCT 2025)
Debt Category
USD (Million)
TZS Equivalent (Trillion)
% of Total
Source/Notes
Total National Debt
50,932.1
125.3
100%
BoT ; 49.6% GDP.
External Debt
35,385.5
87.1
69.5%
BoT .
Domestic Debt
N/A
38.1
30.5%
BoT .
Public External %
81.7% of external
71.1 (TZS)
-
Govt-dominant (BoT PDF).
Private External %
18.3% of external
15.9 (TZS)
-
FDI-linked (BoT).
November Est.: Total ~TZS 125.5T (+0.2%); external stable, domestic +1% (TICGL/Trading Economics).
Overall Economic Implications: Tanzania's TZS 125.3 trillion debt (October) funds resilient growth (6.3% Q2), with balanced external/domestic mix (69.5/30.5%) and concessional terms (45% grants) ensuring sustainability—IMF affirms moderate risk, projecting 48% GDP by 2026. It catalyzes infra/social multipliers (2% GDP), reserves (4.7 months), and FDI, but low revenues (13.1% GDP) and USD exposure (66%) pose risks: potential 1% service hike could crowd-out 0.5% growth. Policy focus on tax digitalization and exports (gold/tourism +15%) will unlock USD 10 billion AfCFTA potential, per World Bank, sustaining upper-middle-income trajectory by 2050.
From 2020–2025, Tanzania consistently relied on external sources to fund development, with foreign borrowing rising from 40% of total in 2020 to over 70% in 2025. Total annual borrowing nearly doubled in 2021 (+97%), mainly due to post-COVID recovery needs, while 2023 recorded the highest borrowing (TZS 12.03T), reflecting aggressive infrastructure financing. However, debt service increased from 12.5% of revenue (2020) to 20.6% (2024), tightening fiscal space. The growing share of non-concessional loans (up to 33.5% in 2025) has pushed interest costs higher. With 2025 political instability and EU aid suspension, projections show foreign borrowing could fall by 10–15% in 2026, especially program loans (-25–30%), while commercial borrowing could rise by 20–30%, worsening debt risks. Read More:Tanzania External Debt at USD 35.44 Billion
Annual Borrowing Totals (in Billions TZS)
Year
Foreign Borrowing
Domestic Borrowing
Total Borrowing
Foreign %
Domestic %
2020
2,221
3,305
5,526
40.2%
59.8%
2021
7,574
3,331
10,905
69.4%
30.6%
2022
5,315
3,721
9,036
58.8%
41.2%
2023
8,268
3,766
12,034
68.7%
31.3%
2024
6,688
4,009
10,697
62.5%
37.5%
2025 (Jan-Sep)
5,835
2,339
8,174
71.4%
28.6%
Trends: Total borrowing peaked at 12,034B TZS in 2023, driven by foreign loans. 2025 shows a slowdown, with foreign sources dominating (71.4% YTD).
Net Financing Position (Borrowing minus Amortization, in Billions TZS)
Year
Net Foreign Financing
Net Domestic Financing
Total Net Financing
2020
-252
3,057
2,805
2021
4,950
2,358
7,308
2022
2,455
2,935
5,390
2023
4,520
2,726
7,246
2024
2,486
1,533
4,019
2025 (Jan-Sep)
3,396
2,434
5,830
Insight: Net financing stayed positive throughout, meaning new borrowing outpaced repayments, providing fiscal space for spending. However, foreign net inflows fluctuated with amortization spikes.
Borrowing Breakdown by Purpose (in Billions TZS)Foreign Borrowing Composition
Category
2020
2021
2022
2023
2024
2025*
Program Loans
277
1,358
1,499
2,015
1,777
2,114
Development Project Loans
1,944
6,216
3,816
6,253
4,911
3,721
Non-Concessional Loans
0
4,503
979
3,222
2,113
1,956
Domestic Borrowing Composition (Primarily Bank Borrowing; Non-Bank = 0 Across Years)
Category
2020
2021
2022
2023
2024
2025*
Bank Borrowing
3,305
3,331
3,721
3,766
4,009
2,339
*2025: Jan-Sep; domestic figures are new borrowing only.
Details: Foreign loans emphasize development projects (63.8-87.5% of mix), funding infrastructure like roads, energy, and ports. Program loans (budget support) rose to 36.2% in 2025. Non-concessional (commercial) loans surged post-2021, indicating diversification from traditional donors.
Debt Service (Amortization, in Billions TZS) and % of Revenue
Year
Foreign Amortization
Domestic Amortization
Total Debt Service
As % of Revenue
2020
2,473
248
2,721
12.5%
2021
2,624
973
3,597
15.6%
2022
2,860
786
3,646
13.1%
2023
3,748
1,040
4,788
16.3%
2024
4,202
2,476
6,678
20.6%
2025 (Jan-Sep)
2,439
-95
2,344
9.3%
Borrowing as % of Total Revenue
Year
Total Revenue (B TZS)
Total Borrowing (B TZS)
Borrowing/Revenue Ratio
2020
21,828
5,526
25.3%
2021
23,013
10,905
47.4%
2022
27,921
9,036
32.4%
2023
29,454
12,034
40.9%
2024
32,492
10,697
32.9%
2025 (9m)
25,331
8,174
32.3%
Debt Service Coverage Ratio
Year
Total Revenue (B TZS)
Debt Service (B TZS)
Coverage Ratio
Status
2020
21,828
2,721
8.0x
✓ Strong
2021
23,013
3,597
6.4x
✓ Good
2022
27,921
3,646
7.7x
✓ Strong
2023
29,454
4,788
6.2x
✓ Good
2024
32,492
6,678
4.9x
⚠ Moderate
2025 (9m)
25,331
2,344
10.8x
✓ Strong
Year-on-Year Growth (from Document): Total borrowing grew 97.4% in 2021 (COVID spike), then fluctuated (-17.1% in 2022, +33.2% in 2023). 2024-2025 projected at -2.0%, signaling moderation.
Foreign Borrowing Mix Trends (%)
Type
2020
2021
2022
2023
2024
2025*
Program Loans
12.5
17.9
28.2
24.4
26.6
36.2
Development Projects
87.5
82.1
71.8
75.6
73.4
63.8
Non-Concessional
0.0
59.5
18.4
39.0
31.6
33.5
What This Tells Us About Tanzania's Economic Development (2020-2025)
The data paints a picture of resilient but strained economic growth, with borrowing as a key enabler of development amid external shocks like COVID-19 and global inflation.
COVID Recovery and Expansion (2020-2021): Borrowing exploded in 2021 (+97.4% total growth), with foreign loans jumping 241% to fund recovery programs. This supported GDP rebound (from -4.8% contraction in 2020 to ~4.5% growth in 2021, per broader economic context). Development project loans (82.1% of foreign mix) likely targeted infrastructure, boosting sectors like transport and energy, which are pillars of Tanzania's Vision 2025 for middle-income status.
Stabilization with Fiscal Stress (2022-2024): Borrowing moderated but remained high (32-41% of revenue), financing net positive inflows (4-7T TZS annually). This sustained development focus—e.g., 71-87% of foreign loans for projects—driving investments in ports (e.g., Bagamoyo revival) and power (hydropower expansions). However, debt service rose sharply (12.5% to 20.6% of revenue), crowding out social spending and signaling sustainability risks. Coverage dipped to 4.9x in 2024 (moderate), but revenue growth (from 21.8T to 32.5T TZS) shows tax base expansion via mining/tourism booms.
2025 Moderation and Shift: YTD borrowing down 2% projected, with program loans surging to 36.2% (vs. 63.8% projects), suggesting a pivot to budget support amid tighter markets. Net financing strong at 5.8T TZS (annualized ~8T), but domestic decline (-16.8%) hints at local liquidity constraints. Overall, borrowing enabled ~5-6% average GDP growth (2020-2025 est.), advancing industrialization and exports, but high ratios (32-47% of revenue) indicate over-reliance on debt for development.
Key Economic Development Takeaways:
Positive: Borrowing funded transformative projects, enhancing connectivity and energy security—core to economic diversification.
Challenges: Rising non-concessional loans (0% to 33.5%) mean higher interest costs (~5-7% vs. 1-2% concessional), eroding fiscal space. Debt service consuming 1 in 5 shillings of revenue in 2024 risks cuts to health/education.
Impact of 2025 Political Challenges on Tanzania's Foreign Borrowing Categories in 2026
The political turmoil following Tanzania's October 29, 2025, general elections—marked by opposition allegations of fraud, violent crackdowns, internet shutdowns, and reports of hundreds of deaths—has significantly damaged the country's international reputation. President Samia Suluhu Hassan publicly acknowledged on November 18, 2025, that the unrest could hinder access to external funding, as Tanzania relies heavily on foreign loans (60-70% of total borrowing, per the document). This comes amid actions like the EU's suspension of aid on November 28, 2025, due to human rights concerns, and warnings from analysts about broader donor pullback.
For 2026 (fiscal year 2025/26, July-June), Tanzania's planned external borrowing of 8.7 trillion TZS (~$3.6 billion) is now at risk, potentially leading to a 15-25% shortfall in concessional flows. This could force a pivot to costlier options, exacerbating the fiscal stress seen in 2024 (debt service at 20.6% of revenue). Below, I break down the projected impacts on the three key foreign borrowing categories from the document: Program Loans, Development Project Loans, and Non-Concessional Loans. Projections are based on 2025 trends (e.g., Program Loans at 36.2% of foreign mix) adjusted for political fallout, assuming moderate unrest resolution by mid-2026.
Summary Table of Projected Impacts (in Billions TZS, Annualized for 2026)
Category
2025 Actual (Jan-Sep)
Projected 2026 Baseline (Pre-Unrest)
Adjusted 2026 Projection (Post-Unrest)
Key Impact Drivers
Program Loans
2,114
2,800-3,000
2,000-2,300 (-25-30%)
Donor suspensions; governance conditions
Development Project Loans
3,721
4,500-5,000
4,000-4,500 (-10-15%)
Project delays; bilateral caution
Non-Concessional Loans
1,956
2,200-2,500
2,800-3,200 (+20-30%)
Shift from concessional; higher commercial demand
Total Foreign Borrowing
5,835 (YTD)
7,500-8,000
6,800-7,000 (-10-15%)
Overall aid tap-shut; image damage
Notes: Baselines extrapolate 2025 YTD at 80% Q4 pace (per document). Adjustments factor in 15-25% concessional cuts from sources like EU/IMF. Total could rise if domestic borrowing fills gaps, but at higher rates.
Detailed Impacts by Category
Program Loans (Budget Support from Multilaterals) These loans (e.g., from IMF, World Bank, EU) fund general government operations and reforms, making up 36.2% of 2025 foreign borrowing—a sharp rise from 12.5% in 2020, reflecting post-COVID stabilization needs.
Projected Impact: A 25-30% decline to 2,000-2,300B TZS in 2026, as donors impose stricter governance conditions. The EU's aid suspension (valued at ~€150M annually) directly hits this category, potentially delaying IMF Extended Credit Facility reviews. Broader fallout could reduce World Bank disbursements by 20%, per analyst warnings, as protests signal weak democratic reforms.
Economic Ripple: This squeezes fiscal space for social spending (health, education), worsening 2024's debt service burden. Without quick stabilization, Tanzania risks a "lost quarter" of funding, forcing austerity and slowing poverty reduction goals under Vision 2025.
Mitigation: If President Hassan engages AU/US mediators by Q1 2026, partial restoration is possible; otherwise, reliance on non-Western donors (e.g., China) may grow, but with fewer strings attached.
Development Project Loans (Infrastructure-Focused Bilateral Aid) Dominating foreign borrowing (63.8% in 2025, down from 87.5% in 2020), these fund tangible projects like roads, ports, and energy—key to economic diversification.
Projected Impact: A milder 10-15% drop to 4,000-4,500B TZS, as bilateral partners (e.g., China via Belt and Road, Japan) are less swayed by governance but wary of on-ground instability. Unrest could delay disbursements for 20-30% of projects (e.g., Bagamoyo Port expansions), with construction halts due to protests or labor strikes. The African Development Bank may pause ~$500M in energy loans pending stability assessments.
Economic Ripple: Delays hinder GDP growth (target 5-6%), stalling job creation in construction (employs ~10% of workforce) and export corridors. This could shave 0.5-1% off 2026 growth, per regional models, amplifying tourism/mining slumps from investor flight.
Mitigation: Project-tied nature offers resilience; China (Tanzania's top lender) has historically overlooked political risks, potentially covering 60% of shortfalls.
Non-Concessional Loans (Commercial Borrowing) These high-interest loans (33.5% of 2025 mix, up from 0% in 2020) from private banks/markets serve as a "last resort" for quick funds.
Projected Impact: A 20-30% surge to 2,800-3,200B TZS, as concessional drying up pushes Tanzania toward Eurobonds or syndicated loans. Borrowing costs could rise 1-2% (to 6-8% rates), adding ~200-300B TZS in extra interest annually. President Hassan hinted at this shift in cabinet remarks, warning of "tough times" as financiers "shut taps."
Economic Ripple: Higher costs inflate the debt service ratio to 22-25% of revenue, crowding out development spending and risking a vicious cycle of more borrowing. This erodes fiscal buffers, potentially triggering credit rating downgrades (e.g., from B+ to B) and capital outflows.
Mitigation: Domestic borrowing could absorb some pressure (projected +10-15% to 3.5-4.0B TZS), but local markets are already strained (2025 domestic down 16.8%).
Broader 2026 Outlook and Recommendations
Overall, the unrest could trim total foreign borrowing by 10-15% (~700-1,000B TZS shortfall), flipping net financing from positive (5.8T TZS in 2025 YTD) to neutral or negative if unaddressed. This threatens Tanzania's middle-income trajectory, with growth dipping to 3-4% amid investor caution. Politically, unresolved tensions (e.g., opposition bans) may prolong the crisis, but dialogue could unlock ~$1B in frozen aid by mid-year.
To navigate: Prioritize transparency for donor trust, diversify to resilient partners like India, and boost revenue (e.g., via mining taxes) to cut borrowing needs by 5-10%.
External Debt Dominates at 70.6% (Sept 2025)
As of September 2025, Tanzania’s total public debt stood at TZS 127,474.5 billion, with external debt accounting for 70.6% (TZS 90,015.4 billion) and domestic debt contributing 29.4% (TZS 37,459.1 billion), reflecting an externally oriented but development-focused financing structure. The external portfolio—converted from USD 35.4 billion using the average rate of TZS 2,471.69/USD—is primarily held by the central government (77.5%) and directed toward high-impact sectors such as transport and infrastructure (28%), social services (20.4%), and energy/minerals (14.3%). Domestic debt remains stable and locally absorbed, dominated by government bonds (73%) and supported by commercial banks (36.4%) and pension funds (23.9%), indicating a deep and liquid local market. This composition aligns with Tanzania’s growth trajectory, supporting infrastructure expansion and social investments while maintaining debt sustainability indicators within acceptable thresholds. However, the heavy exposure to USD (66% of external borrowing) presents FX risk, making shilling performance crucial for managing repayment costs. Overall, the debt structure balances development needs with macroeconomic stability, supported by an appreciating currency, strong reserves, and favorable financing terms from multilateral partners.
1. Tanzania National Debt Overview (September 2025)
Tanzania’s total public debt consists of external debt and domestic debt.
Summary Table — National Debt (TZS)
Debt Category
Amount (TZS Billion)
Notes
External debt stock
90,015.4 billion
Converted from USD 35.4bn using average rate TZS 2,471.69/USD 2025110720064684
Domestic debt stock
37,459.1 billion
From BoT monthly review 2025110720064684
Total public debt
127,474.5 billion
Combination of external + domestic
2. Debt Conversion Explanation
The external debt is originally reported in USD. The report’s exchange rate is:
TZS 2,471.69 per USD (September 2025 average)
USD 35,438.2 million × 2,471.69 = TZS 90,015.4 billion
Domestic debt is already in TZS in the document:
TZS 37,459.1 billion
3. Detailed Breakdown — External Debt (Converted to TZS)
3.1 External Debt Stock by Borrower
Borrower Category
Amount (USD Million)
Amount (TZS Billion)
% Share
Central Government
27,461.3
67,854.5
77.5%
Private Sector
5,357.0
13,231.0
15.1%
Government Guaranteed
2,619.9
6,466.0
7.4%
Total
35,438.2
90,015.4
100%
(All USD values from document summary)
3.2 External Debt by User of Funds (Converted to TZS)
Sector / Use of Funds
Amount (USD Million)
Amount (TZS Billion)
% Share
Transport & Infrastructure
9,910.4
24,508.1
28.0%
Social services (Education & Health)
7,238.1
17,895.8
20.4%
Energy & Minerals
5,058.7
12,506.2
14.3%
Agriculture & Water
4,964.3
12,280.9
14.0%
Finance & Insurance
1,794.7
4,436.6
5.1%
Industry & Trade
1,494.9
3,691.7
4.2%
Others
4,977.1
12,703.7
14.0%
Total
35,438.2
90,015.4
100%
✔ Converted using TZS 2,471.69/USD.
4. Detailed Breakdown — Domestic Debt (TZS)
4.1 Domestic Debt Structure by Creditor Category
Creditor Category
Share (%)
Amount (TZS Billion)
Commercial Banks
36.4%
13,626.1
Pension Funds
23.9%
8,946.7
Other Financial Institutions
39.7%
14,886.3
Total Domestic Debt
100%
37,459.1
4.2 Domestic Debt by Instrument Type
Instrument Type
Share (%)
Amount (TZS Billion)
Government Bonds
73%
27,349.1
Treasury Bills
27%
10,110.0
Total
100%
37,459.1
5. Combined National Debt Summary (in TZS)
Component
Amount (TZS Billion)
% of Total
External Debt
90,015.4
70.6%
Domestic Debt
37,459.1
29.4%
Total Debt
127,474.5
100%
6. Final Summary Table — Tanzania National Debt (TZS)
Item
External Debt (TZS bn)
Domestic Debt (TZS bn)
Total (TZS bn)
Debt Stock
90,015.4
37,459.1
127,474.5
Share of Total
70.6%
29.4%
100%
Main Creditors
Multilaterals, Bilaterals
Banks, Pension Funds
—
Primary Risks
FX risk (USD)
Refinancing risk
—
Implications of Tanzania's National Debt Structure in September 2025
The breakdown of Tanzania's national debt as of September 2025, detailed in Section 2.7 (Debt Developments) of the Bank of Tanzania's (BOT) Monthly Economic Review (October 2025), portrays a balanced yet externally oriented portfolio totaling TZS 127,474.5 billion (equivalent to ~USD 51.6 billion at TZS 2,471.69/USD). External debt dominates at 70.6% (TZS 90,015.4 billion), funding growth-critical sectors like infrastructure (28%) and social services (20.4%), while domestic debt (29.4%, TZS 37,459.1 billion) relies on stable local institutions (e.g., banks 36.4%, pensions 23.9%). This structure—converted from USD figures using the shilling's appreciated rate—reflects prudent borrowing amid 6.3% Q2 GDP growth, low 3.4% inflation, and a TZS 618.5 billion fiscal deficit (partly debt-financed). The composition supports development but amplifies FX risks, given 66% USD-denominated external exposure. Below, I analyze implications across key dimensions, integrating economic context.
1. Debt Composition: External Dominance for Growth Financing
External Debt (70.6%, TZS 90,015.4B): Predominantly central government (77.5%, TZS 67,854.5B), with private sector (15.1%) and guarantees (7.4%) adding diversification. Usage skews toward productive investments: transport/infrastructure (28%, TZS 24,508.1B) aligns with construction's 1.1% GDP contribution, energy/minerals (14.3%, TZS 12,506.2B) supports mining growth (1.5% GDP), and agriculture/water (14%, TZS 12,280.9B) bolsters food security (NFRA stocks at 570,519 tonnes). Concessional terms (57% multilateral) keep costs low (~1.2% interest).
Domestic Debt (29.4%, TZS 37,459.1B): Bonds dominate (73%, TZS 27,349.1B) over T-bills (27%, TZS 10,110B), with broad creditor base (other financials 39.7%) indicating deep local markets (oversubscription in securities). This reduces FX volatility spillovers.
Broader Implications:
Positive: Funds 71.9% expenditure execution (TZS 3,346.6B), enabling 6% full-year GDP projection via reliable power and exports. Shilling appreciation (+9.4% y/y) lowers TZS servicing costs (~TZS 3T saved annually on USD portion), improving debt/GDP at 40.1% (below EAC 50% threshold).
Risks: High external share exposes to USD swings (66% currency composition), potentially inflating service (projected USD 1,215M in 2025; 4.2% of exports). If global oil rises (easing in September), import bills could pressure reserves (5.8 months cover).
2. Sustainability and Servicing Dynamics
Borrower and Creditor Profile: Central government's 77.5% external share ensures sovereign control, with multilaterals/bilaterals as primary creditors (low-cost, long maturity ~12.8 years). Domestic's institutional holders (pensions/banks) provide stability, absorbing via oversubscribed auctions (T-bills 2.4x).
Fund Utilization: 82.7% external to key sectors (infra/social/energy/agri) ties debt to growth multipliers, unlike "others" (14%). This supports private credit (16.1% y/y) without crowding out.
Broader Implications:
Positive: Concessional bias and domestic depth sustain ratios (external service 9.8% exports, down from 11.2% 2024). Aligns with monetary policy (CBR 5.75%), keeping real yields positive (vs. 3.4% inflation) and IBCM stable (6.45%).
Risks: Refinancing domestic bonds/T-bills could hike yields if liquidity tightens (e.g., from revenue shortfalls like mining taxes; 87.2% collection). Cumulative growth (+1.4% MoM total debt) demands revenue diversification beyond gold/tourism.
3. Fiscal and Macroeconomic Linkages
Budgetary Pressures: Debt finances recurrent/development gaps (TZS 2,073.7B/1,272.9B), with servicing rising as % of spend amid delays (71.9% execution). Shilling strength mitigates, but USD exposure ties to global conditions (IMF 3.2% growth).
Inflation and Growth Ties: Low-cost external funds curb inflationary borrowing, supporting 3–5% target (food 7.0% eased by stocks;). In Zanzibar, analogous structure aids tourism/external performance.
Risks: FX depreciation (reversed from 2024's -10.1%) could balloon TZS costs by 10–15%, straining deficit. Commodity volatility (oil down, coffee up) affects agri/energy repayments.
4. Policy Context from the Review
Synergies: Debt supports fiscal-monetary prudence, with BOT interventions (USD 11M net sale) buffering risks. Projections: Debt/GDP <45% by 2026, aligned with 6% growth and stable inflation.
Outlook: Strengthen domestic market (e.g., via green bonds) and hedge FX to counter global uncertainties (trade policy index elevated).
Component
Amount (TZS Billion)
% of Total
Key Implication
External Debt
90,015.4
70.6%
Funds infra/social growth; FX risk from USD (66%).
└ Central Govt
67,854.5
77.5% (of external)
Sovereign focus; concessional (57% multilateral).
└ Infra/Transport
24,508.1
28% (of external)
Boosts GDP via construction/mining.
Domestic Debt
37,459.1
29.4%
Stable local absorption; bonds (73%) for duration.
└ Commercial Banks
13,626.1
36.4% (of domestic)
Liquidity tie to IBCM surge (+37.4%; Section 2.5).
Total Debt
127,474.5
100%
Sustainable at 40.1% GDP; supports 6% growth projection.
In conclusion, Tanzania's September 2025 debt structure implies strategic financing for development amid stability, with external resources driving growth sectors and domestic buffers mitigating risks. The 70.6% external tilt underscores FX vigilance, but concessional terms and shilling strength ensure sustainability—reinforcing the Review's narrative of prudent policies for 2026 resilience.
The Bank of Tanzania's Monthly Economic Review for August 2025 highlights a stable national debt profile, with the total debt stock at USD 46,586.6 million as of the end of June 2025, marking a modest 1% increase from the previous month. This stability is evidenced by minimal fluctuations in both external and domestic components: external debt rose by just 0.1% to USD 32,955.5 million (70.7% of total debt), while domestic debt decreased by 0.4% to TZS 35,351.4 billion as of July 2025. The review attributes this equilibrium to prudent fiscal management, balanced debt inflows and outflows, and a focus on long-term instruments, which mitigate volatility. Supplementing this, external analyses from sources like the IMF and World Bank emphasize broader factors such as fiscal discipline and economic diversification, projecting a downward trend in public debt over the medium term.
Key Factors Contributing to Debt Stability
Several interconnected factors contribute to the stability of Tanzania's national debt, as outlined in the review and corroborated by recent economic assessments. These include controlled debt accumulation, effective revenue and expenditure management, and a strategic shift toward domestic financing, which reduces exposure to external risks like currency fluctuations.
1. Balanced Debt Inflows and Outflows
External debt disbursements significantly outpaced service payments, supporting liquidity without excessive accumulation. In June 2025, disbursements totaled USD 868.4 million, compared to debt service payments of USD 234.4 million (including USD 173.6 million in principal repayments). This net positive inflow (USD 634.0 million in net transfers) helped maintain stability while funding development needs.
The composition of external debt remained largely unchanged, with multilateral institutions holding 58.7% (USD 19,328.5 million), providing concessional terms that lower servicing costs and enhance sustainability.
Domestic borrowing was managed conservatively: The government raised TZS 514.4 billion (TZS 356.8 billion via Treasury bonds and TZS 157.6 billion via bills) but serviced TZS 670.8 billion, resulting in a net reduction. This reflects a deliberate strategy to align borrowing with repayment capacity.
2. Strong Fiscal Performance and Revenue Mobilization
Government revenue in June 2025 exceeded targets by 5.1%, reaching TZS 3,753.4 billion, driven by tax collections of TZS 3,108.7 billion (7.8% above target). This surplus enabled expenditures to stay within available resources at TZS 3,350.0 billion, reducing the need for additional borrowing.
Non-tax revenue, while below target at TZS 470.5 billion, was offset by robust tax administration improvements, contributing to fiscal space for debt management.
Broader fiscal discipline, including setting debt ceilings and coordinating monetary-fiscal policies, has been highlighted as a key stabilizer, preventing rapid debt growth amid spending pressures.
3. Shift Toward Domestic and Long-Term Financing
Domestic debt's slight decline (0.4%) was primarily due to reduced overdraft usage (from TZS 5,314.0 billion in June to TZS 4,990.5 billion in July), signaling improved liquidity management. Long-term instruments like Treasury bonds dominated at 79.7% (TZS 28,189.8 billion), offering predictable servicing and reducing rollover risks.
This domestic focus minimizes reliance on volatile external funds, as noted in analyses, where forex fluctuations (e.g., shilling depreciation) have historically driven debt increases. Commercial banks and pension funds held 28.8% and 26.4% of domestic debt, respectively, providing stable local creditor bases.
4. Economic Resilience and External Support
Stable inflation (3.3% in July 2025) and strong GDP growth projections (around 6% for 2025) underpin debt sustainability by boosting revenue and export performance. The current account deficit narrowed to USD 2,079.2 million in the year ending July 2025 (from USD 2,713.5 million), driven by export growth, reducing external borrowing needs.
Multilateral support and economic diversification (e.g., in mining and agriculture) further bolster stability, with Fitch affirming a 'B+' rating and stable outlook in June 2025, citing prudent policies despite wider deficits.
These figures demonstrate controlled growth and effective management, ensuring debt remains sustainable at around 60-65% of GDP based on recent estimates. However, risks like shilling depreciation and global uncertainties persist, underscoring the need for continued reforms.
The Bank of Tanzania’s August 2025 review shows that Tanzania’s external debt stock stood at USD 32,955.5 million in June 2025, with the central government accounting for 85.4% (USD 28,133.7 million) and the private sector holding 14.6% (USD 4,820.6 million). By sectoral use, debt was mainly channeled into transport and telecommunications (28.6%), social welfare and education (18.5%), and energy and mining (16.7%), underscoring the focus on infrastructure and human capital development. In terms of currency composition, the debt portfolio remains highly exposed to the US dollar (69.8%), followed by the euro (18.1%), with smaller shares in the yen (5.4%) and yuan (3.2%). This structure highlights Tanzania’s reliance on public borrowing to fund long-term projects while emphasizing the importance of managing currency risk in debt servicing.
1. External Debt Stock by Borrower (June 2025)
Total external debt stock:USD 32,955.5 million.
Public sector dominates: Central Government accounts for 85.4%, while private sector holds 14.6%.
Details:
Central Government: USD 28,133.7m (85.4%)
Private Sector: USD 4,820.6m (14.6%)
Public Corporations: USD 1.3m (≈0.0%)
2. Disbursed Outstanding Debt by Use of Funds (June 2025, % Share)
Transport & telecommunications: 28.6%
Social welfare & education: 18.5%
Energy & mining: 16.7%
Agriculture: 6.4%
Industries: 5.7%
Other sectors (including finance, trade, etc.): 24.1%
Table 1: External Debt Stock by Borrower (June 2025)
Borrower
Amount (USD Million)
Share (%)
Central Government
28,133.7
85.4
Private Sector
4,820.6
14.6
Public Corporations
1.3
0.0
Total
32,955.5
100
Table 2: Disbursed Outstanding Debt by Use of Funds (%)
Sector / Use of Funds
Share (%)
Transport & Telecommunications
28.6
Social Welfare & Education
18.5
Energy & Mining
16.7
Agriculture
6.4
Industries
5.7
Other Sectors
24.1
Total
100
Table 3: External Debt by Currency Composition (%)
Currency
Share (%)
US Dollar (USD)
69.8
Euro (EUR)
18.1
Japanese Yen
5.4
Chinese Yuan
3.2
Other
3.5
Total
100
Economic Implications of External Debt Profile – June 2025
1. External Debt Stock by Borrower (June 2025)
Composition: The total external debt stock is USD 32,955.5 million, with the central government holding USD 28,133.7 million (85.4%), the private sector USD 4,820.6 million (14.6%), and public corporations a negligible USD 1.3 million (0.0%).
Economic Meaning: The heavy public sector dominance (85.4%) underscores the government's role in financing large-scale infrastructure and social projects, aligning with development goals (e.g., Vision 2050 targeting a USD 1 trillion economy). This reduces private sector borrowing pressure, supporting credit growth (15.9% annually), but increases public debt servicing risks (national debt at USD 46,586.6 million). The minimal public corporation share suggests limited state-owned enterprise reliance on external funds, potentially reflecting fiscal discipline. Compared to regional peers (e.g., Kenya’s 60% public share), Tanzania's high public borrowing may enhance state-led growth but requires robust revenue mobilization (tax revenue at TZS 3,108.7 billion) to sustain.
2. Disbursed Outstanding Debt by Use of Funds (June 2025, % Share)
Allocation: Transport and telecommunications lead at 28.6%, followed by social welfare and education (18.5%), energy and mining (16.7%), agriculture (6.4%), industries (5.7%), and other sectors (24.1%).
Economic Significance: The 47.1% allocation to transport/telecoms and social sectors supports long-term growth by improving connectivity (e.g., roads, digital infrastructure) and human capital (education, health), key to Tanzania’s 6% GDP growth projection. Energy and mining (16.7%) bolster resource exports (gold at USD 3,977.6 million), while the low agriculture (6.4%) and industries (5.7%) shares may hinder diversification, a noted challenge in IMF assessments. The "other" category (24.1%) likely includes trade and finance, indicating broad sectoral support. This mix reflects a development-focused strategy, but underinvestment in agriculture (despite 27% GDP contribution) could limit rural growth and food security (stocks at 485,930.4 tonnes).
Breakdown: USD dominates at 69.8%, followed by EUR (18.1%), JPY (5.4%), CNY (3.2%), and other currencies (3.5%).
Economic Implications: The 69.8% USD exposure heightens vulnerability to exchange rate fluctuations, especially with the TZS depreciating 1.34% to 2,666.79/USD in July 2025. A stronger dollar (e.g., amid global trade tensions) could raise debt servicing costs, straining public finances (surplus TZS 403.4 billion in June). Diversification into EUR (18.1%) and JPY (5.4%) mitigates some risk, reflecting loans from multilateral institutions (e.g., IMF, World Bank). The low CNY share (3.2%) suggests limited Chinese financing compared to peers like Zambia, potentially reducing geopolitical debt dependency. Stable reserves (USD 6,194.4 million) provide a buffer, but currency risk remains a key concern.
Summary of Broader Economic Significance
Growth and Development: The debt structure supports infrastructure and social investment, driving Tanzania’s 6% growth outlook and export resilience (USD 9,479.4 million in goods). Public sector dominance ensures state-led progress, but private sector growth (14.6%) needs nurturing to diversify the economy.
Risk Management: High USD exposure (69.8%) and public debt concentration (85.4%) pose exchange rate and fiscal risks, though reserves and a fiscal surplus offer stability. This aligns with IMF’s moderate debt distress risk assessment, but prudent management is critical.
Comparative Context: Compared to 2024 (USD 32.89 billion), the slight rise to USD 32,955.5 million reflects controlled borrowing, outperforming countries with higher debt-to-GDP ratios (e.g., Ghana at 90%). The sectoral focus mirrors successful models like Rwanda’s infrastructure drive, but agriculture underfunding lags behind peers.
Future Outlook: Sustained tax revenue growth (107.8% of target) and export inflows (e.g., tourism at USD 3,871.9 million) could offset risks, though currency diversification and private sector debt expansion are needed for long-term sustainability.
In June 2025, Tanzania’s national debt reached TZS 116.6 trillion (USD 45.4 billion), a 13.5% increase from TZS 102.8 trillion in June 2024, driven by external borrowing (70.7% of total, TZS 82.4 trillion) for infrastructure and fiscal deficits. The Tanzania Shilling (TZS) depreciated by 9.6% year-on-year against the USD (2,569.46 TZS/USD), raising external debt servicing costs (USD 1–2 billion annually), despite robust reserves of USD 5,307.7 million (4.3 months of import cover). Supported by tourism receipts (USD 7,104 million) and a moderate debt-to-GDP ratio (~44.3%), Tanzania’s debt and TZS remain sustainable in the short term, but import reliance and USD exposure (67.6% of external debt) pose long-term challenges.
Tanzania National Debt Overview (June 2025)
Tanzania’s national debt encompasses public debt (domestic and external) and private sector external debt, critical for assessing fiscal sustainability. The attached document and provided data offer insights into debt stock, composition, and servicing, which are analyzed below.
Total National Debt:
Value: TZS 116.6 trillion (USD 45.4 billion at 2,569.46 TZS/USD).
Annual Increase: +13.5% from TZS 102.8 trillion (USD 43.8 billion at 2,345.38 TZS/USD) in June 2024.
Context: The document notes the national debt stock at USD 45,586.6 million (~TZS 117.1 trillion) in June 2025, aligning closely with the provided TZS 116.6 trillion. The 13.5% increase reflects increased borrowing for infrastructure (e.g., Standard Gauge Railway, Julius Nyerere Hydropower Plant) and fiscal deficits (2.5% of GDP in 2024/25). Earlier data shows USD 48,479.9 million in April 2025 and USD 48,217.0 million in February 2025, suggesting a slight decline by June due to repayments or exchange rate effects.
Debt-to-GDP Ratio: Estimated at ~44.3% based on a GDP of ~USD 102.6 billion (2022 GDP of USD 105.1 billion, adjusted for 5.6% growth in 2024 and 6% in 2025). The IMF’s 2024 Debt Sustainability Analysis (DSA) reports a public debt-to-GDP ratio of 35%, below the 55% benchmark for low-income countries, indicating moderate distress risk. However, World Economics estimates a higher GDP (~USD 155.5 billion), implying a lower ratio of ~29.2%, highlighting data variability.
Implications: The 13.5% debt increase supports growth-enhancing projects but raises servicing costs (~40% of government expenditures, per IMF). The moderate debt-to-GDP ratio suggests sustainability, but TZS depreciation (9.6% against USD) increases external debt burdens.
Domestic Debt:
Stock: TZS 35.5 trillion (USD ~13.8 billion, 29.3% of total debt).
Annual Increase: +11.1% from TZS 32.0 trillion in June 2024.
Monthly Increase: +0.9% from May 2025 (~TZS 35.2 trillion, based on April 2025’s TZS 34,759.9 billion).
By Instrument:
Instrument
TZS Trillion
% Share
Treasury Bonds (long-term)
29.5
83.2%
Treasury Bills (short-term)
6.0
16.8%
Total
35.5
100%
By Creditor:
Creditor
TZS Trillion
% Share
Commercial Banks
10.2
28.6%
Pension Funds
9.3
26.1%
Bank of Tanzania
7.2
20.2%
Others (incl. individuals, corporates)
6.4
18.1%
Insurance Companies
1.8
5.2%
BoT Special Funds
0.6
1.8%
Total
35.5
100%
Context: The document confirms TZS 85.9 billion raised via bonds in June 2025, with TZS 93.96 billion spent on debt service (TZS 60.13 billion principal, TZS 33.83 billion interest, correcting the document’s typo of TZS 276.8 billion). The 11.1% annual growth reflects financing of fiscal deficits (e.g., TZS 270.2 billion in May 2025 for Mainland Tanzania). Treasury bonds’ 83.2% share aligns with a shift to long-term instruments, reducing refinancing risks.
Implications: The diversified creditor base (28.6% banks, 26.1% pension funds) and long-term bond dominance enhance stability, but high borrowing rates (15.5% lending rates) crowd out private sector credit, which weakened in Q4 2024. The document’s note on retail investor participation via TIPS (18.1% “Others”) supports financial inclusion.
External Debt:
Stock: TZS 82.4 trillion (USD 33.0 billion, 70.7% of total debt).
Annual Increase: +14.8% from TZS 71.8 trillion (USD 30.6 billion) in June 2024.
By Borrower:
Borrower
TZS Trillion
% Share
Central Government
70.3
85.4%
Private Sector
12.1
14.6%
Public Corporations
≈ 0
Negligible
Total
82.4
100%
By Use of Funds:
Sector
% Share
Transport & Telecommunication
25.4%
Social Welfare & Education
21.3%
Energy & Mining
16.4%
Budget Support
15.2%
Agriculture
6.5%
Finance & Insurance
5.1%
Industry
4.0%
Others
6.1%
By Currency:
Currency
% Share
USD
67.6%
EUR
17.2%
JPY
4.9%
CNY
3.4%
SDR
3.0%
Others
3.9%
Context: The document’s tables (e.g., Table 2.2, 2.3, 2.4) confirm the external debt stock and composition, with USD 109.9 million disbursed in April 2025 for projects like SGR and TAZARA Railway (25.4% transport). The 14.8% increase reflects concessional loans (e.g., IMF’s USD 441 million ECF/RSF, World Bank’s USD 527 million) and non-concessional borrowing (34% of external debt). The 67.6% USD share amplifies risks from the 9.6% TZS depreciation.
Implications: The central government’s 85.4% share aligns debt with development priorities (e.g., Vision 2050), but low industry (4%) and agriculture (6.5%) allocations limit structural transformation. High USD exposure increases servicing costs (USD 80.9 million in April 2025), with external debt service at ~2.89% of GNI in 2023.
Debt Servicing:
Domestic: TZS 93.96 billion in June 2025 (TZS 60.13 billion principal, TZS 33.83 billion interest), per the document. Annual servicing was TZS 890.9 billion in February 2025 (TZS 609.9 billion principal, TZS 281 billion interest).
External: USD 80.9 million in April 2025, with annual estimates of USD 1–2 billion, driven by USD-denominated debt (67.6%) and TZS depreciation.
Context: Servicing absorbs ~40% of government expenditures, per IMF, straining fiscal space. Concessional loans (e.g., World Bank, 48% of external debt) mitigate costs, but non-concessional borrowing raises concerns.
Implications: High servicing costs limit development spending (33.7% of Zanzibar’s budget), necessitating revenue mobilization (TZS 2,689.2 billion in May 2025, 3.1% above target) and export growth.
Tanzania Shilling (TZS) Sustainability
The TZS’s sustainability is assessed through its exchange rate stability, depreciation trends, and impact on debt servicing, drawing from the provided data and document’s external sector insights (e.g., Charts 2.7.1–2.7.3, Table 2.7.1).
Exchange Rate Performance:
USD/TZS (IFEM):
June 2024: 2,345.38
May 2025: 2,565.08
June 2025: 2,569.46
Annual Depreciation: -9.6%
Monthly Change: -0.2% (May to June 2025)
Bureau de Change:
Buying Rate: 2,574.33 TZS/USD
Selling Rate: 2,582.67 TZS/USD
Other Currencies:
Currency
TZS per Unit (June 2025)
% Change (Y-o-Y)
EUR
2,763.91
-10.4%
GBP
3,248.65
-9.7%
JPY (100 units)
1,617.18
-10.3%
CNY
353.77
-10.2%
Context: The document notes improved IFEM liquidity in June 2025, driven by seasonal cash crop exports (e.g., cashew nuts, tobacco) and gold exports (USD 3,369.7 million annually). The 9.6% depreciation aligns with earlier trends (9% in 2024, 8% in 2023), but a slight 0.28% appreciation in October 2024 and 2.6% by January 2025 indicate periods of stability. The BoT’s USD 7 million intervention in January 2025 and reserves of USD 5,307.7 million (4.3 months of import cover) support orderly markets.
Drivers:
Import Demand: Goods imports rose to USD 459.5 million in Zanzibar and USD 13,040.7 million for Tanzania (Table A7), driven by capital goods (e.g., SGR, hydropower).
Export Shortfalls: Zanzibar’s exports fell to USD 150.3 million (-11.9%), with cloves down 27.2%. Tanzania’s goods exports grew to USD 1,036 million (Table 2.7.1), led by gold and cereals (USD 501.3 million), but were insufficient to offset imports.
Global USD Strength: U.S. monetary tightening increased USD demand, impacting emerging market currencies like the TZS.
Implications: The 9.6% depreciation raises import and debt servicing costs, contributing to inflation (3.4% in Zanzibar, 3.2% in Mainland). The narrow Bureau spread (0.3%) and low dollarization (3.2% of Mainland businesses use USD) indicate market confidence, but sustained depreciation pressures reserves.
Forex Market Activity:
IFEM Volume: USD 65.4 million in June 2025, +12.6% from USD 58.1 million in May 2025 (document, Page 10). This reflects trade settlements and seasonal imports, compared to USD 95.7 million in December 2024.
Reserves: USD 5,307.7 million (Chart 2.7.1), covering 4.3 months of imports, down slightly from USD 5,323.6 million in January 2025 but sufficient per IMF’s 4-month threshold.
Implications: Increased IFEM activity signals robust demand, but reserves and BoT interventions (e.g., USD sales) ensure stability. Service receipts (USD 7,104 million, driven by tourism’s 10% arrival increase to 2,333,322) bolster forex inflows.
TZS Sustainability:
Stability: The TZS’s “orderly and market-driven” performance (document, Page 10) and minimal monthly depreciation (-0.2%) indicate short-term stability, supported by reserves and interventions.
Risks: The 9.6% annual depreciation and high USD debt exposure (67.6%) increase servicing costs, with external debt service at USD 1–2 billion annually. Import reliance (USD 13,040.7 million) and export volatility (e.g., cloves) strain reserves.
Mitigating Factors: Tourism receipts (USD 7,104 million), FDI (USD 3.7 billion), and concessional financing (e.g., IMF’s USD 441 million) support forex inflows. The BoT’s 6% Central Bank Rate (Page 7) controls inflation (3%–5% target), stabilizing the TZS.
Implications: The TZS is sustainable in the short term, but long-term pressures from depreciation and import growth require export diversification (e.g., cereals, manufactured goods) and reserve accumulation.
~40% of government expenditures; USD 80.9 million in April 2025
USD/TZS Exchange Rate
2,569.46
-9.6% depreciation from June 2024; -0.2% from May 2025
Foreign Exchange Reserves
USD 5,307.7 million
4.3 months of import cover; supports TZS stability
Current Account Deficit
USD 2,117.6 million (est.)
Driven by goods imports (USD 13,040.7 million) vs. exports (USD 1,036 million)
Service Receipts
USD 7,104 million
+9.2% from USD 6,577 million; driven by tourism (2.3 million arrivals)
Key Insights and Policy Implications
Debt Sustainability:
Status: The TZS 116.6 trillion debt (44.3% of GDP) is sustainable per the IMF’s DSA (below 55% benchmark), with moderate distress risk. External debt’s 70.7% share and 14.8% growth support infrastructure (25.4% transport) but increase servicing costs (USD 1–2 billion annually).
Policy: Prioritize concessional financing (e.g., World Bank’s USD 527 million) and revenue mobilization (TZS 2,339.2 billion tax revenue in May 2025, 4.1% above target) to reduce non-concessional borrowing (34% of external debt).
TZS Sustainability:
Status: The 9.6% depreciation and stable monthly performance (-0.2%) indicate short-term TZS stability, supported by reserves (USD 5,307.7 million) and tourism receipts (USD 7,104 million). However, import reliance and USD debt exposure pose long-term risks.
Policy: Boost exports (e.g., cereals, USD 501.3 million; manufactured goods) via AfCFTA and diversify debt currencies to mitigate USD risks (67.6% share).
Debt-TZS Nexus:
Impact: TZS depreciation increases external debt servicing costs, with USD 22.3 billion (67.6%) in USD-denominated debt. This contributes to inflation (3.4% in Zanzibar) and fiscal pressure.
Policy: Strengthen reserves through FDI (USD 3.7 billion) and tourism (2.3 million arrivals) to stabilize the TZS and reduce servicing costs.
Economic Context:
Growth: 5.6% GDP growth in 2024 and 6% projected for 2025 support debt absorption, driven by tourism and infrastructure.
Risks: TZS depreciation, global USD strength, and export volatility (e.g., cloves -27.2%) threaten sustainability. Climate shocks and election uncertainties (October 2025) add risks.
Opportunities: Vision 2050, MKUMBI II reforms, and digital financial inclusion (TIPS, 453.7 million transactions) enhance fiscal and TZS resilience.
Critical Examination of the Establishment Narrative
Debt Optimism: The BoT and IMF emphasize sustainability (35% debt-to-GDP), but the 13.5% debt increase and 9.6% TZS depreciation raise servicing concerns, especially with USD debt (67.6%). The IMF’s moderate risk rating may understate long-term vulnerabilities if exports (e.g., cloves) or tourism falter.
TZS Stability: The BoT’s “orderly market” narrative (Page 10) is supported by reserves and interventions, but high import demand (USD 13,040.7 million) and global USD strength challenge long-term TZS sustainability. X posts on regional debt (e.g., Kenya’s unsustainable levels) suggest broader risks.
Crowding Out: The narrative overlooks domestic borrowing’s crowding-out effect (15.5% lending rates), limiting private sector credit (12.8% growth in January 2025) and Vision 2050’s private sector-led goals.