Implications for Economic Growth in 2023
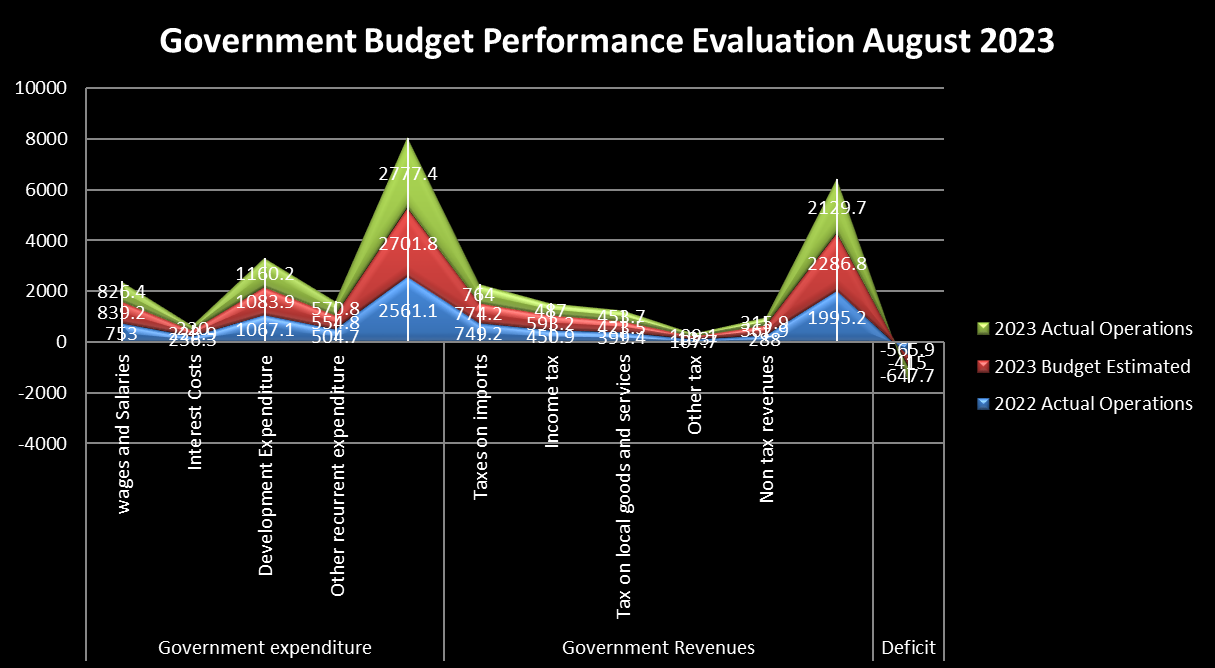
In the Government Budget Performance Evaluation for August 2023, there is a comparison of financial data between 2022 and 2023, with a specific focus on actual operations, the budget, and estimated figures.
The Government Budget Performance Evaluation for August 2023 indicates several notable trends. Government expenditure exceeded the budget primarily due to higher development expenditure, while revenue collection fell short of expectations. The widening deficit is a concerning aspect of this evaluation, as it signifies a substantial increase in the government's financial shortfall, which may necessitate further examination and potential adjustments to financial planning and fiscal policies.
Government Expenditure:
Government Revenues:
Deficit:
The budget deficit is the difference between government expenditure and revenue. In 2023, the government faced a deficit of -647.7 units, which represents a 56% increase from the budgeted deficit of -415 units. This significant increase in the deficit raises concerns about the government's fiscal management.
While there are positive signs such as increased development expenditure, the Government of Tanzania faces challenges in terms of revenue collection and budget deficit management. To promote economic growth, the government may need to address these challenges by improving tax collection, managing deficits effectively, and exploring alternative revenue sources. Additionally, a focus on ensuring that development expenditure is directed toward projects that contribute directly to economic growth could be a key strategy for the future:
Expenditure Prioritization:
The government increased its development expenditure in 2023 by 7% compared to the budget estimate. This indicates a commitment to investing in infrastructure, public projects, and economic development, which can be seen as a positive step toward fostering economic growth. Development expenditure often contributes to job creation and improvements in productivity, which can stimulate economic growth.
Revenue Shortfall:
The government's revenue collection fell short of the budgeted amount in 2023, with a 7% deficit. This shortfall might limit the government's ability to fund projects and services that are crucial for economic growth, such as education, healthcare, and infrastructure development. The revenue underperformance could indicate challenges in tax collection or a need for more efficient revenue generation strategies.
Deficit Increase:
The substantial increase in the budget deficit (56%) is concerning. A widening deficit may result in increased government borrowing, which can have adverse consequences for economic growth if not managed properly. It might lead to higher debt service costs and crowd out other essential public investments, potentially hindering economic growth prospects.
Taxation Challenges:
The data indicates a significant decline in income tax revenue and other tax revenues (18% and 18%, respectively) in 2023. This may suggest challenges in tax collection or economic conditions affecting individuals' income. A reduction in income tax revenue could be indicative of economic struggles for citizens, which can impact economic growth negatively.
Non-Tax Revenues:
The decrease in non-tax revenues (13%) is another area of concern. This suggests that the government's non-tax revenue sources, which could include fees, fines, and other non-tax income, have decreased. This might be due to economic conditions affecting these revenue streams, which can, in turn, impact the government's ability to invest in economic growth initiatives.
Debts development
Tanzania's National Debt Trends: Examining External and Domestic Debt Dynamics
August 2023, the national debt of this country amounted to USD 40,574.6 million. This debt includes both public and private external debt. The reduction in debt is primarily due to exchange rate fluctuations, particularly the appreciation of the US dollar in comparison to other currencies, and a substantial part of the debt is external in nature, indicating a significant reliance on foreign borrowing.
National Debt Stock:
The national debt stock refers to the total amount of debt that a country owes. This includes various types of debt, such as public debt (both domestic and external) and private external debt. In this case, the national debt stock was USD 40,574.6 million as of the end of August 2023.
Decrease in Debt:
There was a decrease in the national debt stock by USD 728.1 million in comparison to the previous month. This reduction in debt is primarily attributed to exchange rate fluctuations. Exchange rate fluctuations can impact the value of a country's debt when it is denominated in foreign currencies. In this case, it's stated that the appreciation of the US dollar (USD) against other currencies contributed to the decrease in the debt.
Composition of Debt:
The national debt stock is composed of both public and private external debt. Public debt is typically incurred by the government, and it can be further divided into domestic (owed to domestic creditors) and external (owed to foreign creditors) components. In this situation, external debt constituted 70.5 percent of the overall debt. This means that a significant portion of the country's debt is owed to foreign creditors.
This research provides insights into the changes in a country's national debt over a specific time period. It shows that external debt decreased by 3% in a month but increased by 4% over the year. On the other hand, domestic debt increased by 3% in a month and 16% over the year. The total national debt decreased by 1% in a month but increased by 7% over the year. These numbers reflect the dynamics of the country's external and domestic borrowing and provide valuable information for assessing its fiscal health and economic trends.
The data pertains to the development of a country's national debt as of August 21, July 2023, and August 2023. It includes information about both external debt, domestic debt, and the total debts, along with changes over one month and one year:
External Debt:
Domestic Debt:
Total Debts:
The changes in Tanzania's national debt, both external and domestic, over a specific time period with a complete picture of Tanzania's economic growth.
Debt Composition:
The data shows that both external and domestic debts have increased over the past year. External debt increased by 4%, while domestic debt increased by a substantial 16%. The composition of debt is essential, as it can have different implications for economic growth. High external debt can lead to foreign exchange risks, while high domestic debt can increase the government's interest payment burden.
Total Debt Dynamics:
The total national debt increased by 7% over the past year. An increase in the total debt can be a concern if it outpaces the country's economic growth. It can indicate that the government is borrowing more, which might be used for investments in infrastructure, social programs, or other areas. However, it can also indicate fiscal challenges if the borrowed funds are not used efficiently or if the economy doesn't grow at a rate that can sustain the debt burden.
Short-Term Changes:
The one-month changes in debt levels are relatively small, with a 3% decrease in external debt and a 3% increase in domestic debt. Short-term fluctuations in debt levels can be influenced by various factors, including government policies, borrowing for specific projects, or repayment schedules.
Sustainability:
What's critical in assessing the economic impact of growing national debt is its sustainability. A steadily increasing debt burden can become unsustainable if the country's economic growth doesn't keep pace, leading to fiscal challenges and potential debt crises.

Falling Behind in Africa
The Tanzanian diaspora still does not significantly contribute to the economic growth of Tanzania. Notably, Tanzania is not among the top 10 African countries with the highest inflow of remittances from its diaspora.
Tanzania is home to a diaspora population of 1.5 million, yet their remittances only amount to 2.5 trillion shillings.
Tanzanian diaspora, consisting of 1.5 million individuals, is not making a substantial contribution to the economic growth of Tanzania. This is evident from the fact that Tanzania does not rank among the top 10 African countries with the highest diaspora remittance inflow. In 2022, the total remittance inflow from the Tanzanian diaspora was 2.5 trillion shillings.
This situation highlights that the economic impact of the Tanzanian diaspora on their home country is limited in comparison to other African nations. Many other countries on the continent receive a significantly higher amount of remittances from their diaspora populations, which can play a crucial role in boosting their economies.
The World Bank, in its "Migration and Development Brief," disclosed that Egypt stood as the primary recipient of remittances in the African region, totaling $28.3 billion in 2022. However, this marked a 10 percent decrease from the record high of $31.5 billion in 2021.
Here is a list of the top 10 African countries with the highest diaspora remittance inflow, according to the World Bank: Rank Country Amount ($billion) 1 Egypt, Arab Republic 28.3 billion 2 Nigeria 20.1 billion 3 Morocco 11.2 billion 4 Ghana 4.7 billion 5 Kenya 4.1 billion 6 Tunisia 3.1 billion 7 Zimbabwe 3.1 billion 8 Senegal 2.5 billion 9 Algeria 1.8 billion 10 Congo, Democratic Republic 1.7 billion.
In Sub-Saharan Africa, remittances reached $53 billion in 2022, reflecting a 6.1 percent increase from the previous year, following a robust growth of 16.3 percent in 2021.
Throughout history, migration has been a widespread phenomenon. People have journeyed across the world for various reasons, with a substantial portion of these migrations driven by economic motives.
As the African diaspora continues to expand, particularly in the era of globalization and increased opportunities abroad, the remittances sent back to the continent have surged in magnitude. These are not trifling sums; they represent a significant transformation in Africa's economic stability and growth.
According to the World Bank, in the post-COVID era, remittances have gained even greater importance as a source of external financing for countries worldwide. They have proven to be resilient, and in 2022, remittance flows to low- and middle-income countries increased by 8 percent, reaching $647 billion.
Projections indicate that remittance flows to the region will rise by 1.3 percent in 2023 and by 3.7 percent in 2024.
There is potential for the Tanzanian diaspora to play a more substantial role in contributing to Tanzania's economic growth, as seen in countries like Egypt, Nigeria, and others where remittance inflows are much higher. Encouraging more remittances and investment from the Tanzanian diaspora could be a strategy to promote economic development and stability in Tanzania.
Here are the top 10 African countries with the highest diaspora remittance inflow according to the World Bank:
| Rank | Country | Amount ($billion) |
| 1 | Egypt. Arab Rep | 28.3 billion |
| 2 | Nigeria | 20.1 billion |
| 3 | Morocco | 11.2 billion |
| 4 | Ghana | 4.7 billion |
| 5 | Kenya | 4.1 billion |
| 6 | Tunisia | 3.1 billion |
| 7 | Zimbabwe | 3.1 billion |
| 8 | Senegal | 2.5 billion |
| 9 | Algeria | 1.8 billion |
| 10 | Congo, Dem. Rep. | 1.7 billion |
September 2023 Records Stable 3.3% Rate Despite Price Index Increase
The inflation rates for Tanzania over a period of time, including historical trends and forecasts:
Historical Inflation Rates (2022):
Inflation rates are typically expressed as a percentage and represent the rate at which the general price level of goods and services rises, leading to a decrease in purchasing power. In this case, Tanzania experienced relatively moderate inflation rates in late 2022.
Inflation Rates (2023):
From January to September 2023, Tanzania experienced a declining trend in inflation rates. This means that the general price level of goods and services increased at a slower rate during this period.
Inflation Rate Forecast (2023):
The forecasted inflation rates for the last three months of 2023 show a continued decrease in the rate of price increase, indicating relative price stability or a decrease in inflationary pressures.
Inflation rates can have significant economic implications, affecting consumer purchasing power, interest rates, and overall economic stability. Low and stable inflation rates are generally considered desirable by central banks and policymakers, as they contribute to a more stable economic environment.
The annual headline inflation rate for September 2023 in Tanzania and the comparison with the previous month, August 2023, and the previous year, September 2022:
Annual Headline Inflation Rate for September, 2023:
Overall Index Increase:
The key takeaway from this information is that while the headline inflation rate in Tanzania remained stable at 3.3% between August and September 2023, the overall price level in the economy increased over the course of a year, indicating that prices of goods and services, on average, were higher in September 2023 compared to September 2022.
These figures provide a comprehensive view of how inflation has affected various categories of goods and services in Tanzania over both short-term and long-term periods.
The inflation rates in Tanzania for various categories or main groups, showing both the 1-month change and the 12-month change:
Food and Non-Alcoholic Beverages:
This category represents the inflation rates for essential food items and non-alcoholic beverages. Over the past month, there was a 0.3% increase in prices, and over the past year, prices in this category have risen by 5.6%.
Alcoholic Beverages and Tobacco:
This category covers the inflation rates for alcoholic beverages and tobacco products. There was no change in prices over the past month, but over the past year, prices have increased by 3.7%.
Clothing and Footwear:
This category represents the inflation rates for clothing and footwear. Prices decreased by 0.1% over the past month, but over the past year, prices have increased by 3.0%.
Housing, Water, Electricity, Gas, and Other Fuels, Furnishings, Household Equipment, and Routine:
This category encompasses various expenses related to housing and household items. Over the past month, there was a significant decrease of 0.4%, but over the past year, prices have increased by 1.3%.
Household Maintenance:
Household maintenance costs decreased by 0.1% over the past month, but over the past year, they have increased by 3.9%.
Health:
Health-related expenses remained stable over the past month, and over the past year, prices in this category have increased by 1.7%.
Transport:
Transportation costs increased by 0.2% over the past month, while over the past year, prices have increased by 1.0%.
Information and Communication:
Prices for information and communication services increased by 0.3% over the past month, and over the past year, they have increased by 1.7%.
Education Services:
Education services saw a 0.2% price increase over the past month, and over the past year, prices have increased by 3.5%.
Insurance and Financial Services:
Prices for insurance and financial services decreased by 0.1% over the past month, and over the past year, there was a minimal increase of 0.1%.
Overall Inflation Rate:
The overall inflation rate for Tanzania increased by 0.1% over the past month, and over the past year, it has risen by 3.3%.
Focuses on inflation rates and Tanzania's economic growth:
Stable Inflation Rates:
The fact that the annual headline inflation rate remained stable at 3.3% from August to September 2023 suggests that, at least in the short term, there wasn't a sudden surge in inflation that could erode consumers' purchasing power. Price stability is generally considered favorable for economic growth as it provides a predictable environment for businesses and consumers.
Increase in Overall Index:
The data does indicate an increase in the overall index of prices from September 2022 to September 2023. While this is not a direct measure of economic growth, it does show that prices for goods and services have, on average, risen over the past year. This could be influenced by various factors, including increased demand, supply chain disruptions, or changes in commodity prices.
Steady Inflation Management:
The Tanzanian government and central bank may have been effective in managing inflation to keep it stable. Effective inflation management is typically seen as conducive to a healthy economic environment and can support economic growth.
| Tanzania Inflation Rates | |||
| Years | Months | Inflation Rates | |
| Trends | 2022 | September | 4.8 |
| October | 4.9 | ||
| November | 4.9 | ||
| December | 4.8 | ||
| 2023 | January | 4.9 | |
| February | 4.8 | ||
| March | 4.7 | ||
| April | 4.3 | ||
| May | 4 | ||
| June | 3.6 | ||
| July | 3.3 | ||
| August | 3.3 | ||
| September | 3.3 | ||
| Forecast | 2023 | October | 3.2 |
| November | 3.1 | ||
| December | 3 | ||
A Gateway for International Arrivals
This research provided data pertains to international tourism arrivals in August 2023 and the cumulative figures for the period of January to August 2023 in a region:
In January, with a remarkable 55.5% increase in arrivals, suggesting a strong start to the tourism season. February seeing a 42.5% increase and March with a 25.9% increase. However, the rate of growth tapered off slightly in subsequent months, with April and May showing more moderate increases of 22% and 19.3%, respectively. June saw a resurgence in growth at 25.2%, but July recorded a comparatively lower growth rate of 11.5%. August rounded off the period with a notable 17.7% increase in arrivals, indicating a positive trend in the summer season. These fluctuations in monthly percentage changes provide insights into the seasonal variations and overall performance of the tourism sector in this specific location or region during the first eight months of 2023.
| International Arrivals for the Period of January to August 2023 | |
| Months | Monthly Percentage Changes(%) |
| January | 55.5 |
| February | 42.5 |
| March | 25.9 |
| April | 22 |
| May | 19.3 |
| June | 25.2 |
| July | 11.5 |
| August | 17.7 |
International Arrivals in August 2023:
International Arrivals for the Period of January to August 2023:
International Arrivals from Outside Africa:
International Arrivals from Africa:
The performance of the tourism sector in Tanzania and its potential impact on economic growth:
Increasing International Arrivals:
Cumulative Growth for the Year:
Arrivals from Outside Africa:
Arrivals from African Countries:
Arrivals through Zanzibar:
The implications of the tourism sector's impact on economic growth in Tanzania:
Surging Visitor Numbers and Earnings
This research provided pertains to the visitor statistics and earnings for national parks during the years 2020 to 2025, with a focus on the 2022/23 period.
A positive trend in tourism for the national parks, driven by government initiatives and a recovering global economy, with the Northern zone playing a significant role in both visitor numbers and earnings.
The projections suggest continued growth in the coming years.
2022/23 Visitor and Earnings Increase:
Factors Driving the Increase:
The increase in both visitor numbers and earnings is attributed to several factors, including:
Dominance of Northern Zone:
The Northern zone of the national parks continued to dominate in terms of both the number of visitors and earnings.
Historical and Forecasted Data:
2023 Provisional Data:
Future Projections:
The research information provided indicates that the tourism economic sector in Tanzania is performing well and is poised for continued growth. This sector's success is driven by a combination of government initiatives, global economic factors, and the appeal of Tanzania as a tourist destination, particularly in its Northern zone.
However, it's important for Tanzania to sustain these positive trends through effective management, infrastructure development, and marketing efforts to maximize the sector's long-term economic benefits.
The tourism sector in Tanzania experienced significant growth and positive performance during the 2022/23 fiscal year and is expected to continue this trend in the near future:
Strong Growth in Visitor Numbers:
The fact that the number of visitors to national parks increased by 17.9 percent in 2022/23 compared to the previous year indicates a robust growth in tourism. This suggests that Tanzania's appeal as a tourist destination has been growing, possibly due to various factors such as government promotions and international interest.
Substantial Increase in Earnings:
The 43.4 percent increase in earnings from various sources within the national parks, including entry fees, concessions, and camping fees, is a clear indicator of the economic success of the tourism sector. This growth in earnings signifies that tourism is contributing significantly to the country's economy.
Diverse Revenue Streams:
The breakdown of earnings into multiple revenue streams, such as entry fees, concessions, and camping fees, indicates a diversified income base for the tourism sector. This diversification can help make the sector more resilient to external shocks.
Global Economic Recovery Impact:
The mention of the recovery of the world economy from the effects of the COVID-19 pandemic suggests that the global situation has positively impacted Tanzania's tourism sector. As global economic conditions improve, people are more likely to travel, leading to an increase in tourism.
Regional Dominance:
The dominance of the Northern zone in terms of both visitor numbers (65 percent) and earnings (58.7 percent) indicates that this region is a major contributor to the tourism sector's success. This data can help the government and tourism authorities focus their efforts and investments strategically.
Positive Forecasts:
The data includes optimistic forecasts for the future, with projected increases in both visitor numbers and earnings for the years 2023, 2024, and 2025. This suggests that the Tanzanian tourism sector is expected to continue its growth trajectory.
| Years | Number of Visitors | Earnings (Millions, Tsh) | |
| Trends | 2020 | 831,050 | 56,262.00 |
| 2021 | 815,740 | 108,078.00 | |
| 2022 | 1,869,980 | 323,202.00 | |
| 2023P | 2,204,048 | 463,345.00 | |
| Forecast | 2023 | 2,251,260 | 435,572.69 |
| 2024 | 2,728,317 | 562,567.61 | |
| 2025 | 3,205,375 | 689,562.53 | |
| 2023P=Provisional Data | |||
A 2022/23 Analysis
This research provided data and information pertain to the average retail prices of petroleum products in different zones during the 2022/2023 period. Here are the key details and insights:
Price Trends Across Zones:
Year-over-Year Price Increase:
The text mentions that the average retail prices across all zones were higher than in the preceding year, indicating an increase in fuel prices from the previous year (2021/22).
On an annual basis, there were significant price increases:
These substantial year-over-year increases indicate a significant cost burden on consumers and businesses using these petroleum products.
Peak Prices in August 2022:
Factors Driving Price Increases:
The sustained rise in domestic fuel prices is attributed to several factors:
Price Slowing Down in the Second Half:
Geographical Variation:
On average retail prices of petroleum products across different zones, directly zonal social and economic growth within the region:
Economic Impact of Fuel Prices:
Variation Across Zones:
Factors Driving Price Increases:
Impact on Consumer Spending:
| Average Fuel Pump Prices, 2022/2023 | |||
| Petrol | Diesel | Kerosene | |
| Central | 12.2 | 23 | 30.4 |
| Dar Es Salaam | 15 | 25 | 32.8 |
| Lake | 12.1 | 21.9 | 33.1 |
| Northern | 13.6 | 23.7 | 38.9 |
| Southern Eastern | 14 | 24.2 | 40.8 |
| Southern Highlands | 12.5 | 22.8 | 27.7 |
Tanzania's Regional Economic Dynamics: Insights from Bank Deposits and Loans
This research data provides insights into the growth of bank deposits and loans in Tanzania and the distribution of these financial activities across different geographic zones in the country for the specified year. It reflects economic trends, banking policies, and regional variations in financial activities.
The provided data is related to bank deposits and loans in Tanzania for the year 2022/2023, with a breakdown by geographic zones. Here are more details on the data:
Bank Deposits:
Total bank deposits increased by 17.7 percent to TZS 31,147.2 billion.
The increase in bank deposits can be attributed to several factors, including:
The largest share of these deposits, 61.7 percent, came from the Dar es Salaam zone. This suggests that the economic activities and banking services in Dar es Salaam had a significant impact on the overall increase in bank deposits.
Bank Loans:
Bank loans to various economic activities amounted to TZS 25,794.5 billion, an increase from TZS 21,158.9 billion in the previous year (2021/22).
The increase in bank loans can be attributed to various factors, including:
The distribution of outstanding loans by purpose is as follows:
Breakdown by Geographic Zones:
Tanzania Bank deposits and loans can offer some insights into the social and economic growth across different geographic zones in Tanzania:
1. Regional Disparities in Economic Activity:
2. Access to Banking Services:
3. Economic Recovery:
4. Regional Variations in Economic Growth:
5. Potential Areas for Policy Focus:
| Financial Sector Development, 2022/2023 | |
| Bank Deposits | Bank Loans |
Dar Es Salaam | 18.8 | 38.6 |
Northern | 26.2 | 20.1 |
Central | 21.6 | 23.1 |
Southern Highlands | 1.1 | 26 |
Lake | 9.6 | 16.1 |
Southern Eastern | 10.7 | 7.9 |
Tanzania's Zonal Trade Dynamics: 2022/23 Overview
The trade surplus decreased in most zones, except for the Southern Highlands zone, due to various factors such as changes in exports and imports of different products.
This research provided data and information pertain to the trade balance of a particular region or country for the fiscal year 2022/23, with a focus on trade with neighboring countries:
Trade Balance in 2022/23: The trade balance with neighboring countries for the fiscal year 2022/23 was a surplus of TZS (Tanzanian Shillings) 6,018.5 billion.
Change Compared to Previous Year: This surplus is lower by 10.1 percent when compared to the surplus registered in the preceding year (presumably 2021/22).
Trade Surplus by Zones: The data also provides information about how the trade surplus changed in different geographic zones. Here's a breakdown of that information:
Policies and external factors (global economic conditions, trade agreements, etc.) can significantly influence trade balances, and a more in-depth analysis would be needed to fully understand the reasons behind the trends observed in each zone.
This research provided data and information about the trade balance in different zones for the fiscal year 2022/23 can offer some insights into the social and economic growth of these zones:
Economic Activity and Development:
Challenges in the Northern Zone:
South Eastern Zone's Economic Challenges:
Trade Composition:
Social Implications:
Zonal Inflation Trends in 2022/23: A Snapshot of Economic Conditions
In the 2022/23 fiscal year, inflation rates in various zones remained within the annual national target of 5.4 percent, but there were differences in inflation rates among the zones. Here are more details on the inflation trends in each of the mentioned zones.
While all zones managed to stay within the annual national inflation target of 5.4%, there were variations in inflation rates. These variations were primarily driven by changes in food prices and transportation costs, particularly in response to increases in fuel prices. The Lake Zone stood out with a slower inflation rate due to lower non-food item prices, while the Southern Eastern Zone had the lowest inflation rate among the zones.
Central Zone (Inflation Rate: 5%):
Dar Es Salaam (Inflation Rate: 4%):
Lake Zone (Inflation Rate: 5%):
Northern Zone (Inflation Rate: 4.5%):
Southern Eastern Zone (Inflation Rate: 3.8%):
Southern Highlands Zone (Inflation Rate: 5%):
This research provided data on zonal inflation rates for the 2022/23 fiscal year provides some insights into the social and economic growth or conditions within these zones:
Diverse Economic Conditions:
The variation in inflation rates among the different zones indicates that economic conditions and growth prospects may differ across the regions. Zones with lower inflation rates, such as the Southern Eastern Zone, may be experiencing more stable economic conditions or lower cost pressures, which can be indicative of better economic growth prospects.
Influence of Food Prices:
The mention of rising food prices as a key driver of inflation suggests that food security and agricultural productivity may be important factors in these zones' economic growth. Higher food prices can strain household budgets and affect the overall cost of living, potentially impacting the well-being of residents.
Impact of Fuel Prices:
The connection between transportation costs and fuel prices highlights the role of energy costs in the zonal economies. Higher transportation costs can affect the prices of goods and services, as well as the ease of doing business within a region. It may also be indicative of the infrastructure and energy supply situation within each zone.
Regional Economic Activities:
The data does not provide a detailed breakdown of the causes of inflation, but it's possible that zones with higher inflation rates are experiencing increased economic activity and demand, leading to price pressures. Conversely, zones with lower inflation rates may have slower economic growth or more stable economic conditions.
Regional Disparities:
The fact that the Lake Zone experienced a slowdown in inflation due to lower non-food item prices suggests that economic conditions in this zone may be different from the others. It could be an indication of regional disparities in economic growth and development, with potential implications for income distribution and living standards.
Potential Policy Implications:
Government policies, such as subsidies or economic development initiatives, may also play a role in influencing inflation rates. The data may suggest areas where targeted policies could be implemented to address specific economic challenges in each zone.