
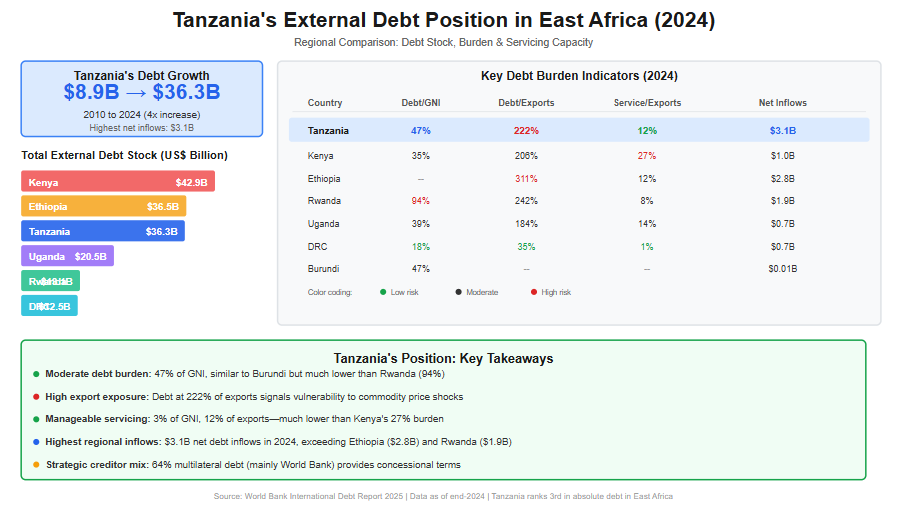
Over the past decade, Tanzania’s external debt has expanded rapidly, reflecting both the country’s ambitious development agenda and growing reliance on external financing to bridge fiscal and infrastructure gaps. According to the International Debt Report 2025, Tanzania’s total external debt stock increased more than fourfold—from US$8.9 billion in 2010 to US$36.3 billion by end-2024. This sharp rise underscores the scale of public investment undertaken during this period, particularly in transport infrastructure, energy, and social sectors, but it also raises important questions regarding debt sustainability and regional competitiveness.
In East Africa, Tanzania currently ranks among the top three most indebted countries in absolute terms, alongside Kenya and Ethiopia. By end-2024, Kenya recorded the highest external debt stock at US$42.9 billion, followed by Ethiopia (US$36.5 billion) and Tanzania (US$36.3 billion). While Tanzania’s debt level is lower than Kenya’s, it is significantly higher than that of Uganda (US$20.5 billion), Rwanda (US$13.1 billion), and the Democratic Republic of Congo (US$12.5 billion). This positioning places Tanzania as a major regional borrower, reflecting the relative size of its economy and its sustained access to concessional and semi-concessional financing.
From a debt burden perspective, Tanzania’s external debt stood at 47% of Gross National Income (GNI) in 2024—moderate by regional standards. This ratio is similar to Burundi (47%) but substantially lower than Rwanda’s 94%, indicating comparatively lower vulnerability than some peers. However, when measured against export earnings, Tanzania’s external debt reached 222% of exports, signaling a high exposure to external shocks, especially fluctuations in commodity prices and global demand. This ratio is higher than Uganda’s (184%) and Kenya’s (206%), though still below Ethiopia’s elevated level of 311%.
Debt servicing pressures in Tanzania remain relatively manageable compared to other East African economies. In 2024, debt service payments accounted for 3% of GNI and 12% of export earnings, significantly lower than Kenya, where debt service absorbed 27% of exports, and comparable to Rwanda’s levels. This reflects Tanzania’s continued reliance on multilateral creditors, which account for approximately 64% of public and publicly guaranteed (PPG) external debt, with the World Bank alone representing nearly half of total PPG debt. Such creditor composition has helped moderate repayment pressures through longer maturities and concessional terms.
Nevertheless, Tanzania recorded the highest net external debt inflows in East Africa in 2024, at US$3.1 billion, exceeding Ethiopia (US$2.8 billion) and Rwanda (US$1.9 billion). This trend highlights ongoing financing needs and signals that debt accumulation is likely to persist in the medium term. As regional peers increasingly face tightening global financial conditions, Tanzania’s future debt trajectory will depend heavily on export performance, fiscal discipline, and the productivity of debt-financed investments.
Overall, Tanzania’s external debt position reflects a delicate balance: stronger than highly indebted peers such as Rwanda and Kenya in terms of servicing capacity, yet more exposed than Uganda and DRC when viewed through export and inflow dynamics. This evolving landscape makes continuous debt monitoring, regional benchmarking, and strategic borrowing essential for safeguarding macroeconomic stability and sustaining long-term growth. Read More of This Topic: Who Is Financing Tanzania’s Public Debt in 2024—and What Does It Mean for Sustainability?
The following table summarizes Tanzania's external debt data across key years, as extracted from the International Debt Report 2025. All figures are in US$ million unless otherwise noted.
| Indicator | 2010 | 2020 | 2021 | 2022 | 2023 | 2024 |
| Total external debt stocks | 8,940 | 25,772 | 28,818 | 30,444 | 34,585 | 36,343 |
| Long-term external debt stocks | 6,904 | 22,055 | 23,589 | 24,533 | 28,271 | 30,898 |
| Public and publicly guaranteed debt from: | ||||||
| Official creditors | 5,546 | 15,355 | 15,502 | 16,308 | 18,296 | 20,005 |
| Multilateral | 4,391 | 11,243 | 11,526 | 12,615 | 14,655 | 16,435 |
| of which: World Bank | 3,248 | 8,148 | 8,290 | 9,228 | 10,989 | 12,097 |
| Bilateral | 1,155 | 4,112 | 3,975 | 3,693 | 3,641 | 3,571 |
| Private creditors | 135 | 2,209 | 3,436 | 3,244 | 4,090 | 4,272 |
| Bondholders | .. | .. | .. | .. | .. | .. |
| Commercial banks and others | 135 | 2,209 | 3,436 | 3,244 | 4,090 | 4,272 |
| Private nonguaranteed debt from: | 1,224 | 4,491 | 4,651 | 4,981 | 5,886 | 6,621 |
| Bondholders | .. | .. | .. | .. | .. | .. |
| Commercial banks and others | 1,224 | 4,491 | 4,651 | 4,981 | 5,886 | 6,621 |
| Use of IMF credit and SDR allocations | 647 | 274 | 1,357 | 1,444 | 1,760 | 2,062 |
| IMF credit | 354 | 0 | 557 | 683 | 993 | 1,316 |
| SDR allocations | 293 | 274 | 800 | 761 | 767 | 746 |
| Short-term external debt stocks | 1,389 | 3,442 | 3,872 | 4,467 | 4,554 | 3,383 |
| Disbursements, long-term | 1,361 | 1,459 | 3,049 | 3,104 | 5,200 | 4,112 |
| Public and publicly guaranteed sector | 1,145 | 1,181 | 2,865 | 2,421 | 4,030 | 3,500 |
| Private sector not guaranteed | 216 | 279 | 184 | 683 | 1,171 | 612 |
| Principal repayments, long-term | 134 | 984 | 1,142 | 1,533 | 1,547 | 1,204 |
| Public and publicly guaranteed sector | 55 | 968 | 1,118 | 1,179 | 1,282 | 1,126 |
| Private sector not guaranteed | 79 | 15 | 25 | 353 | 266 | 78 |
| Interest payments, long-term | 51 | 365 | 319 | 429 | 603 | 725 |
| Public and publicly guaranteed sector | 34 | 363 | 315 | 377 | 547 | 691 |
| Private sector not guaranteed | 17 | 2 | 4 | 52 | 56 | 34 |
The table below focuses on PPG debt in 2024, broken down by creditor type and key creditors where specified. Note that IMF credit is reported separately in the raw data but is included here as part of overall PPG (under multilateral creditors) per the report's figure, which explicitly incorporates it. The total PPG debt (including IMF credit) is approximately $25,593 million (long-term PPG $24,277 + IMF credit $1,316). Specific creditor breakdowns (e.g., China, AfDB) are derived from the report's Figure 1, which provides a visual pie chart; percentages are approximate and may reflect rounded values.
| Creditor Type | Sub-Creditor/Creditor | Amount (US$ million) | % of Total PPG (incl. IMF) |
| Multilateral (excl. IMF) | Total Multilateral (excl. IMF) | 16,435 | ~64% |
| World Bank | 12,097 | ~47% | |
| AfDB (African Development Bank) | ~3,583 (est. based on 14%) | ~14% | |
| Other Multilateral | ~4,351 (est. based on 17%) | ~17% | |
| IMF Credit | IMF | 1,316 | ~5% (reported as 6% in figure) |
| Bilateral | Total Bilateral | 3,571 | ~14% |
| China | ~2,559 (est. based on ~10%; figure label may have OCR variance) | ~10% | |
| India | ~512 (est. based on 2%) | ~2% | |
| Korea, Rep. | ~512 (est. based on 2%) | ~2% | |
| France | ~256 (est. based on 1%) | ~1% | |
| Other Bilateral | ~1,538 (est. based on 6%) | ~6% | |
| Private Creditors | Total Private | 4,272 | ~17% |
| Bondholders | .. | 0% | |
| Commercial Banks and Others | 4,272 | ~17% (incl. other commercial ~4%) | |
| Total PPG (incl. IMF) | 25,593 | **100% |
The International Debt Report 2025 provides detailed external debt statistics for low- and middle-income countries, including East African nations. Below is a comparison focusing on Tanzania and other East African countries (Burundi, Democratic Republic of the Congo (DRC), Ethiopia, Kenya, Rwanda, Somalia, and Uganda). The data is drawn from the report's country tables and snapshots. Note that some values for Ethiopia and Burundi are missing in the report (indicated as ".."), and for Somalia, I supplemented with data from the World Bank's online IDS portal as the PDF extraction for that country was incomplete. Population for Uganda is estimated based on report context (not explicitly listed in the extracted data). All figures are in US$ million unless otherwise noted.
| Country | Total External Debt Stock (US$ million) | External Debt % of GNI | External Debt % of Exports | Debt Service % of GNI | Debt Service % of Exports | Net Debt Inflows (US$ million) | GNI (US$ million) | Population (million) |
| Tanzania | 36,343 | 47 | 222 | 3 | 12 | 3,056 | 76,808 | 69 |
| Burundi | 1,024 | 47 | .. | 2 | .. | 10 | 2,173 | 14 |
| DRC | 12,485 | 18 | 35 | 1 | 1 | 651 | 68,396 | 109 |
| Ethiopia | 36,548 | .. | 311 | .. | 12 | 2,817 | .. | 132 |
| Kenya | 42,886 | 35 | 206 | 5 | 27 | 1,006 | 122,557 | 56 |
| Rwanda | 13,050 | 94 | 242 | 3 | 8 | 1,900 | 13,901 | 14 |
| Somalia | 2,837 | .. | .. | .. | .. | .. | .. | 18 |
| Uganda | 20,534 | 39 | 184 | 2 | 14 | 676 | 52,361 | 50 |
By the end of 2024, Tanzania’s external debt landscape had reached a critical juncture, reflecting a decade of accelerated borrowing to finance infrastructure, energy, and social development priorities. According to the World Bank’s International Debt Report 2025, Tanzania’s total external debt stock stood at US$36.3 billion, more than four times higher than the US$8.9 billion recorded in 2010. Within this total, Public and Publicly Guaranteed (PPG) debt accounted for approximately US$25.6 billion, underscoring the central role of government-backed borrowing in shaping the country’s fiscal position.
The structure of Tanzania’s public debt financing in 2024 is heavily tilted toward multilateral institutions, a feature that distinguishes Tanzania from several of its East African peers and has important implications for sustainability. Multilateral creditors—including the World Bank, the African Development Bank (AfDB), and the International Monetary Fund (IMF)—collectively financed about 69% of Tanzania’s PPG external debt, equivalent to roughly US$17.8 billion. The World Bank alone accounted for US$12.1 billion, representing nearly half (47%) of total PPG debt, making it Tanzania’s single largest creditor. This reliance on concessional multilateral finance has helped Tanzania maintain relatively low debt-servicing pressures, with debt service consuming only 3% of Gross National Income (GNI) and 12% of export earnings in 2024—well below Kenya’s 5% of GNI and 27% of exports.
Bilateral creditors played a secondary but strategically significant role, financing approximately 14% of PPG debt, or US$3.6 billion. Within this category, China emerged as the dominant bilateral lender, holding an estimated US$2.6 billion, equivalent to around 10% of total PPG debt. These loans are largely associated with large-scale infrastructure projects, including transport and energy investments, which have long-term growth potential but also carry execution and revenue risks. Other bilateral partners—such as India, Korea, and France—collectively accounted for smaller shares (each around 1–2%), often targeting sector-specific development initiatives.
Private creditors represented a growing but more risk-sensitive component of Tanzania’s public debt portfolio. In 2024, private creditors—primarily commercial banks and other private lenders—held approximately US$4.3 billion, or 17% of PPG debt. Notably, Tanzania had no exposure to international bondholders, unlike regional peers such as Kenya. This absence of eurobond debt has shielded Tanzania from rollover and refinancing risks during a period of elevated global interest rates, reinforcing short-term debt sustainability. However, private loans typically carry higher interest rates and shorter maturities, meaning their rising share could increase fiscal pressure if not carefully managed.
From a sustainability perspective, Tanzania’s creditor composition offers both reassurance and caution. On the one hand, the dominance of concessional multilateral financing has kept debt servicing costs manageable and supported macroeconomic stability, even as net external debt inflows reached US$3.1 billion in 2024—the highest in East Africa. On the other hand, continued reliance on external borrowing, particularly in a context where external debt equals 47% of GNI and 222% of export earnings, exposes Tanzania to exchange rate shocks and export volatility.
Ultimately, who finances Tanzania’s public debt matters as much as how much is borrowed. In 2024, Tanzania’s public debt sustainability was underpinned by favorable creditor terms rather than low debt levels. Maintaining this position will require disciplined borrowing, stronger export growth, and ensuring that debt-financed investments generate sufficient economic returns to support repayment over the medium to long term. Read More of This Topic: External Debt Stock by Borrower
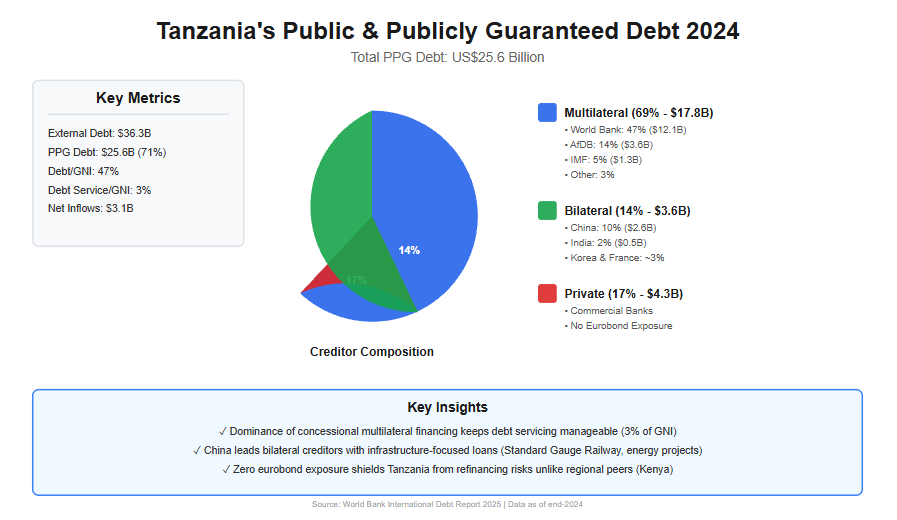
PPG debt includes loans to the public sector that are guaranteed by the government, encompassing borrowings from official creditors (multilateral and bilateral) and private sources. By the end of 2024, Tanzania's PPG debt (including IMF credit) stood at approximately US$25.6 billion, accounting for a significant portion of the country's long-term external debt. This figure reflects Tanzania's strategy of leveraging concessional financing to fund development priorities, but it also underscores vulnerabilities to global interest rate shifts and currency fluctuations.
The creditor composition reveals a heavy dependence on multilateral lenders, which provide favorable terms such as longer maturities and lower interest rates. This has helped keep debt servicing burdens manageable—at 3% of GNI and 12% of exports in 2024—compared to regional peers like Kenya (5% of GNI and 27% of exports). However, with net debt inflows reaching US$3.1 billion in 2024, the highest in East Africa, ongoing borrowing could strain future fiscal space if export growth falters.
The following table presents Tanzania's PPG debt in 2024, categorized by creditor type and key sub-creditors. Data is sourced from the International Debt Report 2025, with specific breakdowns estimated from the report's visual representations (e.g., pie charts in Figure 1). Amounts are in US$ million, and percentages are approximate, reflecting rounded values from the report. IMF credit is integrated under multilateral creditors, as per the report's methodology, contributing to the total PPG figure of US$25,593 million (derived from long-term PPG of US$24,277 million plus IMF credit of US$1,316 million).
| Creditor Type | Sub-Creditor/Creditor | Amount (US$ million) | % of Total PPG (incl. IMF) |
| Multilateral (excl. IMF) | Total Multilateral (excl. IMF) | 16,435 | ~64% |
| World Bank | 12,097 | ~47% | |
| AfDB (African Development Bank) | ~3,583 (est.) | ~14% | |
| Other Multilateral | ~4,351 (est.) | ~17% | |
| IMF Credit | IMF | 1,316 | ~5% (reported as 6% in figure) |
| Bilateral | Total Bilateral | 3,571 | ~14% |
| China | ~2,559 (est.) | ~10% | |
| India | ~512 (est.) | ~2% | |
| Korea, Rep. | ~512 (est.) | ~2% | |
| France | ~256 (est.) | ~1% | |
| Other Bilateral | ~1,538 (est.) | ~6% | |
| Private Creditors | Total Private | 4,272 | ~17% |
| Bondholders | .. | 0% | |
| Commercial Banks and Others | 4,272 | ~17% (incl. other commercial ~4%) | |
| Total PPG (incl. IMF) | 25,593 | 100% |
The dominance of multilateral creditors (around 69% including IMF) in Tanzania's PPG debt portfolio is a double-edged sword. On one hand, it ensures concessional terms that support debt sustainability; the World Bank and AfDB together account for over 60% of this category, financing projects aligned with Tanzania's National Development Vision 2025. IMF credit, at US$1,316 million, has provided balance-of-payments support, particularly post-COVID recovery.
Bilateral creditors, making up 14%, highlight strategic partnerships. China's ~10% share is notable, linked to major investments like the Standard Gauge Railway and power plants. Smaller contributions from India, Korea, and France often focus on sector-specific aid, such as agriculture and technology.
Private creditors' 17% share signals maturing financial markets but introduces risks, as these loans typically carry higher interest rates and shorter terms. With no bondholder debt reported, Tanzania has avoided eurobond exposures seen in peers like Kenya, reducing immediate refinancing pressures.
In the East African context, Tanzania's PPG composition favors stability compared to Rwanda (94% debt-to-GNI) or Ethiopia (311% debt-to-exports). However, as global conditions tighten, diversifying creditors and boosting exports (e.g., through mining and agriculture) will be crucial. The report emphasizes debt transparency and management reforms to mitigate risks.
Artificial Intelligence (AI) is rapidly transforming the global economy, reshaping production systems, labour markets, and income distribution at a scale and speed unprecedented in previous technological revolutions. According to the World Economic Forum, between 2025 and 2030 AI and related technologies are expected to displace approximately 92 million jobs globally while creating about 170 million new ones, resulting in a net gain of 78 million jobs worldwide. However, these aggregate gains mask profound distributional disparities, as job creation is heavily skewed toward advanced economies, high-skill occupations, and capital-intensive sectors, while job displacement disproportionately affects low- and middle-skilled workers, particularly in developing countries.
For Tanzania, the AI transition presents a uniquely high-risk scenario due to the country’s existing labour market structure and development constraints. As of 2025, 71.8% of Tanzania’s workforce—equivalent to approximately 26 million people—is employed in the informal sector, lacking job security, social protection, and access to structured reskilling opportunities. In addition, nearly 70% of the population depends directly or indirectly on agriculture, a sector increasingly exposed to AI-driven automation through precision farming, automated irrigation, drone surveillance, and data-driven supply chain systems. These structural characteristics significantly increase Tanzania’s vulnerability to technology-induced unemployment and income inequality.
Early evidence suggests that AI-driven labour disruption is already underway. Globally, more than 76,000 jobs had been eliminated by AI adoption by 2025, with strong empirical correlations observed between AI exposure and rising unemployment in digitized occupations. In Tanzania, initial signals are emerging in sectors such as banking, customer service, retail, and administrative services, where automation, digital platforms, and AI-enabled systems are reducing demand for clerical, entry-level, and routine jobs. Projections based on sectoral exposure indicate that between 610,000 and 1.1 million jobs could be displaced in Tanzania by 2030 if current AI adoption trends continue without adequate policy intervention.
Beyond employment losses, AI threatens to significantly widen income inequality. Tanzania already exhibits moderate inequality, with a Gini coefficient estimated between 0.38 and 0.42 in 2025, an urban–rural income ratio of approximately 3.5:1, and a formal–informal wage gap of 2.8:1. Scenario modeling suggests that, under high AI adoption without inclusive safeguards, the Gini coefficient could rise to 0.48–0.53 by 2030, while the income ratio between the richest and poorest quintiles could expand from 8:1 to as high as 12:1. Income gains from AI are likely to accrue primarily to a small, highly skilled urban elite, while low-skilled, rural, and informal workers face stagnant or declining real incomes.
These risks are compounded by Tanzania’s limited digital readiness. Only 32% of the population has internet access, 38% has reliable electricity, and less than 25% of the workforce possesses basic digital skills, creating a severe digital divide that restricts access to AI-enabled opportunities. Furthermore, Tanzania faces a critical human capital gap, with fewer than 1,000 AI specialists currently available, compared to an estimated need of 15,000–25,000 professionals by 2030. Without urgent investment in skills development, digital infrastructure, and labour market transition mechanisms, AI-driven growth is likely to reinforce existing inequalities rather than reduce them.
Against this backdrop, this study examines how AI is expected to increase unemployment and widen income inequality in Tanzania between 2025 and 2030. By integrating global evidence with Tanzania-specific labour market data, the research analyzes sectoral vulnerabilities, timelines of disruption, and distributional impacts across income groups, regions, gender, and education levels. The study aims to provide empirical insights to inform policy choices at a critical juncture, as the next five years will largely determine whether AI becomes a catalyst for inclusive development or a force that deepens economic and social divides in Tanzania.

This study demonstrates that Artificial Intelligence (AI) is poised to become one of the most consequential forces shaping Tanzania’s labour market and income distribution between 2025 and 2030. While AI offers potential productivity gains and long-term economic transformation, the evidence presented in this analysis shows that, under current structural conditions, AI is more likely to increase unemployment and widen income inequality unless deliberate and inclusive policy measures are implemented.
First, the analysis indicates that AI-driven automation will significantly raise unemployment, particularly in sectors that employ large numbers of low- and medium-skilled workers. With 71.8% of Tanzania’s workforce operating in the informal sector and nearly 70% of the population dependent on agriculture, AI adoption in administrative services, customer support, retail, manufacturing, and precision agriculture is expected to displace a substantial share of routine and entry-level jobs. Projections suggest that between 610,000 and 1.1 million jobs could be displaced by 2030, with youth, women, informal workers, and rural populations bearing the greatest burden. Given that youth unemployment already exceeds 27%, AI-related job losses risk deepening labour market exclusion and eroding Tanzania’s demographic dividend.
Second, the findings show that AI will intensify income inequality through multiple reinforcing mechanisms. AI increases the demand for high-skill labour while reducing opportunities for low-skill workers, leading to a widening skills-based wage gap. At the same time, productivity gains from AI disproportionately accrue to capital owners and highly skilled professionals, while wages for informal and low-skilled workers stagnate or decline. Scenario projections indicate that Tanzania’s Gini coefficient could rise from 0.38–0.42 in 2025 to as high as 0.48–0.53 by 2030, while the income ratio between the richest and poorest quintiles could increase from 8:1 to 12:1. Urban–rural and formal–informal wage gaps are also expected to widen sharply, reinforcing geographic and structural inequalities.
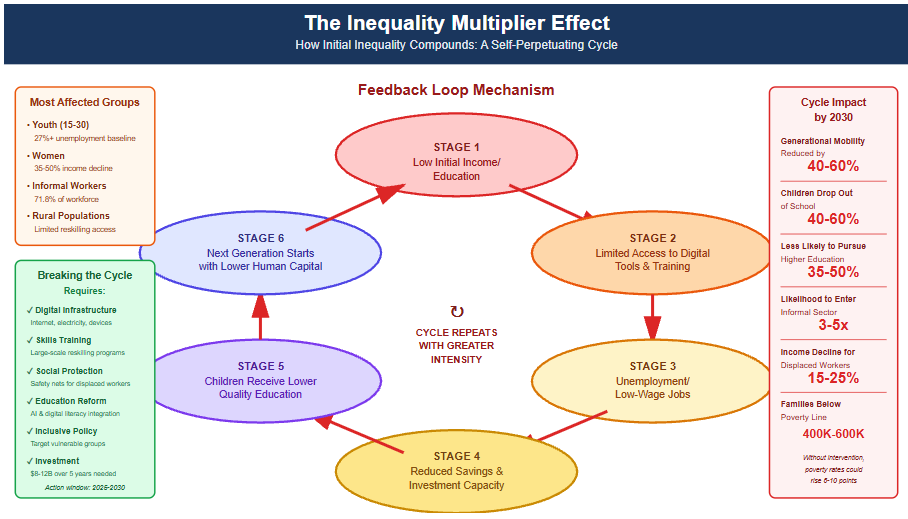
Third, the study highlights that unemployment and inequality are mutually reinforcing in the AI era. Job displacement pushes affected workers into low-pay, oversaturated informal activities, while rising inequality limits access to education, digital skills, and reskilling opportunities. This creates a self-perpetuating cycle in which vulnerable groups are increasingly excluded from emerging AI-enabled jobs, leading to intergenerational transmission of poverty and reduced social mobility. Without intervention, poverty rates could rise by 6–10 percentage points by 2030, and income concentration among the top 10% could exceed 50% of total national income.
Overall, the evidence confirms that AI is not a neutral technological force for Tanzania. Its impact on unemployment and income inequality will depend fundamentally on policy choices made in the next five years. Without timely investment in digital infrastructure, large-scale reskilling, inclusive education reform, and social protection for displaced workers, AI risks exacerbating existing labour market vulnerabilities and reversing recent development gains. Conversely, proactive and inclusive governance can mitigate job losses, narrow inequality gaps, and harness AI as a tool for shared prosperity.
In conclusion, the challenge facing Tanzania is not whether AI will transform the economy, but who benefits and who bears the costs of that transformation. The period from 2025 to 2030 represents a decisive window in which Tanzania must act to ensure that AI adoption supports employment creation, reduces inequality, and strengthens social cohesion rather than deepening unemployment and economic exclusion. Read More Of This Topic: What Will the Next Five Years Decide for Tanzania’s AI Future and Labour Market?
AI increases unemployment through four primary mechanisms:
AI systems directly replace human workers in routine, repetitive tasks across multiple sectors. In Tanzania, this particularly affects:
AI-driven efficiency gains reduce overall labor requirements even when individual jobs aren't fully automated. For example, AI-powered inventory management systems reduce the need for manual procurement staff in SMEs.
In agriculture, AI-powered precision farming, automated irrigation, and drone-based crop monitoring reduce demand for manual farm labor. Without concurrent value-chain upgrading, productivity gains translate into job losses rather than income growth.
As AI systems advance, certain skill sets become obsolete, rendering workers unemployable in their current roles without significant retraining.
| Sector | Current Employment | AI Automation Risk | Timeline | Expected Job Displacement |
| Agriculture | ~28% of workforce (70% indirectly) | Moderate-High (40-60%) | 2026-2029 | 200,000-400,000 positions |
| Customer Service & Call Centers | Growing BPO sector | Critical (70-80%) | 2024-2026 | 50,000-75,000 positions |
| Administrative & Clerical | Common across all sectors | High (60-75%) | 2025-2028 | 150,000-250,000 positions |
| Manufacturing & SMEs | 44% of informal economy | Moderate-High (40-60%) | 2026-2029 | 100,000-200,000 positions |
| Financial Services | Expanding rapidly | Moderate (30-50%) | 2027-2030 | 30,000-60,000 positions |
| Retail & Sales | Large informal component | High (50-70%) | 2025-2028 | 80,000-150,000 positions |
| Period | Phase | Key Developments | Estimated Jobs Lost |
| 2024-2025 | Initial Impact | - Basic automation in customer service - Data entry elimination - Resume screening automation - 76,440 jobs eliminated globally | 40,000-80,000 in Tanzania |
| 2025-2027 | Acceleration | - Administrative job displacement - AI chatbots expansion - Manufacturing robotics scaling - Agricultural automation begins | 200,000-350,000 |
| 2027-2030 | Transformation | - Large-scale white-collar restructuring - Transportation disruption - Healthcare AI integration - Education technology transformation | 370,000-705,000 |
AI widens income inequality through six interconnected mechanisms:
AI creates a "winner-take-all" dynamic where highly skilled workers command dramatically higher wages while low-skilled workers face wage depression or unemployment.
AI-driven automation benefits favor capital over labor, widening inequality and reducing the competitive advantage of low-cost labor.
Urban areas, with abundant educational resources and conducive innovation environments, can swiftly absorb and apply AI technology. Rural areas experience sluggish diffusion due to weak technological foundations and restricted information access.
| Dimension | Urban Areas | Rural Areas | Inequality Gap |
| Internet Access | 45-60% | 10-20% | 3:1 ratio |
| Digital Literacy | 35-50% | 5-15% | 5:1 ratio |
| Electricity Access | 70-85% | 20-40% | 3:1 ratio |
| AI-Ready Jobs | Growing | Minimal | 10:1 ratio |
| Average Income | $150-250/month | $40-80/month | 3:1 ratio |
Formal sector workers gain access to AI tools, training, and productivity enhancements, while informal workers face displacement without support systems.
AI development accelerates intelligent upgrading of industries, substantially increasing demand for high-skilled labor through enhanced educational resources and innovation environments.
| Education Level | AI Exposure Risk | Income Trajectory 2025-2030 | Employment Outlook |
| Primary or less | 70-85% displacement risk | -10% to -25% | Critical |
| Secondary | 50-65% displacement risk | -5% to +5% | High risk |
| Diploma/Vocational | 30-45% displacement risk | +10% to +20% | Moderate |
| University degree | 15-25% enhancement | +30% to +60% | Favorable |
| Advanced AI skills | Near zero risk | +100% to +300% | Excellent |
Without strong policy action, gaps in economic performance, capabilities, and governance systems can grow, reversing the long trend of narrowing development inequalities.
| Country | AI Readiness Index | Digital Infrastructure | AI Investment | Expected Outcome |
| Kenya | 6.2/10 | Moderate-High | $150M+ annually | Moderate gains |
| Rwanda | 7.1/10 | High | $200M+ annually | Significant gains |
| Nigeria | 5.8/10 | Moderate | $300M+ annually | Mixed results |
| Tanzania | 4.5/10 | Low-Moderate | $50-80M annually | High inequality risk |
| Region | % of AI-Related Jobs | % of Population | Inequality Index |
| Dar es Salaam | 60-70% | 11% | Extreme concentration |
| Arusha/Mwanza | 15-20% | 14% | High concentration |
| Other Urban | 10-15% | 22% | Moderate access |
| Rural Areas | 0-5% | 53% | Severe exclusion |
Unemployment and inequality don't occur independently—they reinforce each other:
| Dimension | Current State (2025) | Projected 2030 | Change |
| Poverty Rate | 26-28% | 32-36% | +6-10 points |
| Youth Unemployment | 27% | 35-42% | +8-15 points |
| Informal Sector Size | 71.8% | 68-72% | Stagnant/growing |
| Rural-Urban Migration | Moderate | Accelerating | +40-60% |
| Social Protection Coverage | 15-20% | 12-18% | Declining |
| Income Concentration (Top 10%) | 35-40% | 45-52% | +10-12 points |
| Infrastructure Component | Current Coverage | Required for AI Economy | Gap |
| Reliable Electricity | 38% population | 80%+ | 42-point gap |
| Internet Access | 32% population | 70%+ | 38-point gap |
| High-Speed Broadband | 12% population | 50%+ | 38-point gap |
| Digital Payment Systems | 45% adults | 80%+ | 35-point gap |
| Computer Literacy | 25% workforce | 60%+ | 35-point gap |
| Factor | Tanzania | Kenya | Rwanda | Implication |
| AI Strategy | Developing (late 2025) | Implemented (2023) | Advanced (2022) | Tanzania 2-3 years behind |
| Digital Infrastructure | Low-Moderate | Moderate-High | High | Competitive disadvantage |
| AI Investment | $50-80M/year | $150-200M/year | $200M+/year | Limited resources |
| Informal Employment | 71.8% | 68% | 42% | Higher vulnerability |
| STEM Graduates | ~8,000/year | ~25,000/year | ~5,000/year | Skills shortage |
| Startup Ecosystem | Emerging | Developed | Growing rapidly | Less innovation capacity |
Feedback Loop Mechanism:
| Factor | Impact on Women | Impact on Men | Gender Gap |
| Sectoral Concentration | Higher in at-risk sectors | More diversified | 1.3x higher risk |
| Education Access | Lower tertiary enrollment | Higher enrollment | 30% disadvantage |
| Digital Literacy | 25% lower | Baseline | Significant gap |
| Reskilling Access | Limited by care duties | Greater flexibility | Mobility constraints |
| Income Decline (Displaced) | 35-50% | 25-35% | 10-15 points worse |
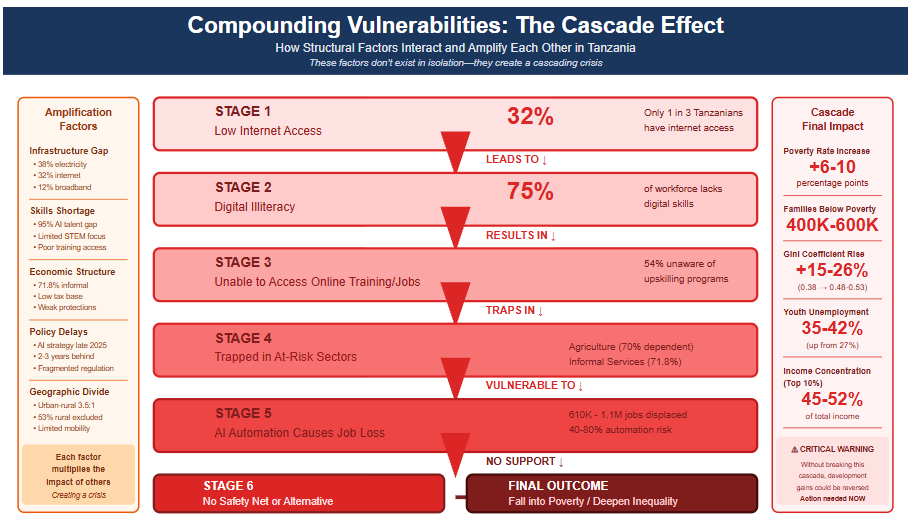
These factors don't exist in isolation—they interact and amplify each other:
Example Cascade:
This research demonstrates that AI will significantly increase unemployment and widen income inequality in Tanzania between 2025 and 2030 through multiple interconnected mechanisms:
The period 2025-2030 represents a decisive window for Tanzania. Without strong policy action, gaps in economic performance, capabilities, and governance systems can grow, reversing the long trend of narrowing development inequalities.
However, Tanzania still has time to shape this transition. The country has begun laying foundations through the National AI Strategy (expected late 2025), AI research labs at University of Dodoma and NM-AIST, the Digital Tanzania Project, and sector-specific programs like AI4D Agriculture. The question is not whether AI will transform Tanzania's labor market, but whether the country will shape that transformation proactively or react to it too late.
Critical Policy Imperatives:
The central finding of this research is clear: AI will increase unemployment and widen income inequality in Tanzania unless deliberate, inclusive, and well-sequenced policy interventions are implemented immediately. The next five years will determine whether Tanzania becomes an AI winner or loser.
The transformation is already underway globally—76,440 jobs eliminated in 2025, unemployment rising among AI-exposed occupations, and evidence of displacement spreading across sectors. Tanzania's structural vulnerabilities—71.8% informal employment, 70% agricultural dependence, severe digital divide, critical skills shortage—make the country particularly susceptible to AI-driven disruption.
Yet Tanzania also possesses unique advantages: a youthful population, late-mover learning opportunities, strong community values, and growing policy awareness. The country can choose to proactively shape an inclusive AI economy or reactively manage the fallout from mass displacement and deepening inequality.
The cost of inaction will be measured not only in lost jobs, but in lost development potential, widening inequality, and a generation left behind. The window for decisive action is now.
Artificial Intelligence (AI): Technologies that enable machines to perform tasks that typically require human intelligence, including machine learning, natural language processing, computer vision, and robotics.
Automation Risk/Potential: The percentage of tasks within a job that can be performed by AI systems, leading to either job displacement or significant job restructuring.
Formal Sector: Employment characterized by written contracts, social security benefits, legal protections, and regular wages.
Informal Sector: Economic activities not registered with government authorities, lacking formal contracts, social protection, and legal safeguards.
Gini Coefficient: A measure of income inequality ranging from 0 (perfect equality) to 1 (perfect inequality).
Digital Divide: The gap between those with access to digital technologies and those without, encompassing infrastructure, skills, and economic resources.
Skills Premium: Additional wages earned by workers with specialized skills relative to those with basic skills.
| Priority Level | Intervention | Target Group | Timeline | Estimated Cost | Expected Impact |
| CRITICAL | National AI Strategy Implementation | Whole economy | 2025-2026 | $50-100M | Framework for all actions |
| CRITICAL | Emergency Digital Literacy Program | 10M workers | 2025-2027 | $200-300M | 40% workforce upskilled |
| CRITICAL | Social Protection for Displaced Workers | 500K-1M workers | 2025-2030 | $150-250M/year | Poverty prevention |
| HIGH | Digital Infrastructure Expansion | Rural areas | 2025-2029 | $2-3B | 60% connectivity |
| HIGH | AI Skills Training Centers | Youth, educated | 2026-2028 | $100-150M | 50K AI professionals |
| HIGH | SME Technology Adoption Subsidies | 200K businesses | 2026-2030 | $300-500M | Productivity boost |
| MEDIUM | Education System Reform | Students | 2026-2030 | $400-600M | Future-ready workforce |
| MEDIUM | Rural-Urban Digital Bridge | Rural populations | 2027-2030 | $500-800M | Reduce geographic inequality |
| MEDIUM | Women and Youth Support Programs | Women, youth | 2025-2030 | $150-250M | Reduce gender/age gaps |
Amran Bhuzohera is a researcher focusing on labor markets, digital transformation, and development economics in East Africa, with particular emphasis on Tanzania's economic transition in the age of artificial intelligence.
Report Compiled: December 2025
Geographic Focus: Tanzania with global and regional context
Time Horizon: 2025-2030
Document Version: 1.0
Keywords: Artificial Intelligence, Tanzania, Labor Market, Unemployment, Income Inequality, Informal Sector, Agriculture, Digital Transformation, Skills Gap, Development Economics, East Africa, Automation, Job Displacement, Digital Divide, Policy Intervention
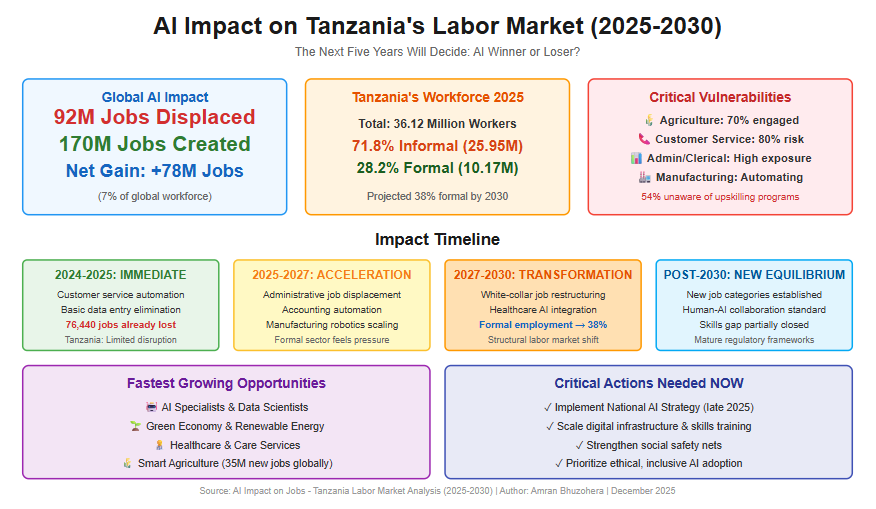
Artificial Intelligence (AI) is rapidly reshaping the global world of work, redefining how jobs are created, performed, and displaced. Between 2025 and 2030, AI-driven automation and digital transformation are expected to disrupt labour markets at a scale comparable to past industrial revolutions, but at unprecedented speed. According to the World Economic Forum, while AI and related technologies are projected to displace approximately 92 million jobs globally, they are also expected to create 170 million new jobs, resulting in a net global job gain of about 78 million positions, equivalent to roughly 7% of the current global workforce. However, these gains will not be evenly distributed across countries, sectors, or skills levels.
For Tanzania, the implications of this transformation are particularly profound. The country enters the AI era with a labour market that is structurally vulnerable yet full of latent opportunity. As of 2025, about 71.8% of Tanzania’s workforce—approximately 25.95 million people—operates in the informal sector, characterised by low job security, limited social protection, and minimal access to upskilling opportunities. Only 28.2% of workers (10.17 million) are in formal employment, although projections suggest gradual formalisation could raise this figure to around 38% by 2030 if supportive policies are implemented.
Globally, evidence shows that AI-related job displacement is no longer a future risk but a present reality. By 2025 alone, an estimated 76,440 jobs had already been eliminated worldwide due to AI adoption, with occupations such as customer service, data entry, retail cashiers, and clerical work experiencing the earliest impacts. Studies from the St. Louis Federal Reserve further demonstrate a strong positive correlation (0.47) between AI exposure and rising unemployment in highly digitised occupations between 2022 and 2025, particularly in computer and mathematical roles. These trends signal what lies ahead for emerging economies like Tanzania as AI adoption deepens.
Sectoral exposure in Tanzania mirrors global patterns but is intensified by the country’s economic structure. Agriculture employs roughly 28% of the national workforce and engages nearly 70% of Tanzanians indirectly, making it the backbone of livelihoods. While AI-powered precision farming, automated irrigation, drone-based crop monitoring, and pest-prediction systems promise productivity gains and climate resilience, they also reduce demand for manual labour. Without proactive reskilling and value-chain upgrading, technological efficiency gains could translate into rural job losses rather than inclusive growth.
Other vulnerable sectors include manufacturing and SMEs, where manual procurement, inventory management, and quality control are increasingly being automated; customer service and call centres, facing automation risks of up to 80% by 2025 due to chatbots and virtual assistants; and administrative and clerical roles, where bookkeeping, data entry, and document processing are rapidly being replaced by AI systems. Financial services are also transforming through AI-based credit scoring, fraud detection, and risk assessment, reducing demand for entry-level professionals while increasing demand for advanced digital skills.
At the same time, AI is creating new growth pathways. Globally, the fastest-growing roles between 2025 and 2030 include AI specialists, data scientists, software developers, cybersecurity analysts, and AI ethics officers, alongside strong employment growth in the green economy and care sectors. Notably, agriculture, construction, education, and healthcare are expected to generate the largest absolute number of new jobs, driven by population growth, infrastructure expansion, and social service needs. For Tanzania, this presents a strategic opportunity to align its youthful population, agricultural base, and digital transformation agenda with future-ready skills development.
Tanzania has begun laying the foundations for this transition. Key initiatives include the development of a National AI Strategy (expected in late 2025), the establishment of AI research labs through collaborations between the University of Dodoma and NM-AIST, the Digital Tanzania Project, and sector-specific programmes such as AI4D Agriculture, supported by international partners. However, major constraints remain, including limited digital infrastructure, unreliable electricity, a critical shortage of AI professionals, fragmented regulation, and low awareness—evidenced by the fact that 54% of workers are unaware of formalisation or digital upskilling programmes.
Ultimately, the period 2025–2030 will be decisive. AI will not simply determine how many jobs exist in Tanzania, but what kind of jobs, who gets them, and under what conditions. Without timely policy action, the AI transition risks deepening informality, widening rural-urban and gender inequalities, and marginalising low-skilled workers. With deliberate, inclusive, and well-sequenced reforms—focused on digital infrastructure, mass skills development, ethical AI governance, and social protection—Tanzania can instead leverage AI as a catalyst for productivity, formalisation, and sustainable development. The challenge is not whether AI will transform Tanzania’s labour market, but whether the country will shape that transformation proactively or react to it too late.
Artificial Intelligence is poised to fundamentally transform the global job market by 2030, and Tanzania will not be exempt from these changes. While AI will displace millions of jobs worldwide, it will also create new opportunities, resulting in a net positive job growth. However, the transition period will require significant workforce adaptation, particularly in Tanzania where 71.8% of the workforce operates in the informal sector.
The next five years will be decisive for Tanzania’s position in the age of Artificial Intelligence. AI is no longer a distant or abstract technology—it is already reshaping jobs, skills, and productivity across the global economy. For Tanzania, the stakes are exceptionally high. With over 70 percent of the workforce operating in the informal sector and a large share of livelihoods concentrated in agriculture and low-skilled services, the country faces both significant exposure to AI-driven disruption and a rare opportunity to leapfrog into a more productive, formal, and resilient economic structure.
Whether Tanzania emerges as an AI winner or loser will not be determined by technology alone, but by policy choices, investment priorities, and the speed of institutional response. If AI adoption advances without parallel investments in digital infrastructure, skills development, and worker protection, the result is likely to be deeper informality, rising job insecurity, and widening inequalities between urban and rural areas, formal and informal workers, and skilled and low-skilled populations. In such a scenario, productivity gains would accrue to a narrow segment of firms and workers, while the majority remain excluded from the benefits of technological progress.
Conversely, Tanzania has a credible pathway to becoming an AI winner. Ongoing initiatives—such as the development of a National AI Strategy, expansion of digital infrastructure, investment in AI research and education, and pilot applications in agriculture, healthcare, education, and finance—provide a foundation upon which inclusive AI adoption can be built. If these efforts are accelerated and aligned with large-scale upskilling, formalization incentives for SMEs, ethical AI governance, and targeted support for vulnerable groups such as youth, women, and rural workers, AI can become a driver of productivity, decent work, and sustainable growth.
Crucially, the transition period between 2025 and 2030 will be the most disruptive. Decisions taken now will determine whether Tanzanian workers are displaced by automation or empowered to work alongside AI technologies. This window demands urgency: scaling digital literacy, embedding AI skills across education and vocational training, strengthening social protection systems, and ensuring that AI adoption serves national development goals rather than undermines them.
In the end, Tanzania’s AI future is not preordained. The country can either react to AI-driven change after jobs are lost and inequalities widen, or act decisively to shape a human-centered, inclusive AI economy. The next five years will answer the question clearly. With deliberate, coordinated, and inclusive action, Tanzania can position itself as an AI winner. Without it, the cost of delay will be measured not only in lost jobs, but in lost development potential. Read More of this Topic: Doing Business in Tanzania 2025-2030
| Metric | Figure | Source |
| Jobs Displaced Globally | 92 million | World Economic Forum 2025 |
| New Jobs Created Globally | 170 million | World Economic Forum 2025 |
| Net Job Gain | +78 million (7% of global workforce) | World Economic Forum 2025 |
| Jobs Already Displaced (2025) | 76,440 positions | SSRN Research 2025 |
| Businesses Transforming with AI | 86% by 2030 | World Economic Forum 2025 |
| Organization | Jobs at Risk | Timeline | Notes |
| McKinsey Global Institute | 800 million jobs | By 2030 | Global automation impact |
| Goldman Sachs | 300 million full-time jobs | Long-term | Equivalent positions worldwide |
| World Economic Forum | 85 million jobs | By 2025 | Earlier projection |
| PwC | 30% of US jobs | By 2030 | Subject to automation |
| Job Category | Automation Risk | Jobs at Risk | Status |
| Customer Service Representatives | 80% | Millions globally | Already automating |
| Data Entry Clerks | 75% | 7.5 million by 2027 | High displacement |
| Retail Cashiers | 65% | Widespread | Ongoing transition |
| Telemarketers | 85-90% | High volume | Nearly obsolete |
| Bank Tellers | 25%+ decline | Significant | ATMs & mobile banking |
| Postal Service Clerks | 25%+ decline | Major reduction | Digital transformation |
| Job Category | Impact | Notes |
| Administrative Assistants | 40-50% | Routine tasks automated |
| Bookkeeping & Accounting Clerks | 45-55% | AI financial systems |
| Legal Assistants | 40-50% | Document automation |
| Manufacturing Workers | 40-60% | Robotics expansion |
| Transportation Workers | 30-50% | Autonomous vehicles (long-term) |
| Job Category | Impact | Notes |
| Computer Programmers | 30-40% | AI coding assistants |
| Proofreaders & Copy Editors | 35% | Generative AI tools |
| Credit Analysts | 30% | AI risk assessment |
| Graphic Designers | Declining demand | AI design tools |
| Job Category | Why Protected |
| Air Traffic Controllers | High-stakes decision making |
| Chief Executives | Strategic leadership |
| Radiologists | Complex medical judgment |
| Clergy/Religious Leaders | Human connection essential |
| Residential Advisors | Interpersonal care |
| Photographers (Creative) | Artistic vision |
| Position | Growth Rate | Demand |
| AI Specialists & Machine Learning Engineers | Very High | 350,000+ new positions globally |
| Data Analysts & Scientists | High | Top 3 fastest growing |
| Software & Application Developers | High | Continuous expansion |
| Information Security Analysts | High | Cybersecurity demand |
| UI/UX Designers | Moderate-High | Digital experience focus |
| Prompt Engineers | Emerging | New AI-era role |
| AI Ethics Officers | Emerging | Governance & compliance |
| Position | Growth Projection |
| Environmental Engineers | Top 15 fastest-growing |
| Renewable Energy Engineers | Rapid expansion |
| Sustainability Specialists | High demand |
| Energy Storage & Distribution | Growing sector |
| Position | New Jobs by 2030 | Driver |
| Farmworkers & Agricultural Laborers | 35 million | Green transition, food security |
| Delivery Drivers | Millions | E-commerce growth |
| Construction Workers | Millions | Infrastructure development |
| Nursing Professionals | High growth | Aging populations |
| Secondary School Teachers | Significant growth | Education expansion |
| Social Workers | Expanding | Care economy |
| Employment Type | Workforce | Percentage | Characteristics |
| Informal Employment | 25.95 million | 71.8% | Low security, variable wages |
| Formal Employment | 10.17 million | 28.2% | Benefits, social protection |
| Projected Formal (2030) | Growing | 38% | Gradual formalization |
| Factor | Current State | Challenge |
| Agricultural Workers | 28% of workforce | Mostly informal, vulnerable to automation |
| Small Businesses | 44% of informal economy | Limited AI awareness & resources |
| Unemployment Rate | 27% surveyed | High baseline vulnerability |
| Formal Job Awareness | 54% unaware of formalization programs | Education gap |
| Sector | Current State / Context | AI-Related Vulnerabilities / Threats | Emerging AI Use & Opportunities | Likely Impact |
| Agriculture (≈70% of Tanzanians engaged) | Backbone of the economy; largely manual and labor-intensive | • Automated irrigation systems • AI-powered pest detection • Precision farming reducing labor needs • Drone-based crop monitoring | • Smart agriculture solutions • Improved weather forecasting • Better market access • Productivity gains | Reduced demand for manual farm labor but higher efficiency and yields |
| Manufacturing & SMEs | Government promoting enterprise growth with digital tools | • Manual procurement processes • Labor-intensive assembly • Manual quality control | • Eva Docs.ai for procurement automation (local innovation) • Assembly line automation • Inventory management systems | Over 20+ hours/week saved in administrative work; fewer low-skill roles |
| Customer Service & Call Centers | Growing BPO sector in Tanzania | • AI chatbots replacing human agents • High exposure to automation | • AI-driven customer interaction tools | Immediate threat (2024–2025); up to 80% automation risk globally |
| Administrative & Clerical Work | Common across public sector, NGOs, and private firms | • Data entry automation • Bookkeeping software • AI document processing | • Digital record management • Workflow automation | Increasing job pressure as global AI standards expand |
| Financial Services | Expanding digital finance ecosystem | • Automated credit scoring • Risk assessment automation • AI-powered chatbots | • Fraud detection systems • Faster lending decisions | Reduced demand for entry-level finance professionals |
| Initiative | Description | Status |
| National AI Strategy | Comprehensive framework under development | Expected late 2025 |
| AI Research Lab | University of Dodoma & NM-AIST collaboration | Launched 2024 (Sh1.8 billion) |
| Digital Tanzania Project | Internet access, digital skills, government digitization | Ongoing |
| AI4D Agriculture Program | UN joint program (EU-funded, $3 million) | 2024-2027 |
| National Digital Education Guidelines | AI integration in education | Released 2025 |
| Barrier | Impact | Current State |
| Digital Infrastructure | Limited internet, unreliable electricity | Improving but inadequate |
| Skills Gap | Lack of AI professionals | Critical shortage |
| Awareness | 54% unaware of AI programs | Education needed |
| Regulatory Framework | No comprehensive AI oversight | Multiple agencies, fragmented |
| Investment | High costs for AI infrastructure | Limited funding |
| Period | Stage | Global / General Developments | Tanzania-Specific Context | Overall Implications |
| 2024–2025 | Immediate (Current Reality) | • Customer service automation (chatbots, virtual assistants) • Basic data entry elimination • Resume screening automation • Simple content generation • Retail self-checkout expansion • 76,440 jobs already eliminated in 2025 | • AI labs launching (e.g., University of Dodoma) • National AI strategy under development • Pilot AI projects in agriculture and healthcare • Limited disruption due to low AI adoption | Early signals of disruption; Tanzania still in a buffering phase |
| 2025–2027 | Acceleration | • Rapid expansion of administrative job displacement • Accounting and bookkeeping automation • Legal document processing by AI • Advanced customer service AI systems • Manufacturing robotics scaling • Major disruption timeline pulled forward to 2027–2028 | • Formal sector begins to feel AI pressure • Multinational firms introducing AI standards • Widening gap between AI-enabled and traditional firms • Early agricultural automation uptake | Productivity rises, but job insecurity increases in clerical and formal roles |
| 2027–2030 | Transformation | • Large-scale white-collar job restructuring • Transportation disruption (early autonomous vehicles) • AI integration in healthcare delivery • Education technology transformation • 30% of US jobs significantly changed (McKinsey) | • Formal employment projected to reach 38% • AI-skilled workers earn wage premiums • Shrinking traditional roles • Emergence of new tech-driven sectors • Growing rural-urban digital divide | Structural shift in labor markets and skills demand |
| Post-2030 | New Equilibrium | • New job categories firmly established • Human-AI collaboration becomes standard • Skills gap partially closed • Mature regulatory frameworks • Broader economic benefits realized | • More stable adaptation to AI • Stronger digital institutions • Improved alignment between education, skills, and labor demand | Long-term gains depend on policy, skills investment, and inclusion |
| Stakeholder | Timeframe / Focus | Key Recommendations | Expected Outcomes |
| Individuals | Immediate (2025) | • Pursue digital literacy training • Learn basic data analysis skills • Strengthen interpersonal and communication skills • Enroll in vocational training in growth sectors • Build an adaptability and lifelong-learning mindset | Improved employability and resilience to automation |
| Individuals | Medium-Term (2025–2027) | • Specialize in AI-resistant skills • Learn to work with AI tools rather than compete against them • Develop cross-disciplinary skills (tech + domain knowledge) • Network within tech and innovation communities • Explore entrepreneurship and self-employment | Higher income potential and smoother transition into emerging jobs |
| Businesses | Strategic Priorities | • Invest in employee reskilling and upskilling programs • Adopt AI gradually with human oversight • Partner with universities and training institutions • Prioritize ethical and responsible AI use • Prepare for hybrid human-AI workforce models | Productivity gains while minimizing workforce disruption |
| Government | Policy & Regulation | • Accelerate implementation of the National AI Strategy • Expand digital infrastructure (electricity and internet access) • Scale up funding for technical and vocational education • Establish regulatory sandboxes for AI testing • Strengthen social safety nets for displaced workers • Incentivize formalization using AI support tools • Implement rural-urban digital bridge programs • Prioritize women and youth due to higher vulnerability | Inclusive AI adoption and reduced inequality |
| Education Sector | Curriculum Reform | • Introduce AI literacy from secondary education • Teach coding and programming fundamentals • Expand data science and analytics training • Promote digital entrepreneurship • Embed human-centered design thinking • Teach ethics and responsible AI use | Future-ready workforce aligned with labor market needs |
Despite challenges, Tanzania has unique advantages:
| Country | AI Strategy Status | Key Focus |
| Kenya | Implemented | Agriculture, logistics |
| Rwanda | Advanced (Google partnership) | AI Research Centre |
| Nigeria | In education reform | Broad sectoral adoption |
| Tanzania | Developing | Deliberate, ethical approach |
Tanzania's Approach: Choosing deliberate, inclusive growth over rapid adoption may prove advantageous long-term.
Tanzania's Path Forward: The next five years will determine whether Tanzania becomes an AI winner or loser. Success requires:
The choice is clear: Adapt proactively or face displacement reactively. The AI revolution is not coming—it's already here.
Report Compiled: December 2025 Data Sources: Academic research, government reports, international organizations, and industry studies Geographic Focus: Tanzania with global context Time Horizon: 2025-2030
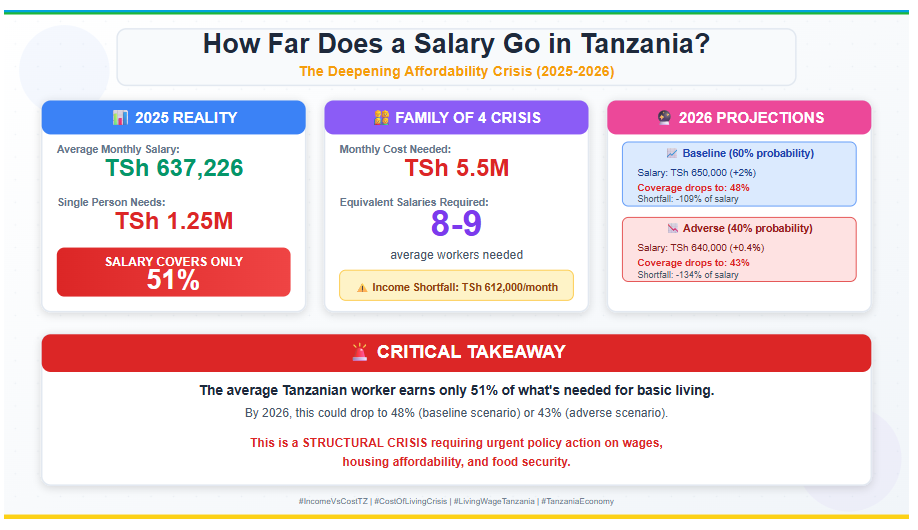
Tanzania is facing a deepening affordability challenge as the gap between household incomes and the cost of living continues to widen. In 2025, the average monthly salary stands at TSh 637,226, yet a single person requires approximately TSh 1.25 million per month to meet basic living expenses—equivalent to 196% of the average salary. This leaves an income shortfall of nearly TSh 612,000, meaning the typical worker earns only 51% of what is needed to live modestly. The situation is far more severe for families: a household of four needs about TSh 4.75 million per month for a moderate lifestyle and closer to TSh 5.5 million to remain financially stable—an amount equal to the combined earnings of 8–9 average workers. Looking ahead to 2026, projections suggest the crisis will intensify. Under the baseline scenario, salaries rise marginally to TSh 650,000 (+2%), while living costs for a single person increase to TSh 1.36 million, widening the deficit to -109% of salary. In an adverse scenario, workers may earn only 43% of their basic needs, with family living costs exceeding TSh 6.6 million per month. These figures highlight a structural imbalance where economic growth and wage adjustments are failing to keep pace with rising living costs—signaling an urgent need for policy action on wages, housing affordability, and food security. More On This Topic: Is the Cost of Living in Tanzania Outpacing Incomes as We Enter 2026?
| Category | Amount (TSh) | % of Salary |
| Average Monthly Salary | 637,226 | 100% |
| Monthly Living Cost | 1,249,000 | 196% |
| Income Shortfall | -611,774 | -96% |
Key Insight: A single person needs to earn nearly double the average salary just to cover basic expenses.
| Category | Amount (TSh) | Equivalent Salaries Needed |
| Single Average Salary | 637,226 | 1 person |
| Family Monthly Cost | 4,750,000 | 7.5 people |
| Required Household Income | 5,500,000 | 8.6 people |
Key Insight: A family needs the combined income of 8-9 average workers to live moderately—typically requiring 2 high-earning adults plus additional income sources.
| Metric | 2025 | 2026 Baseline | 2026 Adverse |
| Avg. Monthly Salary | 637,226 | 650,000 (+2%) | 640,000 (+0.4%) |
| Single Person Cost | 1,249,000 | 1,360,000 | 1,500,000 |
| Income Shortfall | -611,774 (-96%) | -710,000 (-109%) | -860,000 (-134%) |
| Salary Coverage | 51% of needs | 48% of needs | 43% of needs |
The average Tanzanian worker currently earns only 51% of what's needed for basic living. By 2026, this could drop to 48% (baseline) or 43% (adverse scenario).
This isn't just an income problem—it's a structural crisis requiring urgent policy action on wages, housing affordability, and food security.
Tanzania's deepening cost-of-living crisis reveals a profound structural disconnect between wages and essential expenses. In 2025, the average monthly salary of TSh 637,226 covers only 51% of a single person's basic needs (TSh 1.25 million) and forces families of four to rely on the equivalent of 8–9 average incomes to achieve modest financial stability (TSh 5.5 million). Projections for 2026 indicate further deterioration: under the baseline scenario, salary coverage falls to 48% for individuals, with family costs rising toward TSh 6 million; in the adverse scenario, workers may earn just 43% of their needs, pushing family expenses beyond TSh 6.6 million.
These trends signal that economic growth and wage adjustments are failing to keep pace with inflation in housing, food, and other essentials. Without urgent, targeted policy interventions—raising living wages, improving housing affordability, strengthening food security, and promoting inclusive growth—the affordability gap will widen further, eroding living standards and deepening inequality for millions of Tanzanians. Addressing this crisis is not only an economic imperative but a moral one, essential for building a more equitable and sustainable future.
The cost of living has become one of the most pressing economic realities shaping everyday life in Tanzania. While the country continues to post relatively strong macroeconomic indicators—such as GDP growth of 5.6% in 2025—these headline figures mask a growing disconnect between household incomes and the actual cost of meeting basic needs. For millions of Tanzanians, especially salaried workers, small entrepreneurs, and urban households, affordability is no longer just a concern—it is a structural challenge.
According to the 2025 Cost of Living Analysis, Tanzania remains 61.2% cheaper overall than the United States, with rent costs approximately 78.3% lower. However, this international comparison obscures a more critical domestic reality: local wages have not kept pace with the rising cost of housing, food, utilities, and essential services.
In 2025, the average monthly salary is estimated at 637,226 Tanzanian Shillings (TSh). Against this income, the estimated monthly cost of living for a single person—excluding rent—stands at 1,152,096 TSh, while a family of four requires approximately 4.1 million TSh per month to meet basic needs.
This means that even before accounting for rent, the average worker earns less than half of what is required to sustain a modest standard of living.
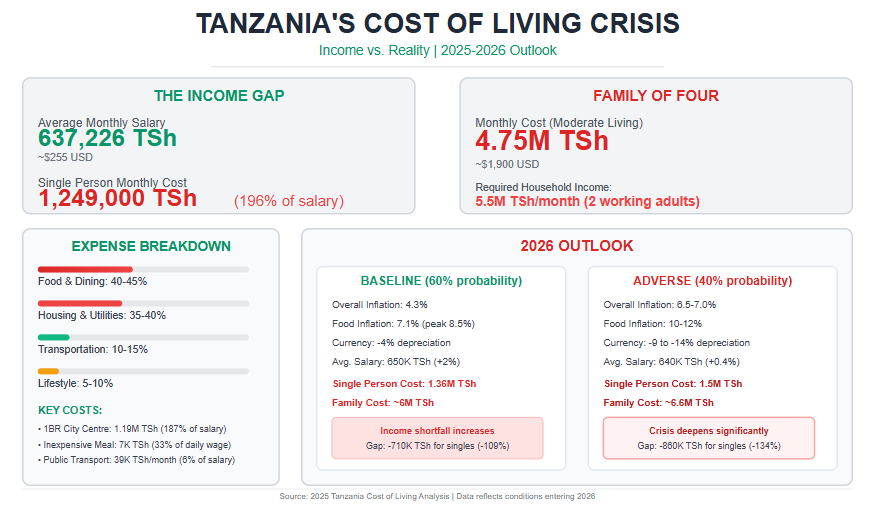
Food and dining account for the largest share of household expenditure, consuming 40–45% of monthly income. A simple inexpensive meal costs around 7,000 TSh, equivalent to 33% of an average daily wage, while a mid-range meal for two can exceed 50,000 TSh, or more than two full days of income for many workers.
Even staple grocery items—though relatively affordable individually—accumulate into a significant monthly burden, especially for families.
Housing costs present an even deeper structural challenge. Renting a one-bedroom apartment in a city centre costs approximately 1.19 million TSh per month, representing 187% of the average monthly salary. Even outside city centres, rent for a modest one-bedroom unit consumes over 70% of average income, while three-bedroom family housing exceeds total earnings entirely.
Utilities and internet add a further 300,000 TSh per month, reinforcing the affordability gap.
Transportation remains relatively affordable—public transport costs around 39,000 TSh per month, or about 6% of salary—but private vehicle ownership is increasingly out of reach, with the cost of a new compact car equivalent to nearly 70 months of income.
When all expenses are combined, a budget-conscious single person requires approximately 1.25 million TSh per month, nearly double the average salary. For a family of four, sustainable living requires a household income of 4.8–5.5 million TSh per month, typically achievable only with two high-earning adults or external income sources.
This growing income–cost gap explains rising household debt, reduced savings, informal coping strategies, and increasing vulnerability among urban populations. It also places pressure on businesses, as workers demand higher wages while firms face higher operating costs.
The outlook for 2026 presents both risk and uncertainty. Under the baseline scenario—where political and economic conditions stabilize—overall inflation is projected to rise to 4.3%, with food inflation averaging 7.1% and peaking as high as 8.5% mid-year. The Tanzanian Shilling is expected to depreciate by about 4%, pushing up the cost of imported goods, fuel, and agricultural inputs.
In this scenario, average monthly salaries are projected to rise marginally to around 650,000 TSh, while the monthly cost of living for a single person climbs to 1.36 million TSh—deepening the affordability gap rather than closing it. Families would require close to 6 million TSh per month to maintain a moderate standard of living.
Under an adverse scenario, characterized by prolonged political or economic disruptions, inflation could rise to 6.5–7.0%, food prices could increase by 10–12%, and the currency could depreciate by up to 14%. This would push the monthly cost of living for a single person to 1.5 million TSh, while families could face costs exceeding 5.7 million TSh, further increasing poverty and inequality.
The data sends a clear message: Tanzania’s cost-of-living challenge is no longer about prices alone—it is about income adequacy, economic structure, and policy choices. Without deliberate action on wages, housing supply, food systems, and productivity, economic growth risks becoming disconnected from lived reality. As the country looks toward 2026 and beyond, addressing the cost of living is not just an economic necessity—it is a social and political imperative.
Tanzania offers a significantly lower cost of living compared to the United States, making it an affordable destination for both residents and expatriates. The data shows Tanzania is 61.2% cheaper overall than the US, with rent being 78.3% lower. More on This Topic: Will Tanzania's Robust Central Bank Position Ensure Continued Growth Through 2026?
| Household Type | Monthly Cost (Excluding Rent) | USD Equivalent* |
| Family of Four | 4,110,219 TSh | ~$1,644 |
| Single Person | 1,152,096 TSh | ~$461 |
*Based on approximate exchange rate of 2,500 TSh = 1 USD
| Item | Average Cost | Price Range | % of Daily Wage** |
| Inexpensive Meal | 7,000 TSh | 3,000-15,000 | 33% |
| Mid-Range Meal (2 people) | 50,000 TSh | 30,000-120,000 | 235% |
| Fast Food Combo | 20,000 TSh | 15,000-25,000 | 94% |
| Cappuccino | 5,149 TSh | 2,000-7,500 | 24% |
| Local Beer (0.5L) | 2,500 TSh | 2,000-5,000 | 12% |
**Based on average daily wage of ~21,241 TSh (637,226/30 days)
| Category | Item | Cost | Budget Impact |
| Staples | White Rice (1kg) | 2,711 TSh | Low |
| Fresh Bread (500g) | 1,986 TSh | Low | |
| Eggs (12) | 5,291 TSh | Low | |
| Protein | Chicken (1kg) | 12,346 TSh | Medium |
| Beef (1kg) | 10,500 TSh | Medium | |
| Local Cheese (1kg) | 22,125 TSh | High | |
| Produce | Bananas (1kg) | 2,527 TSh | Low |
| Tomatoes (1kg) | 2,406 TSh | Low | |
| Apples (1kg) | 6,167 TSh | Medium |
Weekly grocery budget for single person: ~60,000-80,000 TSh (26-35% of monthly food costs)
| Type | Location | Monthly Rent | Annual Cost | % of Avg Salary |
| 1-Bedroom | City Centre | 1,194,740 TSh | 14,336,880 | 187% |
| 1-Bedroom | Outside Centre | 452,967 TSh | 5,435,604 | 71% |
| 3-Bedroom | City Centre | 2,060,000 TSh | 24,720,000 | 323% |
| 3-Bedroom | Outside Centre | 822,208 TSh | 9,866,496 | 129% |
Key Insight: Living outside the city centre saves approximately 62% on rent for 1-bedroom apartments and 60% for 3-bedroom apartments.
| Service | Average Cost | Range | % of Rent (1BR Outside) |
| Electricity, Water, Gas, Garbage | 181,593 TSh | 120,000-300,000 | 40% |
| Internet (60+ Mbps) | 99,923 TSh | 50,000-150,000 | 22% |
| Mobile Phone (10GB+) | 28,294 TSh | 10,000-50,000 | 6% |
| Total Utilities | 309,810 TSh | - | 68% |
| Transport Type | Cost | Monthly Impact |
| Public Transport | One-way ticket: 650 TSh | |
| Monthly pass: 39,000 TSh | 6% of salary | |
| Private Transport | Gasoline (1L): 2,979 TSh | |
| New Compact Car: 44,297,674 TSh | 69.5 months salary | |
| Taxi Services | Start fare: 4,000 TSh | |
| Per km: 4,000 TSh |
Budget Recommendation: Public transport is highly affordable at 39,000 TSh/month. For car owners, factor in ~50,000-80,000 TSh monthly for fuel (based on average commuting).
| Category | Item | Cost | Affordability |
| Fitness | Gym Membership | 145,556 TSh | 23% of salary |
| Entertainment | Cinema Ticket | 12,000 TSh | 2% of salary |
| Tennis Court (1hr) | 16,250 TSh | 3% of salary | |
| Clothing | Jeans (Levi's) | 39,375 TSh | 6% of salary |
| Running Shoes | 83,571 TSh | 13% of salary |
| Service | Annual Cost | Monthly Equivalent | % of Annual Salary |
| Preschool/Kindergarten | 18,617,766 TSh | 1,551,480 TSh | 243% |
| International Primary School | 31,434,444 TSh | 2,619,537 TSh | 411% |
Critical Note: International schooling is extremely expensive relative to local salaries, typically requiring expatriate-level income or significant family savings.
| Expense Category | Monthly Cost | % of Total |
| Rent (1BR outside centre) | 450,000 TSh | 36% |
| Utilities | 310,000 TSh | 25% |
| Food (groceries + occasional dining) | 280,000 TSh | 22% |
| Transportation (public) | 39,000 TSh | 3% |
| Mobile/Internet | 50,000 TSh | 4% |
| Entertainment/Misc | 120,000 TSh | 10% |
| TOTAL | 1,249,000 TSh | 100% |
Budget vs Average Salary: 196% (requires income above average)
| Expense Category | Monthly Cost | % of Total |
| Rent (3BR outside centre) | 850,000 TSh | 18% |
| Utilities | 350,000 TSh | 7% |
| Food (groceries + dining) | 1,200,000 TSh | 25% |
| Transportation (car + fuel) | 200,000 TSh | 4% |
| Education (2 children, local school) | 500,000 TSh | 11% |
| Healthcare/Insurance | 300,000 TSh | 6% |
| Entertainment/Misc | 350,000 TSh | 7% |
| Savings | 1,000,000 TSh | 21% |
| TOTAL | 4,750,000 TSh | 100% |
Household Income Needed: ~4,800,000-5,500,000 TSh/month (2 working adults)
Assumption: Unrest subsides by Q1 2026, limited international sanctions
| Economic Indicator | 2025 Actual | 2026 Baseline Projection | Change |
| GDP Growth | 5.6% | 5.8% | +0.2% |
| Overall Inflation | 3.4% | 4.3% | +0.9% |
| Food Inflation | 6.6% | 7.1% (avg), 8.5% (peak July) | +0.5-1.9% |
| Currency (TSh/USD) | 2,692 | 2,799 | -4.0% depreciation |
| Tourism Revenue Growth | +15% | -12% (Q1) then recovery | Net: -5% |
| Foreign Aid | $3B+ annually | Reduced by $150M | -5% |
Assumption: Unrest continues into mid-2026, broader sanctions imposed
| Economic Indicator | 2026 Adverse Projection | Change from Baseline |
| GDP Growth | 4.0% | -1.8% |
| Overall Inflation | 6.5-7.0% | +2.2-2.7% |
| Food Inflation | 10-12% | +2.9-4.9% |
| Currency (TSh/USD) | 2,950-3,100 | -9-14% depreciation |
| FDI Inflows | 50% reduction | -$1.5B |
| Poverty Rate | 26% (from 25%) | +1% |
| Category | 2025 | 2026 Baseline | 2026 Adverse |
| Average Monthly Salary | 637,226 TSh | 650,000 TSh (+2%) | 640,000 TSh (+0.4%) |
| Single Person Monthly Costs | 1,249,000 TSh | 1,360,000 TSh | 1,500,000 TSh |
| Income Shortfall (Single) | -611,774 TSh (-96%) | -710,000 TSh (-109%) | -860,000 TSh (-134%) |
| Family of Four Costs | 4,750,000 TSh | 5,175,000 TSh | 5,700,000 TSh |
| Required Household Income | ~5,500,000 TSh | ~6,000,000 TSh | ~6,600,000 TSh |
Critical Finding: The average salary falls significantly below estimated costs, with shortfalls ranging from 546,679 TSh for single persons to over 3.6 million TSh for families with one earner.
Tanzania's budget totals TZS 56.49 trillion (approximately USD 22.07 billion), representing an 11.6% increase from the previous year. The budget aims to achieve 6% GDP growth in 2025, maintain inflation between 3-5%, and increase domestic revenue collection to 16.7% of GDP.
Tanzania’s National Budget, amounting to TZS 56.49 trillion (an 11.6% increase from the previous year), is not merely a fiscal plan but a direct intervention in the daily economic realities of households and businesses. Anchored on a 6.0% GDP growth target, inflation control within 3–5%, and increased domestic revenue mobilisation to 16.7% of GDP, the budget seeks to balance cost-of-living pressures, income growth, and business competitiveness in a tightening global economic environment.
For households, the budget’s meaning is reflected in how it influences prices, access to basic services, disposable income, and employment opportunities. With headline inflation at 3.5% (October 2025)—within the government’s target—macroeconomic stability has largely been preserved. However, this stability is unevenly felt. Food inflation stands at 7.4%, significantly above overall inflation, directly affecting low- and middle-income families who allocate a larger share of income to food. To cushion these pressures, the budget allocates TZS 708.6 billion for fertilizer subsidies, TZS 444.7 billion for education, and TZS 414.7 billion for healthcare, lowering essential household expenditures and supporting rural livelihoods. At the same time, new levies—such as the TZS 10 per litre fuel levy and increased excise duties on selected products—introduce modest upward pressure on transport and energy costs, particularly for urban middle-income households.
For businesses, the budget signals both opportunity and adjustment. Strong revenue performance (106.1% of target by September 2025) and high development expenditure execution (98.5%) indicate an active government spending environment that benefits contractors, suppliers, and service providers. Access to finance has improved, with private sector credit growing by 16.1% year-on-year, supported by stable interest rates and increased liquidity. Sectorally, the budget prioritizes manufacturing (18.12% of total allocation), energy, transport infrastructure, and agriculture, where credit growth reached 25.6%, reinforcing agribusiness expansion. Export-oriented activities are further supported by strong external sector performance, with exports growing by 19.8% and the current account deficit narrowing by 23.3%, contributing to a 9.5% appreciation of the Tanzanian shilling, which lowers import costs for firms reliant on imported inputs.
However, the budget also raises the cost of compliance and taxation for some businesses. The increase in the Alternative Minimum Tax to 1%, the introduction of a 10% withholding tax on retained earnings, and new excise duties on selected manufactured and imported goods may constrain reinvestment and margins, especially for small and medium-sized enterprises. Notably, despite the large budget allocation to manufacturing, credit growth to the sector remains low at 5.2%, suggesting a gap between fiscal ambition and on-the-ground financing outcomes.
Overall, the 2025/26 Budget means that households benefit from macroeconomic stability and sustained social spending, though rising food prices remain a key concern, while businesses operate in a generally supportive growth environment characterized by improved infrastructure, expanding credit, and stable demand—but with heightened tax and compliance expectations. In essence, the budget redistributes resources toward long-term growth and stability, while requiring households and firms to navigate short-term cost adjustments as the economy transitions toward higher productivity and domestic revenue reliance. Read More: Tanzania Economic Updates December 2025

The early implementation of the 2025/26 Budget shows that macroeconomic stability is translating into tangible benefits for households, although these gains are being partially offset by rising food and energy costs.
First, inflation remains within the government’s target range, with headline inflation recorded at 3.5% in October 2025. This has helped preserve household purchasing power, particularly for non-food items such as clothing, utilities, and basic services, where price increases remain subdued.
Second, the appreciation of the Tanzania shilling by 9.5% year-on-year, from TZS 2,693 per USD in October 2024 to TZS 2,452 per USD in October 2025, has reduced the cost of imported goods. This benefits households through lower prices for imported food items, fuel-related inputs, medicines, and consumer goods, while also helping to contain inflationary pressures.
Third, strong government revenue performance—106.1% of the target by September 2025— has enabled continued funding of essential public services. This supports sustained delivery of education, healthcare, water, and social services, reducing out-of-pocket expenditure for households and improving access to basic needs.
Fourth, employment and income opportunities are expanding, supported by private sector credit growth of 16.1%. Increased lending to sectors such as agriculture, trade, tourism, and mining is translating into higher economic activity, job creation, and more stable household incomes, particularly for informal and SME-linked households.
Finally, borrowing costs for households have declined modestly, with the average lending rate falling from 15.67% to 15.19%. While still relatively high, this reduction improves affordability of personal loans, mortgages, and SME-related household enterprises, supporting consumption and small-scale investment.
Despite these gains, food inflation remains the most significant pressure on household welfare. Food inflation stood at 7.4% in October 2025, more than double the headline rate, disproportionately affecting low- and middle-income families who spend a larger share of their income on food.
In addition, energy and utilities inflation increased to 4.0%, reflecting higher fuel-related costs. The introduction of a TZS 10 per litre fuel levy and other transport-related charges has added upward pressure on commuting and logistics costs, indirectly feeding into household expenses.
Urban middle-income households are experiencing mixed outcomes. While they benefit from stable inflation and exchange rate gains, higher transport costs, vehicle-related levies, and selective excise duties are eroding disposable income, particularly for salaried workers.
Overall Assessment for Households:
Grade: B+ – The budget is delivering on macroeconomic stability and service provision, but rising food prices remain a critical challenge that weakens household welfare gains.
For businesses, the budget is creating a generally supportive operating environment, anchored in strong public spending execution, expanding credit, and improved external sector performance. However, tax and compliance pressures are weighing on investment decisions, particularly in manufacturing.
Credit availability has improved significantly, with private sector credit expanding by 16.1% year-on-year. This indicates stronger bank lending appetite and improved liquidity, supporting business expansion, working capital financing, and investment across multiple sectors.
Sectoral performance data shows that mining (29.7%), agriculture (25.6%), and tourism-related activities (23.2%) are responding strongly to the budget and broader economic conditions. These sectors are benefiting from targeted incentives, export demand, infrastructure development, and improved access to finance.
Cash flow conditions for compliant businesses have improved due to VAT refunds being processed within 30 days, reducing liquidity constraints—especially for exporters and capital-intensive firms.
Public investment is translating into real economic activity, with development expenditure execution reaching 98.5% by September 2025. Ongoing infrastructure projects in transport, energy, and logistics are lowering operational costs, improving market access, and generating business opportunities in construction, supply chains, and services.
Externally, export growth of 19.8%, led by gold and traditional exports, has expanded market opportunities for producers and exporters, while improved foreign exchange availability supports import-dependent businesses.
Despite these positives, the manufacturing sector is underperforming relative to budget priorities. While it received 18.12% of the total budget allocation, credit growth to manufacturing remains low at 5.2%, indicating weak transmission of fiscal support into private investment.
Tax policy changes are also affecting business sentiment. The increase in the Alternative Minimum Tax to 1% raises the tax burden for low-margin and loss-making firms, while the 10% withholding tax on retained earnings reduces internally generated funds available for reinvestment and expansion.
Additionally, new compliance and administrative requirements, including enhanced electronic invoicing and reporting obligations, are increasing operating and compliance costs—particularly for SMEs and informal-sector businesses transitioning into the formal economy.
Overall Assessment for Businesses:
Grade: B – The business environment remains broadly positive, supported by credit growth, infrastructure spending, and export performance, but manufacturing sector response and tax-related investment constraints require urgent policy attention.
| Indicator | 2024/25 | 2025/26 Target | Impact |
| Real GDP Growth | 5.5% | 6.0% | More economic opportunities |
| Inflation Rate | 3.1% | 3.0-5.0% | Stable prices for households |
| Domestic Revenue | 15.8% of GDP | 16.7% of GDP | Higher tax collection |
| Tax Revenue | 12.6% of GDP | 13.3% of GDP | More government services |
| Budget Deficit | 3.4% of GDP | 3.0% of GDP | Improved fiscal stability |
| GDP Size | TZS 148.5 trillion | TZS 156.6 trillion | Growing economy |
A. DIRECT HOUSEHOLD BENEFITS
| Sector | Allocation (TZS Billion) | What It Means for Households |
| Education | 444.7 | Free education continues, reducing family costs |
| Healthcare | 414.7 | Improved access to medical services, lower healthcare costs |
| Fertilizer Subsidies | 708.6 | Lower farming costs for rural families |
| Student Loans | 636.0 | Access to higher education for youth |
| Energy Development | 2,200.0 | Rural electrification improving living standards |
| Water Projects | 378.7 | Better access to clean water |
| Item | Previous | New | Household Impact |
| Motorcycle Annual Tax | TZS 290,000 | TZS 120,000 | Savings of TZS 170,000 for bodaboda operators |
| Commercial Motorcycle Fee | Paid annually | TZS 170,000 (once every 3 years) | Lower transport costs |
| VAT on Online Purchases | 18% | 16% | Cheaper online shopping |
| Fertilizers | Standard VAT | Zero-rated for 3 years | Lower food production costs |
| Textiles | Standard VAT | Zero-rated for 1 year | Cheaper clothing |
| Newspapers | Standard VAT | VAT exempt | Lower information access costs |
| Item | New Tax/Levy | Household Impact |
| Fuel Levy | TZS 10 per liter | Higher transport and energy costs |
| Alcohol Excise Duty | USD 0.02-0.05 per liter | More expensive alcoholic beverages |
| Vehicle Import Levy | Up to TZS 200,000 | Higher car ownership costs |
| Airline Tickets | TZS 1,000 levy | More expensive air travel |
| Train Tickets | TZS 500 levy | Increased rail transport costs |
| Electronic Cigarettes | 30% excise duty | Higher costs for e-cigarette users |
| Gaming Stakes | 10% excise duty | Higher costs for betting |
New excise duties on alcohol, the TZS 10 per liter fuel levy, and vehicle import levies may increase household expenses, particularly for middle-income families. However, sustained subsidies, education support, and healthcare allocations directly benefit low-income households.
| Household Type | Overall Impact |
| Low-Income/Rural | Positive - benefits from subsidies, education, healthcare outweigh new taxes |
| Middle-Income Urban | Mixed - benefits from some tax reliefs but faces higher fuel and vehicle costs |
| High-Income | Slightly negative - more taxes on luxury items and retained earnings |
| Sector | Allocation (TZS Trillion) | % of Budget | Business Opportunities |
| Manufacturing | 10.24 | 18.12% | Major government focus, incentives for production |
| Agriculture | 1.90 | 3.36% | 203.6% increase from 2021/22, farming opportunities |
| Tourism | 0.36 | 0.64% | Infrastructure development for AFCON 2027 |
| Energy | 2.20 | 3.89% | Rural electrification, hydropower projects |
| Transport Infrastructure | Major allocation | - | SGR, ports, roads development |
| Measure | Details | Business Benefit |
| VAT Refunds | Within 30 days of application | Improved cash flow |
| Tea Processing | Exempt from Alternative Minimum Tax for 3 years | Relief for struggling tea businesses |
| Gold Sales to BoT | 0% VAT | Increased profitability for gold traders |
| Charitable Institutions | Income tax exempt | Support for NGOs in health/environment |
| Local Manufacturers | VAT exemptions on fertilizers, pesticides, edible oils | Lower production costs |
| Hotel Levy | Reduced from 10% to 2% | Lower costs for hospitality businesses |
| Service Levy | Capped at 0.25% of gross income | Reduced burden on service providers |
| Loading/Offloading Fees | Abolished | Lower logistics costs |
| Measure | Details | Business Challenge |
| Alternative Minimum Tax | Increased from 0.5% to 1% | Higher minimum tax burden |
| Withholding Tax on Retained Earnings | 10% WHT on undistributed profits | Reduces funds available for reinvestment |
| EPZ/SEZ Local Sales | Removal of 10-year tax holiday | Higher taxes for export processing zones |
| Gaming Commissions | 10% WHT | Reduced margins for gaming operators |
| Electronic Receipts | Mandatory fiscalized receipts for tax deductions | Compliance costs |
| Excise Duties | New duties on crisps, ice cream, sausages, imported soaps, margarine | Higher costs for food processors and importers |
| Carbon Emissions Levy | TZS 22,000 per ton | Environmental compliance costs |
| Mandatory Travel Insurance | USD 44 for foreign visitors | Potential tourism deterrent |
| Requirement | Impact on Business |
| Integration of invoicing systems with TRA | Enhanced tax compliance monitoring |
| IPSAS reporting and new audit deadlines | Stricter financial reporting for public entities |
| VAT collection agency mechanism | 3% VAT collection on vendor payments |
| Monthly contributions from public entities | 15-60% of gross revenue contributions required |
| Measure | Impact |
| TZS 708.6 billion fertilizer subsidies | Lower input costs, higher productivity |
| Zero-rated VAT on pesticides and fertilizers | Reduced operating costs |
| Tanzania Agricultural Development Bank loans | Access to capital for expansion |
| Irrigation projects | Improved farming efficiency |
Outlook: The sector contributed 26.5% to GDP and benefits from continued subsidies to boost yields. Highly positive for agribusinesses.
| Opportunity | Details |
| TZS 10.24 trillion allocation | Massive government investment |
| VAT exemptions for local producers | Cost advantages over imports |
| Support for cotton-based clothing | Local textile industry support |
| Removal of IDL on clinker | Lower costs for cement manufacturers |
Outlook: The government emphasized manufacturing as key to boosting GDP and employment, receiving 18.12% of the national budget. Very positive for manufacturers.
| Measure | Impact |
| 20% of gold output for local processing | Value addition requirements |
| 0% VAT on gold sales to BoT | Tax benefits |
| 0.1% mining levy | Funds universal health insurance |
Outlook: Mixed - benefits from VAT relief but faces mandatory local processing requirements.
| Sector | Growth Rate 2024 | Budget Support |
| Information & Communication | 14.3% | Digital infrastructure investment |
| Finance & Insurance | 13.8% | Strong credit growth to private sector |
| Tourism | - | TZS 359.9 billion for AFCON 2027 preparations |
| Arts & Entertainment | 17.1% | Highest growth sector |
Outlook: Services sector shows strong growth, particularly ICT and finance.
| Project | Investment | Business Impact |
| Standard Gauge Railway (SGR) | TZS 1.68 trillion (2024/25) | Reduced transport costs, improved logistics |
| Julius Nyerere Hydropower Plant | Major ongoing project | Cheaper electricity, energy security |
| Rural Electrification | TZS 574.8 billion (2024/25) | Expanded market reach |
| AFCON 2027 Stadium Construction | Included in budget | Construction and hospitality opportunities |
| Ports and Airports | Part of TZS 2.75 trillion transport allocation | Improved trade infrastructure |
| Revenue Source | Amount (TZS Trillion) | Percentage |
| Domestic Revenue | 38.9 | 68.9% |
| - TRA Collections | 26.73 | - |
| - Non-tax Revenue | 4.66 | - |
| Grants and Concessional Loans | 5.47 | 9.7% |
| Domestic Borrowing | 5.44 | 9.6% |
| Non-concessional Loans | 2.10 | 3.7% |
| Total Budget | 56.49 | 100% |
| Expenditure Category | Amount (TZS Trillion) | Purpose |
| Subsidies and Transfers | 23.04 | Social services, institutions, local government |
| Salaries and Pensions | 7.71 | Government employees |
| Goods and Services | 7.81 | Government operations |
| Capital Payments | 7.72 | Debt repayment |
| Interest Payments | 6.49 | Debt servicing |
| Development Projects | 16.4 | Infrastructure, strategic projects |
| Indicator | Budget Target | Current Status (Oct 2025) | Assessment |
| Headline Inflation | 3.0-5.0% | 3.5% | ✓ Within target range |
| Food Inflation | Not specified | 7.4% | Rising pressure on households |
| Core Inflation | Not specified | 2.1% | Well controlled |
| Energy & Utilities Inflation | Not specified | 4.0% | Moderate increase |
| Non-food Inflation | Not specified | 1.0% | Very stable |
| Category | Weight (%) | Monthly Change | Impact on Budget |
| Food and non-alcoholic beverages | 28.2 | -0.2% | Slight relief this month |
| Housing, water, electricity | 15.1 | -0.5% | Lower utility costs |
| Transport | 14.1 | -0.7% | Reduced transport expenses |
| Clothing and footwear | 10.8 | +0.1% | Minimal increase |
| Furnishings & household equipment | 7.9 | +0.3% | Moderate increase |
| Revenue Source | Monthly Target (TZS Billion) | Actual Collection | Performance | % Achievement |
| Total Revenue | 3,503.9 | 3,718.2 | Exceeded | 106.1% |
| Tax Revenue | 2,804.6 | 3,124.2 | Exceeded | 111.4% |
| - Taxes on imports | 981.5 | 1,052.0 | Exceeded | 107.2% |
| - Income taxes | 1,185.4 | 1,354.9 | Exceeded | 114.3% |
| - Taxes on local goods | 445.1 | 543.9 | Exceeded | 122.2% |
| - Other taxes | 192.6 | 173.4 | Below target | 90.0% |
| Non-tax Revenue | 548.1 | 446.2 | Below target | 81.4% |
| Expenditure Category | Estimate (TZS Billion) | Actual (TZS Billion) | % Execution |
| Total Expenditure | 4,366.3 | 4,284.2 | 98.1% |
| Recurrent Expenditure | 2,563.3 | 2,508.6 | 97.9% |
| - Wages and salaries | 1,084.7 | 1,079.7 | 99.5% |
| - Interest payments | 530.5 | 437.3 | 82.4% |
| - Other goods/services | 948.1 | 991.6 | 104.6% |
| Development Expenditure | 1,803.0 | 1,775.6 | 98.5% |
| - Locally financed | 1,370.8 | 1,461.7 | 106.6% |
| - Foreign financed | 432.2 | 313.8 | 72.6% |
| Indicator | Oct 2024 | Oct 2025 | Annual Growth | Target Implications |
| Extended Broad Money (M3) | TZS 49,243 bn | TZS 59,807 bn | 21.5% | Strong liquidity |
| Private Sector Credit | TZS 36,518 bn | TZS 42,387 bn | 16.1% | Robust business lending |
| Reserve Money | TZS 11,766 bn | TZS 15,087 bn | 28.2% | Adequate monetary base |
| Foreign Currency Deposits | USD 4,753 m | USD 5,662 m | 19.1% | Confidence in banking |
| Economic Sector | Annual Growth Rate | Share of Total Credit (%) |
| Mining and quarrying | 29.7% | - |
| Agriculture | 25.6% | 12.9% |
| Hotels and restaurants | 23.2% | 8.6% |
| Trade | 21.8% | 13.2% |
| Transport & communication | 18.7% | 4.6% |
| Building & construction | 14.2% | 4.5% |
| Personal loans | 11.3% | 36.4% |
| Manufacturing | 5.2% | 8.5% |
| Rate Type | Oct 2024 | Oct 2025 | Change |
| Central Bank Rate (CBR) | 5.75% | 5.75% | Unchanged |
| Overall Lending Rate | 15.67% | 15.19% | -0.48% |
| Short-term Lending (up to 1 year) | 16.06% | 15.50% | -0.56% |
| 12-month Deposit Rate | 10.41% | 9.21% | -1.20% |
| Overall Deposit Rate | 8.25% | 8.36% | +0.11% |
| Treasury Bill Rate (Overall) | 11.55% | 6.27% | -5.28% |
| Interest Rate Spread | 5.65% | 6.28% | +0.63% |
| Account | 2024 (USD Million) | 2025 (USD Million) | Change |
| Current Account Deficit | -2,893.3 | -2,217.8 | Improved by 23.3% |
| Exports of Goods | 8,461.5 | 10,137.9 | +19.8% |
| - Gold exports | 3,308.9 | 4,596.5 | +38.9% |
| - Traditional exports | 1,148.3 | 1,438.2 | +25.2% |
| Imports of Goods | 14,114.1 | 14,608.0 | +3.5% |
| Services (Tourism) | 6,672.0 | 6,910.8 | +3.6% |
| Foreign Reserves | USD 5,546.9 m | USD 6,171.1 m | +11.2% |
| Import Cover | 4.5 months | 4.7 months | Above target |
| Period | TZS/USD Rate | Annual Change |
| October 2024 | 2,693.1 | -8.9% (depreciation) |
| October 2025 | 2,451.6 | +9.5% (appreciation) |
| Indicator | Sept 2025 | Oct 2025 | Change |
| Total Food Stocks | 570,519 tonnes | 593,485 tonnes | +22,966 tonnes |
| Maize Purchased | - | 24,400 tonnes | Increased stocks |
| Maize Released | - | 1,434 tonnes | Minimal distribution |
| Crop | Price Change |
| Maize | Variable increase |
| Rice | Moderate increase |
| Beans | Significant increase |
| Sorghum | Sharp increase |
| Finger millet | Notable increase |
| Debt Category | Amount | Share of Total | Change from Previous Year |
| Total National Debt | USD 50,932 million | 100% | -0.1% |
| External Debt | USD 35,386 million | 69.5% | -0.7% |
| - Central Government | USD 28,833 million | 81.7% | Increased |
| - Private Sector | USD 5,846 million | 16.5% | Stable |
| Domestic Debt | TZS 38,115 billion | - | +1.8% |
| Category | Amount (USD Million) | Trend |
| External Debt Service | 220.5 | Monthly payment |
| - Principal Repayment | 169.3 | 76.8% of total |
| - Interest Payments | 51.2 | 23.2% of total |
| Priority Sector | Budget Allocation (%) | Credit Growth (%) | Alignment |
| Manufacturing | 18.12% | 5.2% | ❌ Weak alignment |
| Agriculture | 3.36% | 25.6% | ✓ Strong alignment |
| Mining | Not specified | 29.7% | ✓ Very strong |
| Tourism | 0.64% | 23.2% (Hotels) | ✓ Strong alignment |
| Trade | Not specified | 21.8% | ✓ Strong |
| Transport | Major allocation | 18.7% | ✓ Good alignment |
| Indicator | Amount (TZS Billion) | % of Target |
| Total Revenue | 9,677.8 | 105.2% |
| Total Expenditure | 12,191.1 | 95.7% |
| Budget Deficit | -2,513.2 | - |
| Grants | 266.6 | 133.2% |
| Net Deficit | -2,246.7 | - |
| Source | Amount (TZS Billion) | Share (%) |
| Foreign Financing | 1,320.6 | 45.6% |
| Domestic Financing | 1,575.4 | 54.4% |
| Total Financing | 2,896.0 | 100% |
| Area | Target | Current Status | Impact |
| Inflation Control | 3-5% | 3.5% | Positive for households |
| Revenue Collection | Target | 106.1% achievement | Enables service delivery |
| GDP Growth Projection | 6.0% | On track (5.5% in 2024) | Job creation continuing |
| Foreign Reserves | 4.0+ months | 4.7 months | Exchange rate stability |
| Credit Growth | Positive growth | 16.1% | Business expansion supported |
| Current Account | Improvement | Deficit down 23.3% | Stronger economy |
| Challenge | Current Status | Impact on Households/Businesses |
| Food Inflation | 7.4% (up from 2.5%) | Higher food costs for families |
| Manufacturing Credit | Only 5.2% growth | Not matching budget priority of 18.12% |
| Foreign-Financed Projects | 72.6% execution | Some infrastructure delays |
| Interest Rate Spread | 6.28% (widened) | Higher borrowing costs |
| Food Prices | Staples increasing | Household budgets strained |
Tanzania's 2025/26 budget of TZS 56.49 trillion lays a robust foundation for sustained economic progress, targeting 6.0% GDP growth, inflation within 3-5%, and domestic revenue at 16.7% of GDP. For households, this translates into continued macroeconomic stability, with benefits from substantial allocations to education (TZS 444.7 billion), healthcare (TZS 414.7 billion), fertilizer subsidies (TZS 708.6 billion), and rural electrification/energy projects (TZS 2.2 trillion). These measures should ease cost-of-living pressures, particularly for low-income and rural families, by reducing out-of-pocket expenses on essentials and supporting agricultural livelihoods. Tax reliefs—such as reduced motorcycle fees, zero-rated VAT on fertilizers and textiles, and lower online purchase VAT—further bolster disposable incomes. However, persistent food inflation (7.4% as of October 2025) and new levies (e.g., TZS 10 per litre fuel levy) remain challenges, disproportionately affecting middle-income urban households reliant on transport and energy.
For businesses, the budget signals strong government commitment through high development expenditure execution (98.5%), private sector credit growth (16.1%), and sectoral priorities in manufacturing (18.12% allocation), agriculture, energy, and infrastructure. Opportunities abound in export-led growth (19.8%), shilling appreciation (9.5%), and incentives like faster VAT refunds and exemptions for local producers. Yet gaps persist, notably low credit growth to manufacturing (5.2%) despite its prominence, alongside higher tax burdens (e.g., 1% Alternative Minimum Tax, 10% withholding on retained earnings) that could constrain reinvestment, especially for SMEs.
Looking ahead to 2026, successful implementation could deliver tangible gains: accelerated job creation and income growth for households, improved infrastructure reducing operational costs for businesses, and a narrower fiscal deficit supporting overall stability. Early indicators—strong revenue collection (106.1%), export performance, and liquidity—position the economy well to achieve these targets, fostering higher productivity and shared prosperity.
However, this positive outlook is now overshadowed by the political situation arising from the October 2025 elections. President Samia Suluhu Hassan's declared landslide victory (over 97% of the vote) has faced widespread disputes, including the exclusion of main opposition candidates, allegations of irregularities such as ballot stuffing, internet blackouts, and a severe post-election crackdown. This has sparked widespread protests, with reports of hundreds killed, mass arrests, internet restrictions, and international criticism from organizations including the UN, AU, and SADC. Persistent tensions, heightened security, bans on protests, and opposition demands for a transitional government create considerable uncertainty as of December 2025. This political instability threatens to deter foreign investment, disrupt tourism and trade, undermine business confidence, and divert public resources—potentially jeopardizing inflation management, credit availability, and infrastructure advancements vital for households and businesses in 2026.
In summary, although the budget offers a progressive structure for inclusive growth, achieving its benefits in 2026 hinges on quickly resolving the ongoing political crisis to rebuild stability and confidence. Absent such resolution, short-term economic interruptions may eclipse the intended long-term advantages for Tanzanian households and businesses.
Before one dives into the policy debates and legal frameworks, one can feel the tension almost everywhere, from the boardrooms of Dar es Salaam to the dusty bus stands in Kigoma. Tanzanians are trying to make sense of an economy that is full of ambition but stretched at the seams.
The government faces a tightening borrowing space just as infrastructure demands climb higher, and state-owned enterprises quietly struggle behind the scenes, carrying losses that don’t always make the evening news.
People sense that the country has the talent, the ambition, and even the legal tools to do better; what’s missing is a home, one decisive institution, where partnerships, investment, and public enterprises can be aligned with the urgency of this moment.
That is the real heart behind the proposal for the Ministry of Public Partnerships and Public Enterprises: a recognition that Tanzania has reached a point where coordination, commercial discipline, and strategic collaboration are no longer optional; they’re the only path forward.
The case for establishing the Ministry of Public Partnerships and Public Enterprises grows stronger each time Tanzania confronts the limits of its traditional investment model. The economic pressure President Samia Suluhu Hassan has spoken about openly is not rhetorical; it’s something officials feel every time they look at borrowing ceilings or attempt to stretch limited public funds across competing priorities.
With Vision 2050 aiming for a $1 trillion economy, it becomes impossible to ignore that the current institutional arrangement spreads responsibilities so thin that even the best policies struggle to gain traction.
Across the country, more than 270 state-owned enterprises operate in a structure that is both vast and fragile. They sit under the Office of the Treasury Registrar, a system that was designed for oversight but not necessarily for modern commercial performance.
You see the consequences in the numbers: average returns of just 2.8%, recurring losses in major SOEs, and a dependency on government support that drains fiscal space needed for other priorities. Young professionals inside these enterprises speak of wanting to modernize, to compete, to partner with the private sector, yet they often face procedural complexities that would challenge even the most seasoned investor.
At the same time, Tanzania’s Public-Private Partnership Centre has been trying to scale the country’s PPP agenda, working through more than 84 projects at various stages. These are projects with massive potential, roads, ports, power plants, and digital infrastructure, but the Centre operates somewhat in isolation, caught between ministerial boundaries that limit its speed and authority.
It is not for lack of expertise; it is the fragmentation that slows everything down. Some PPPs take up to five years just to complete preparation, a timeline that drains momentum from both the government and investors.
The idea behind a consolidated ministry is not to create another bureaucratic silo, but to build a central command structure capable of pulling all these threads together. By placing the PPP Centre and the Treasury Registrar under one roof, the government would finally have a single institution responsible for structuring partnerships, commercializing public enterprises, and building investor confidence. It would be the place where public ambition and private capital meet, efficiently, transparently, and at a pace that matches the country’s aspirations.
This reform is not simply administrative. It is personal for the many civil servants who know how hard it is to push projects uphill through scattered channels. It is personal for communities waiting for new power lines, modern ports, or faster transport corridors. And it is deeply personal for a government that knows the political stakes of moving too slowly.
One of the biggest challenges for Tanzania’s development path has been the performance gap within its SOEs. They are expected to deliver essential services, generate revenue, and contribute to national growth, yet a significant number rely heavily on government bailouts.
When you talk privately to SOE managers, many admit they want to operate more commercially, competing, partnering, and innovating, but are held back by outdated structures or slow-moving processes that dampen initiative.
The proposed ministry aims to change that culture from the ground up. By placing SOE governance, commercialization, and partnership development under a shared institutional umbrella, the government signals a shift from caretaking to performance.
SOEs would be encouraged, even required, to explore PPP models that bring in outside expertise and reduce government exposure. This is not theoretical; the potential is already visible in early examples. Tanesco’s exploration of private partnerships in generation, or the Tanzania Ports Authority’s interest in collaborative infrastructure development, shows that parts of the system are ready for a more competitive, commercially oriented future.
But unlocking this future requires more than policy; it requires capacity. That is why the proposal also emphasizes professional training, such as CP3P certification programs already outlined in the Tanzania PPP Strategy.
Executives trained in PPP structuring become more confident in negotiating complex contracts, evaluating risks, and understanding investor expectations. When SOE leaders see successful projects unfold, like the ongoing PPP pilots in energy and transport, their appetite for similar ventures grows.
And that appetite has national significance. Tanzania needs SOEs that can turn infrastructure assets into real value, not recurring liabilities. Better-performing SOEs not only ease fiscal pressures; they also improve credit ratings, attract new investors, and boost the country’s reputation as a reliable economic partner.
In a region where Kenya and others are consolidating similar functions to streamline partnerships, Tanzania cannot afford to maintain a system that works in slow motion while the global investment landscape accelerates.
What people often forget is that PPPs are not simply financial instruments; they are relationships. They require trust, clarity, and long-term commitment between government institutions and private entities.
A ministry dedicated to cultivating that relationship gives Tanzania a foundation for more mature partnerships that endure beyond political cycles. It makes collaboration a norm rather than an exception.
Every year, Tanzania invests billions into infrastructure and public enterprises, yet the returns remain far below potential. The country’s debt levels, hovering between 40 and 48% of GDP, are manageable but tightening, while domestic borrowing risks crowding out private sector credit unless structural reforms are made. As one senior economist recently noted, “the issue is not the size of the debt, but the pace of future needs.” That pace is quickening.
PPPs offer a way out of this bind, not by replacing public investment but by rebalancing it. When structured well, PPPs mobilize private capital, transfer appropriate risks, and deliver infrastructure faster than traditional models.
Tanzania’s own ambitions reflect this: recent initiatives target mobilizing up to TZS 25 trillion, roughly $9 billion, in private financing. Yet achieving these targets will require a ministry that can shorten project preparation cycles, provide consistent oversight, and maintain a direct line to the highest levels of government.
This is where the Ministry of Public Partnerships and Public Enterprises becomes a game-changer. Instead of allowing projects to drift through fragmented institutions, the ministry would create a unified pipeline, identifying flagship projects, accelerating approvals, coordinating with international partners, and ensuring SOEs are aligned with national priorities. Faster preparation means faster financial close. Faster close means earlier job creation, earlier service delivery, and earlier contributions to growth.
The economic ripple effects could be transformative. GDP growth, already projected at 6.1% in 2025, could push beyond 7% with efficient PPP delivery. Private sector credit could rise toward the needed 25% of GDP as the government shifts away from heavy domestic borrowing. And for credit-rating agencies that view institutional coherence as a key metric, this reform could be the signal that Tanzania is serious about disciplined, long-term public investment.
In everyday terms, it means better roads, more reliable electricity, modern ports, expanded water systems, and digital infrastructure that supports businesses and communities. It means the state stops carrying losses from underperforming enterprises and starts generating revenue from commercially oriented partnerships. And most importantly, it means people feel the benefits, not in distant projections, but in the daily functioning of their economy.
The proposal for the Ministry of Public Partnerships and Public Enterprises is ultimately about giving Tanzania the tools to match its own ambition. It recognizes that the country is sitting on extraordinary potential, strong legal frameworks, a strategic location, a growing young workforce, and investor interest that many nations would envy.
What has been missing is a single institution capable of weaving these strengths into a coherent, rapid, and commercially minded strategy. With this ministry, Tanzania positions itself not only to meet the demands of Vision 2050 but to set a continental standard for how public and private sectors can build a nation’s future together.
As the global economy moves toward 2030, it is increasingly shaped by the interaction between geoeconomic forces and the pace of technological transformation. The World Economic Forum’s December 2025 white paper, Four Futures for the New Economy, presents a structured framework that explores how differing levels of geopolitical stability and technology adoption could redefine global growth, trade, labor markets, and institutional trust over the next decade. Central to this analysis are disruptive technologies such as artificial intelligence, automation, and digital platforms, whose diffusion patterns will determine whether economies converge toward shared prosperity or fragment into rival spheres.
Globally, the paper identifies four plausible scenarios—Digitalized Order, Cautious Stability, Tech-based Survival, and Geotech Spheres—each reflecting a distinct combination of stable versus volatile geoeconomics and fast versus slow technology adoption. These scenarios project diverging trajectories for key indicators, including GDP growth, supply chain resilience, wage polarization, energy volatility, and public trust. With global GDP growth anchored around a modest 3.2% baseline in 2025, the report warns that without inclusive and well-governed technological integration, productivity gains may be offset by rising inequality and geopolitical risk.
For Tanzania, these global futures carry particularly significant implications. Entering 2025 with relatively strong macroeconomic fundamentals—GDP growth of about 6.0%, rising foreign direct investment, improving energy access, and comparatively high trust in public institutions—Tanzania stands at a strategic crossroads. The country’s economic structure, with agriculture contributing roughly 30% of GDP and a growing digital and services sector, makes it both resilient and vulnerable to global fragmentation. Rapid technology adoption could accelerate productivity in agriculture, mining, tourism, and public services, potentially lifting growth above 7%. Conversely, slow or uneven diffusion amid geopolitical shocks could expose Tanzania to trade disruptions, skills mismatches, and widening urban–rural divides.
By integrating the WEF’s global scenarios with Tanzania-specific data and development realities, this analysis provides a forward-looking lens for policymakers, investors, and businesses. It highlights not only how global transformations may shape Tanzania’s economic trajectory by 2030, but also how strategic choices made today—on technology governance, human capital, regional integration, and institutional resilience—will determine whether Tanzania emerges as a beneficiary or a casualty of the new global economic order. Read More: Risks to global growth with potentially disrupt the recovery or slow down economic expansion in '24
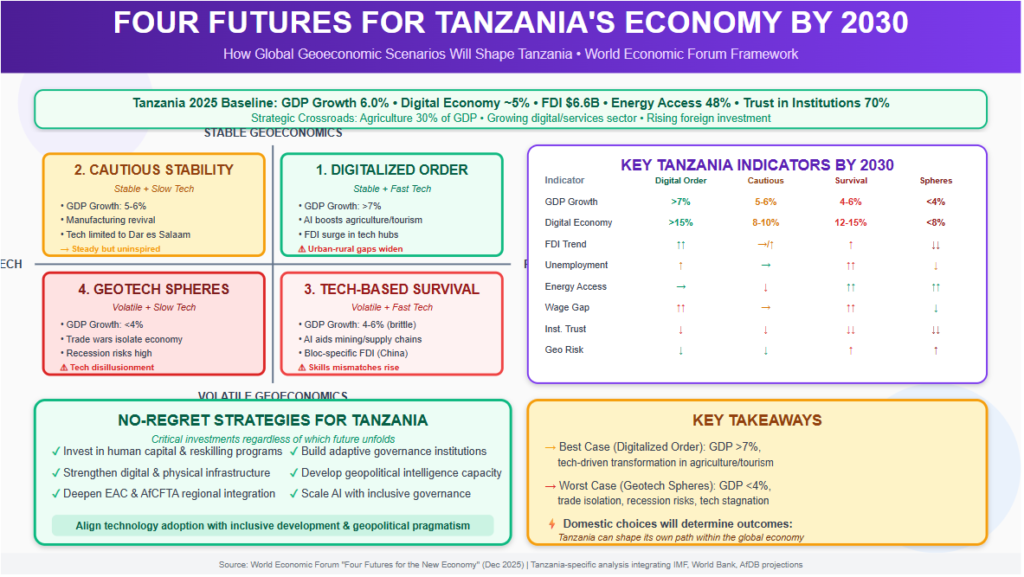
| Indicator | Baseline (2025) | Digitalized Order | Cautious Stability | Tech-based Survival | Geotech Spheres |
| Geopolitical risk index | 149.1 | ↓ | ↓ | ↑ | ↑ |
| Share of business tasks by technology (%) | 22% | ↑ | ↑ | ↑ | → |
| GDP growth (annual %) | 3.2% | ↑ | → | → | ↓ |
| Supply chain pressure index | -0.01 | ↓ | ↓ | ↑ | ↑ |
| US effective average tariff rate (%) | 17% | ↑ | →/↑ | ↑ | ↑ |
| Wage polarization (D9/D1 ratio) | 16.8 | ↑ | → | ↑ | ↓ |
| Energy price volatility (absolute monthly % change) | 3.7% | → | ↓ | ↑ | ↑ |
| Trust in media (% of population) | 52% | ↓ | ↓ | ↓ | ↓ |
Sources: WEF paper (e.g., IMF for GDP, ILO for wages).
Directional changes relative to 2025 baselines, adapted to local context (e.g., digital share proxies tech tasks, energy access adapts volatility, trust in institutions adapts media trust). Projections informed by IMF, World Bank, AfDB, and Tanzania-specific outlooks.
| Indicator | Baseline (2025) | Digitalized Order | Cautious Stability | Tech-based Survival | Geotech Spheres |
| GDP Growth (annual %) | 6.0% | ↑↑ (>7%, tech-driven exports) | → (5-6%, steady but uninspired) | → (brittle, 4-6% with shocks) | ↓↓ (<4%, recession risks) |
| Digital Economy Share (% of GDP) | ~5% | ↑↑ (>15%, AI in agriculture/tourism) | ↑ (limited, 8-10%) | ↑↑ (12-15%, survival tools) | → (stagnant, <8%) |
| Unemployment Rate (%) | ~2.8% (youth ~9%) | ↑ (disruption, but reskilling offsets) | → (stable, low tech impact) | ↑↑ (skills mismatches) | ↓ (localization creates jobs) |
| Foreign Direct Investment (FDI, $bn) | ~6.6 | ↑ (tech hubs attract) | →/↑ (stable aid flows) | ↑ (bloc-specific, e.g., China) | ↓↓ (isolationism deters) |
| Energy Access (% population) | ~48% | → (cooperative renewables) | ↓ (stalled green tech) | ↑↑ (volatile, but AI-optimized) | ↑↑ (spikes, resource nationalism) |
| Geopolitical Risk (e.g., EAC tensions) | Medium | ↓ | ↓ | ↑ | ↑ |
| Wage Polarization (urban/rural gap) | High | ↑↑ | → | ↑↑ | ↓ |
| Trust in Institutions (%) | ~70% | ↓ (misinformation risks) | ↓ | ↓↓ | ↓↓ |
Sources: IMF (GDP, unemployment), World Bank/AfDB (FDI, energy access), GSMA/UNCTAD estimates (digital share), Afrobarometer (trust), local reports (wage gaps, geopolitical risk subjective).
The WEF's global descriptions are adapted below with Tanzania-specific insights, focusing on how local factors (e.g., 30% GDP from agriculture, Belt and Road investments, National AI Strategy) interact with worldwide trends.
| Scenario | Top Risks (Global / Tanzania) | Top Opportunities (Global / Tanzania) | Strategy Considerations (Global / Tanzania) |
| Digitalized Order | Tech displacement; inequality / Displacement in agriculture; AI misuse in elections. | Productivity leapfrogging; digital hubs / Tourism/mining productivity; EAC interoperability. | Global strategies; scale innovation / Scale AI; reskilling via TAIC; governance. |
| Cautious Stability | Frontier-laggard inequality; weak dynamism / Urban-rural gaps; poor FDI returns. | Incremental innovation; emerging shifts / Manufacturing revival; stable aid. | Core R&D/M&A; dynamic markets / Infrastructure resilience; explore AfCFTA. |
| Tech-based Survival | Cyber risks; politicization / Infrastructure chokepoints; trade politicization. | Alliances; onshoring / Multi-sourcing; AI risk management. | Government alignment; localization / Regional strategies; local talent. |
| Geotech Spheres | Conflict escalation; innovation deserts / EAC conflicts; talent protectionism. | Backed sector growth; agility / Gas sector subsidies; non-aligned ties. | National alignment; partnerships / Domestic focus; cross-EAC alliances. |
WEF's global strategies, tailored for Tanzania:
This integration underscores Tanzania's potential to outpace global growth in optimistic scenarios while emphasizing resilience against volatility for inclusive development.
The four futures outlined by the World Economic Forum do not represent fixed destinies, but rather plausible pathways shaped by policy decisions, institutional capacity, and strategic coordination between the public and private sectors. For Tanzania, the analysis underscores a critical insight: while global forces will influence outcomes, domestic choices will ultimately determine how these forces translate into growth, inclusion, and resilience.
In optimistic scenarios such as Digitalized Order, Tanzania has the potential to outperform global averages by leveraging technology to modernize agriculture, expand digital services, and attract technology-driven investment. However, even in such favorable conditions, risks related to inequality, skills displacement, and governance failures remain significant. In more adverse futures—particularly Tech-based Survival and Geotech Spheres—the costs of geopolitical fragmentation, constrained technology diffusion, and declining trust could sharply limit growth and development gains.
The most important lesson across all scenarios is the value of “no-regret” strategies. Investing in human capital, strengthening digital and physical infrastructure, deepening regional integration through the EAC and AfCFTA, and building adaptive institutions can help Tanzania remain resilient regardless of which global future unfolds. By aligning technology adoption with inclusive development and geopolitical pragmatism, Tanzania can position itself not merely to withstand uncertainty, but to shape its own path within an increasingly complex global economy.
As of November 2025, the Bank of Tanzania (BoT) recorded total assets of TZS 29.67 trillion (approximately USD 12 billion), liabilities of TZS 26.85 trillion, and equity of TZS 2.83 trillion, featuring a remarkable increase in gold holdings (over TZS 4.67 trillion combined) and cash equivalents (TZS 4.45 trillion) driven by record gold sales and tourism revenue—this directly reflects Tanzania's strong economic performance in 2025, with GDP growth of 6.0–6.3%, inflation below 3.4%, and foreign exchange reserves of USD 6–7 billion (4.7 months of import cover). The BoT plays a critical role in managing the economy through monetary policies, such as purchasing domestic gold, controlling currency in circulation (TZS 9.7 trillion), and extending loans to the private sector to stimulate investment and sustainable development.
If this trend continues into 2026, in line with IMF projections (GDP growth of 6.3%), BoT assets are expected to reach TZS 32–35 trillion, liabilities to remain well-managed below TZS 30 trillion, and equity to strengthen above TZS 3 trillion—signaling a steadily growing and resilient economy. In comparison, the Central Bank of Kenya (CBK) holds total assets of approximately KES 2 trillion (USD 15–16 billion) with foreign reserves of around USD 12 billion (5.2–5.3 months of import cover) as of December 2025; while the CBK offers stronger liquid foreign reserves for greater protection against shocks, the BoT's gold-focused strategy provides a hedge against global price volatility, with both institutions contributing to their countries' growth (Kenya projected at 5.0–5.3% in 2026) through effective inflation control and credit stimulation. Read More: Central Bank Asset Dynamics and Tanzania’s Macroeconomic Performance in 2025–2026
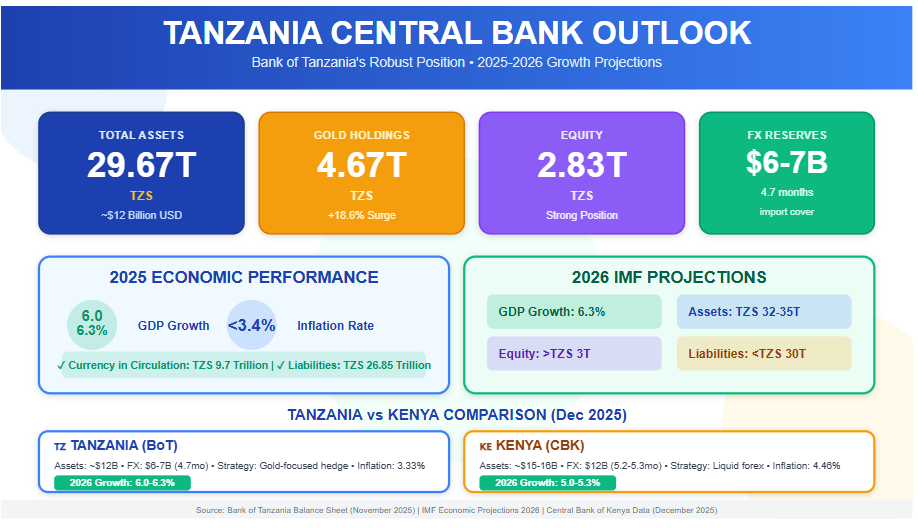
In East Africa, the Bank of Tanzania (BoT) and the Central Bank of Kenya (CBK) stand as critical institutions steering their respective economies toward stability and expansion. As of December 2025, both nations exhibit resilient growth trajectories, with Tanzania's GDP expanding by 5.6% in FY2024/25 and projections for 6.0-6.3% in 2025-2026, while Kenya anticipates 5.3% growth in 2025 amid controlled inflation. These figures reflect the central banks' pivotal roles in fostering economic development through monetary policy, reserve management, and financial stability. However, Tanzania's post-election political turmoil in late 2025 introduces risks that could dampen its 2026 outlook, underscoring the interplay between governance and economic progress. This article examines the functions of BoT and CBK in driving growth, offers a comparative lens, and explores how Tanzania's political dynamics might influence its economic path forward.
The BoT, established under the Bank of Tanzania Act of 2006, serves as the guardian of monetary stability while actively supporting broader economic growth. Its primary mandate includes formulating and implementing monetary policy to maintain low inflation—currently at 3.33% in 2025—and ensuring financial system soundness. Beyond price stability, the BoT contributes to development by developing financial markets, promoting inclusive finance, and accumulating foreign reserves to buffer against external shocks. For instance, its November 2025 balance sheet reveals total assets of TZS 29.67 trillion (approximately USD 12 billion), bolstered by an 18.6% surge in gold holdings to TZS 4.67 trillion, reflecting strategic purchases from domestic miners to diversify reserves and support the mining sector—a key driver of Tanzania's export-led growth.
By managing currency in circulation (TZS 9.7 trillion as of November) and extending loans to the private sector (up 62% month-on-month to TZS 1.35 trillion), the BoT stimulates investment in agriculture, tourism, and manufacturing, which employ over 65% of the workforce. In January 2025's Monthly Economic Review, the BoT emphasized aligning monetary policy with growth objectives, such as sustaining reserves at USD 6.17 billion (4.7 months of import cover) to enhance investor confidence and facilitate infrastructure projects like LNG developments. These efforts have helped Tanzania achieve resilient GDP growth despite global headwinds, positioning the bank as a catalyst for long-term development through policies that encourage savings, credit access, and economic diversification.
Similarly, the CBK, mandated by Article 231 of Kenya's Constitution, prioritizes price stability while promoting economic growth and public interest. It formulates monetary policy, issues currency, and regulates the financial sector to foster a stable environment for investment. As of December 2025, the CBK lowered its Central Bank Rate (CBR) to 9.00% from previous levels, aiming to stimulate economic activity, support SMEs, and boost lending amid inflation of 4.46% in November—well within its 2.5-7.5% target. This proactive stance, as outlined in its bi-annual Monetary Policy Statements, regulates money supply growth in line with GDP targets, using tools like Open Market Operations and a Cash Reserve Ratio of 3.25% to manage liquidity.
The CBK's foreign exchange reserves stand at approximately USD 12 billion (5.2-5.3 months of import cover), providing a stronger buffer than Tanzania's and enabling interventions to stabilize the Kenyan Shilling. By encouraging long-term investments and maintaining deflation-free conditions, the bank supports key sectors like agriculture, services, and manufacturing, which have driven Kenya's consistent GDP expansion. For example, its role in currency issuance and management ensures efficient transactions, while financial inclusion initiatives have expanded access to credit, contributing to poverty reduction and job creation. Overall, the CBK acts as an economic enabler, balancing stability with growth to position Kenya as a regional hub.
While both central banks share core functions like inflation control and reserve management, their approaches reflect national economic structures. Tanzania's BoT emphasizes commodity diversification, with gold comprising a significant portion of reserves, aligning with its mining-dependent economy. In contrast, Kenya's CBK relies more on liquid foreign currency holdings, suiting its service-oriented market with higher external trade volumes.
| Aspect | Bank of Tanzania (BoT) | Central Bank of Kenya (CBK) |
| Total Assets (est. Dec 2025) | ~USD 12 billion (TZS 29.67 trillion, Nov data) | ~USD 15-16 billion (KES ~2 trillion est.) |
| FX Reserves | ~USD 6-7 billion (4.7 months import cover) | ~USD 12 billion (5.2-5.3 months cover) |
| Key Growth Focus | Gold purchases, private sector lending; supports mining/tourism | Rate cuts for SMEs; stabilizes services/manufacturing |
| Inflation (2025) | 3.33% | 4.46% (Nov) |
| Policy Tools | Domestic gold acquisition, monetary easing | CBR at 9%, Open Market Operations |
| GDP Contribution | Enables 6%+ growth via reserves buildup | Sustains 5%+ growth through liquidity |
This table highlights Kenya's edge in reserve depth for external resilience, while Tanzania's strategy hedges against volatility through gold. Both institutions have effectively contained inflation below 5%, fostering environments conducive to investment and poverty alleviation.
Tanzania's political stability, once a regional benchmark, has been shaken by the October 2025 general elections, marred by allegations of irregularities and resulting in widespread protests. President Samia Suluhu Hassan secured re-election, but opposition parties like Chadema have decried the process as fraudulent, calling for a UN-overseen transitional government. Post-election violence led to a lethal crackdown by security forces, with UN experts condemning systematic human rights violations, including killings and digital restrictions. By December 2025, the government imposed nationwide protest bans, tightened security, and urged the military to remain apolitical amid escalating tensions.
This unrest could jeopardize Tanzania's 2026 economic projections of 6.1-6.3% GDP growth. Prolonged instability might deter foreign investment, disrupt tourism (a key forex earner), and strain fiscal resources through heightened security spending. If protests escalate, supply chain disruptions could inflate food prices, pushing inflation above the 3-5% target and eroding purchasing power. Moreover, international scrutiny from bodies like the UN and African Union could lead to sanctions or reduced aid, impacting reserves and infrastructure projects. However, if the government addresses grievances through dialogue—as hinted in recent calls for military professionalism—stability could return, allowing the BoT's policies to sustain growth amid global trade tensions.
The BoT and CBK exemplify how central banks can drive economic development by balancing stability with proactive growth measures, from reserve diversification in Tanzania to rate adjustments in Kenya. Their efforts have positioned both nations for robust 2025-2026 performance, with low inflation and adequate buffers against external risks. Yet, Tanzania's political volatility post-2025 elections poses a wildcard, potentially hindering 2026 growth through investor flight and fiscal strain. For sustained progress, addressing governance issues will be as crucial as monetary policy, ensuring these East African powerhouses continue their upward trajectories.