
Currency Appreciation Anchors Price Stability and Economic Confidence
Tanzania's price stability in November 2025 was firmly anchored by a strengthening shilling and credible monetary policy framework. The Tanzanian Shilling appreciated significantly from TZS 2,460.54/USD in October to TZS 2,444.81/USD in November, representing a month-on-month gain of TZS 15.73. More impressively, the currency posted an 8.1% year-on-year appreciation, completely reversing the 6.3% depreciation recorded a year earlier.
This currency strength, backed by robust foreign reserves of USD 6.43 billion (equivalent to 4.9 months of import cover), created favorable conditions for price stability. Headline inflation remained firmly contained at 3.4%, comfortably within the Bank of Tanzania's 3-5% target range, while core inflation stood at just 2.3%, signaling subdued demand-side pressures and well-anchored inflation expectations.
The appreciating shilling effectively dampened imported inflation pressures, particularly for fuel and consumer goods. Petrol prices declined to approximately TZS 2,883 per liter, reducing transportation and production costs across the economy. Energy and fuel inflation moderated to 3.8% from 4.0%, while stable foreign exchange availability—evidenced by IFEM turnover of USD 158.7 million—ensured smooth import financing without cost-push shocks.
Headline inflation at 3.4% remains well within the Bank of Tanzania's 3-5% target range, demonstrating effective monetary policy transmission and the stabilizing impact of currency appreciation on import prices. Core inflation at 2.3% confirms that underlying price pressures are subdued, with no signs of demand-driven overheating.
| Indicator | October 2025 | November 2025 | Implication |
|---|---|---|---|
| Average Exchange Rate (TZS/USD) | 2,460.54 | 2,444.81 | Shilling Appreciated |
| Month-on-Month Change | — | –15.73 TZS | Reduced Depreciation Pressure |
| Year-on-Year Change | — | +8.1% Appreciation | Reversal from 6.3% Depreciation (Nov 2024) |
| FX Reserves | — | USD 6,432.9 million | 4.9 Months Import Cover |
| Inflation Measure | November 2024 | October 2025 | November 2025 |
|---|---|---|---|
| Headline Inflation (%) | 3.0 | 3.5 | 3.4 |
| Core Inflation (%) | 3.3 | 2.1 | 2.3 |
| Energy, Fuel & Utilities (%) | 5.7 | 4.0 | 3.8 |
| Food Inflation | Elevated | Moderating | Moderating |
The strengthening Tanzanian Shilling has been instrumental in containing imported inflation through multiple transmission channels.
| Transmission Channel | Evidence from Data | Inflation Impact |
|---|---|---|
| Import Price Channel | Shilling appreciated YoY by 8.1% | ✓ Lower Imported Inflation |
| Fuel Price Effect | Petrol fell to TZS 2,883/litre | ✓ Reduced Transport & Production Costs |
| Exchange Rate Pass-Through | Pass-through subdued and controlled | ✓ Limited Price Shocks |
| FX Availability | IFEM turnover USD 158.7 million | ✓ Stable Import Financing |
Impact: Lower fuel costs reduce transportation expenses, manufacturing costs, and second-round inflation effects across the economy.
Impact: Stronger shilling makes imports cheaper in TZS terms, directly lowering costs for consumer goods, raw materials, and capital equipment.
Impact: Liquid FX market ensures smooth import financing without exchange rate volatility that could trigger price adjustments.
The 8.1% shilling appreciation has effectively reduced the TZS cost of imported goods, particularly fuel and consumer products. This has been a primary factor in keeping headline inflation within target despite global commodity price pressures. The transmission has been smooth and effective, demonstrating the importance of exchange rate stability for price control.
| Monetary Policy Indicator | Value | Relevance to Inflation Control |
|---|---|---|
| Central Bank Rate (CBR) | 5.75% | Anchors inflation expectations; accommodative stance |
| 7-Day IBCM Rate | 6.15% | Within policy corridor; effective transmission |
| Policy Target | Inflation 3-5% | ✓ Achieved (3.4%) |
| FX Intervention (Nov 2025) | USD 52.5 million net sale | Smoothed FX volatility; supported stability |
The relationship between currency stability and inflation control demonstrates a mutually reinforcing dynamic that has anchored Tanzania's macroeconomic performance.
| Performance Indicator | November 2025 Outcome | Inflation Effect |
|---|---|---|
| Exchange Rate | Appreciated 8.1% YoY | ✓ Lower Import-Driven Inflation |
| Fuel Prices | Declining to TZS 2,883/L | ✓ Reduced Second-Round Effects |
| Core Inflation | Fell to 2.3% | ✓ Demand Pressures Subdued |
| Headline Inflation | Stable at 3.4% | ✓ Within Target Range |
| Food Supply | Improved | ✓ Offset Food Price Shocks |
| FX Reserves | USD 6.43 billion (4.9 months) | ✓ Shields Against External Shocks |
Strong exports → FX inflows → Currency appreciation → Lower import costs → Contained inflation → Anchored expectations → Investment confidence → Economic growth
This positive feedback loop demonstrates how Tanzania's export-driven growth model, combined with prudent monetary policy, creates a stable macroeconomic environment conducive to sustained development.
Contribution: Currency strength is the primary anchor for price stability, reducing imported inflation and supporting purchasing power.
Contribution: Declining import costs reduce cost-push pressures throughout the supply chain.
Contribution: Credible and accommodative policy framework maintains confidence while supporting growth.
Contribution: Strong reserves provide resilience against external shocks and maintain confidence.
All four pillars of macroeconomic stability are functioning effectively in Tanzania as of November 2025:
The November 2025 data provides compelling evidence that Tanzania's shilling stability has been instrumental in maintaining low and predictable inflation. The 8.1% year-on-year appreciation of the Tanzanian Shilling, supported by strong export performance and adequate foreign reserves of USD 6.43 billion, has effectively anchored price stability across the economy.
Key achievements demonstrate the effectiveness of this framework:
Headline inflation at 3.4% remains comfortably within the Bank of Tanzania's 3-5% target range, with core inflation at just 2.3% signaling well-controlled demand pressures.
✓ Policy SuccessThe appreciating shilling has reduced imported inflation, particularly for fuel (down to TZS 2,883/L) and consumer goods, dampening cost-push pressures.
✓ Import Cost ReliefEffective monetary policy transmission and strategic FX interventions have maintained stability without aggressive tightening, preserving growth momentum.
✓ Balanced ApproachStrong reserves (4.9 months) and improving external balances provide buffer against shocks, supporting sustained stability.
✓ Shock AbsorptionTanzania's macroeconomic performance in November 2025 demonstrates that exchange rate stability, backed by strong fundamentals and credible monetary policy, is a powerful anchor for inflation control. The appreciating shilling has:
This virtuous cycle—where strong exports generate FX inflows, strengthen the currency, lower import costs, and contain inflation—positions Tanzania favorably for continued macroeconomic stability and sustainable growth into 2026.
To maintain this positive trajectory, Tanzania should continue to:
With inflation anchored at 3.4%, currency appreciating, and reserves adequate, Tanzania's macroeconomic framework provides a solid foundation for sustained development and improved living standards.
Currency Appreciation & Sustainable Debt Management Drive Economic Resilience
Tanzania's macroeconomic position in November 2025 demonstrated remarkable resilience, characterized by a strengthening shilling and prudent debt management. The Tanzanian Shilling appreciated significantly from TZS 2,460.54/USD in October to TZS 2,444.81/USD in November, representing a monthly gain of TZS 15.73. More impressively, the currency recorded an 8.1% year-on-year appreciation, reversing the 6.3% depreciation witnessed in late 2024.
This currency stability was underpinned by robust export performance, particularly gold exports which surged 42.1%, alongside overall export growth of 13.1%. The Interbank Foreign Exchange Market (IFEM) showed increased activity with turnover rising to USD 158.7 million, while the Bank of Tanzania strategically sold USD 52.5 million net to smooth market volatility without distorting fundamentals.
National debt management remained disciplined, with total debt standing at USD 51.9 billion and recording modest monthly growth of just 0.4%. Although external debt accounts for 69.7% of the total—predominantly USD-denominated—the appreciating shilling has reduced exchange-rate risks and debt-servicing pressures. Strong foreign reserves of USD 6.43 billion, equivalent to 4.9 months of import cover, ensure debt service obligations are comfortably met.
Strong exports → FX inflows → Shilling appreciation → Lower debt servicing costs → Increased confidence → More investment
This virtuous cycle demonstrates effective policy coordination between export promotion, currency management, and fiscal discipline.
| Indicator | October 2025 | November 2025 | Change |
|---|---|---|---|
| Average Exchange Rate (TZS/USD) | 2,460.54 | 2,444.81 | ▼ 15.73 (Appreciation) |
| Month-on-Month Change | — | Shilling Strengthened by 0.64% | |
| Year-on-Year Change | — | +8.1% Appreciation (Reversed 6.3% depreciation from Nov 2024) | |
| Indicator | October 2025 | November 2025 | Change |
|---|---|---|---|
| Total IFEM Turnover | USD 133.7 million | USD 158.7 million | +18.7% |
| Bank Share of Transactions | — | 66.9% | Dominant market participants |
| BoT Net FX Intervention | — | USD 52.5 million (net sale) | Smoothing volatility |
| Debt Category | Amount | Share |
|---|---|---|
| Total National Debt | USD 51,870.3 million | 100% |
| External Debt | USD 36,127.8 million | 69.7% |
| Domestic Debt | TZS 38,361.3 billion | 30.3% |
| Monthly Debt Growth: 0.4% (Controlled & Sustainable) | ||
| Indicator | Value | Details |
|---|---|---|
| External Debt Stock | USD 36,127.8 million | 69.7% of total debt |
| Public Sector Share | 80.5% | Government & SOEs |
| USD-Denominated Debt | 66.8% | Primary currency exposure |
| Euro-Denominated Debt | Second largest | Diversified currency risk |
High USD Exposure (66.8%): Makes shilling stability critical for debt sustainability. Every 1% depreciation increases TZS-equivalent debt servicing costs.
Current Mitigation: The 8.1% shilling appreciation has reduced exchange rate risk and lowered the TZS cost of servicing USD-denominated debt, creating favorable conditions for debt management.
| Indicator | Value |
|---|---|
| Domestic Debt Stock | TZS 38,361.3 billion |
| Monthly Growth | 0.2% (Very modest) |
| Dominant Instruments | Treasury Bonds (Long-term focus) |
| Major Holders | Commercial Banks & Pension Funds (~56%) |
| External Debt Flow Item | November 2025 (USD million) |
|---|---|
| Loan Disbursements | 200.4 |
| Total Debt Service | 109.0 |
| Principal Repayment | 75.4 |
| Interest Payment (Estimated) | 33.6 |
| Net Position: +USD 91.4 million (Disbursements exceed servicing) | |
The relationship between Tanzania's currency stability and debt dynamics demonstrates a mutually reinforcing cycle of macroeconomic resilience.
| Economic Dimension | November 2025 Evidence | Effect on Shilling & Debt |
|---|---|---|
| Export Performance | Overall exports up 13.1% | ✓ Strengthens FX supply, supports shilling |
| Gold Exports | Surged +42.1% | ✓ Major USD inflows, reduces external pressure |
| Debt Accumulation | Only 0.4% month-on-month growth | ✓ Limited FX demand for debt servicing |
| Domestic Financing | Rising bond issuance in TZS | ✓ Reduces reliance on USD-denominated borrowing |
| Foreign Reserves | USD 6,432.9 million (4.9 months import cover) | ✓ Strong shock absorption capacity |
| Currency Appreciation | +8.1% year-on-year | ✓ Lowers TZS cost of USD-denominated debt |
Implication: Lower imported inflation, enhanced purchasing power, reduced debt servicing burden
✓ Highly PositiveAssessment: High USD exposure mitigated by appreciation, strong reserves, and export growth
✓ Under ControlBenefit: Lower rollover risk, stable funding base, reduced refinancing pressure
✓ SustainableStatus: Above EAC benchmark (4.5 months), provides strong shock absorption capacity
✓ ExcellentThe November 2025 data reveals a robust and mutually reinforcing relationship between Tanzania's currency stability and national debt management. The Tanzanian Shilling's 8.1% year-on-year appreciation, driven by strong export performance—particularly the 42.1% surge in gold exports—has created favorable conditions for managing the country's USD 51.9 billion debt portfolio.
Key achievements include:
The appreciating shilling reduces the TZS-equivalent cost of servicing USD-denominated external debt (66.8% of external debt), directly improving debt sustainability metrics.
Modest 0.4% monthly debt accumulation demonstrates fiscal discipline while meeting development financing needs through positive net flows.
Strong export earnings (13.1% growth) generate sufficient FX to comfortably meet debt service obligations without depleting reserves.
Increasing domestic financing (30.3% of total debt) through long-term TZS bonds reduces exchange rate vulnerability and rollover risks.
Strong exports → FX inflows → Shilling appreciation → Lower debt servicing costs → Improved fiscal space → Increased investor confidence → More foreign investment → Further economic growth
This positive reinforcement cycle, supported by prudent monetary policy, adequate foreign reserves (USD 6.43 billion), and effective Bank of Tanzania interventions, positions Tanzania favorably for sustained macroeconomic stability. The country's financial architecture demonstrates resilience against external shocks while maintaining the flexibility needed for continued development financing.
Tanzania's November 2025 performance reflects a well-managed economy with:
Strong Investor Confidence & Financial Stability Drive Market Performance
Tanzania's financial markets in November 2025 demonstrated exceptional strength, reflecting robust liquidity and high investor confidence. Government securities auctions were significantly oversubscribed, with Treasury Bills attracting bids worth TZS 798.4 billion against a tender of TZS 352.0 billion, representing 2.3 times oversubscription. Treasury Bonds recorded even stronger demand at approximately 3.0 times oversubscription, signaling substantial appetite for risk-free government assets.
Yields edged downward, with T-bill yields declining to 6.25% from 6.27%, indicating easing government borrowing costs and improved market conditions. The government successfully raised TZS 442.7 billion domestically, with 60.5% sourced from long-term bonds, strategically reducing rollover risks and strengthening debt sustainability.
| Indicator | Value |
|---|---|
| Number of Auctions | 2 |
| Total Tender Size | TZS 352.0 billion |
| Total Bids Received | TZS 798.4 billion |
| Amount Accepted | TZS 369.2 billion |
| Oversubscription Ratio | 2.3 times |
| Weighted Average Yield | 6.25% |
| Previous Month Yield | 6.27% |
| Bond Tenor | Tender Size | Total Bids | Accepted | Weighted Avg Yield |
|---|---|---|---|---|
| 5-Year Bond | TZS 174.9 billion | — | — | 10.54% |
| 15-Year Bond | TZS 165.5 billion | — | — | 12.08% |
| Total | TZS 340.4 billion | TZS 1,008.6 billion | TZS 329.3 billion | ≈3.0× oversubscribed |
| Instrument | Amount Raised | Share (%) |
|---|---|---|
| Treasury Bonds | TZS 267.7 billion | 60.5% |
| Treasury Bills | TZS 175.0 billion | 39.5% |
| Total Domestic Financing | TZS 442.7 billion | 100% |
The Interbank Cash Market continued to function smoothly, supported by adequate shilling liquidity and effective monetary policy operations by the Bank of Tanzania.
| Indicator | Value |
|---|---|
| Total Turnover (November) | TZS 1,781.0 billion |
| Previous Month Turnover (October) | TZS 2,255.4 billion |
| Month-on-Month Change | –21.0% |
| Dominant Tenor | 7-day transactions |
| Share of 7-day Transactions | 75.7% |
| Rate Category | October 2025 | November 2025 |
|---|---|---|
| Overall IBCM Rate | 6.38% | 6.30% |
| 7-Day IBCM Rate (Average) | 6.38% | 6.30% |
| Central Bank Rate (CBR) | 5.75% | 5.75% |
| Policy Corridor | ±2 percentage points | ±2 percentage points |
| Indicator | October 2025 | November 2025 | Trend |
|---|---|---|---|
| Reverse Repo Auctions | TZS 869.2 billion | TZS 645.7 billion | ↓ Decline |
| Reduced reliance on reverse repos indicates improved liquidity and lower central bank intervention requirements | |||
Condition: High demand with falling yields
Signal: Strong investor confidence in fiscal stability and macroeconomic management
✓ Highly PositiveCondition: Adequate liquidity with stable rates
Signal: Effective monetary transmission and well-functioning liquidity framework
✓ Stable & HealthyCondition: Smooth functioning across all segments
Signal: Macro-financial stability supported by credible policy framework
✓ Excellent HealthThe government securities market and interbank cash market jointly demonstrate a stable, liquid, and well-managed financial system in Tanzania as of November 2025. Strong demand for government paper, declining yields, and stable interbank rates reflect:
Tanzania's interest rate environment in November 2025 demonstrated remarkable stability while supporting sustained economic growth. The financial landscape remained balanced with modest upward adjustments reflecting healthy market dynamics rather than stress signals.
Lending rates experienced marginal increases in November 2025, reflecting robust credit demand alongside the 18.1% private-sector lending growth. The adjustments remained modest, ensuring borrowing costs stayed supportive of investment and economic expansion.
| Lending Category | Nov 2024 | Oct 2025 | Nov 2025 | Change |
|---|---|---|---|---|
| Overall Lending Rate | 15.67% | 15.19% | 15.27% | +0.08 pp |
| Short-Term Lending (≤1 year) | 15.56% | 15.50% | 15.53% | +0.03 pp |
| Negotiated Rate (Prime) | 12.77% | 12.40% | 12.61% | +0.21 pp |
The 8 basis point rise in overall lending rates signals healthy credit demand without creating barriers to investment or business expansion.
Negotiated rates at 12.61% remain 2.66 percentage points below the market average, demonstrating preferential pricing for creditworthy borrowers.
Stable lending rates continue supporting the robust 18.1% private-sector credit growth, fueling economic activity across sectors.
Deposit rates showed more pronounced increases in November 2025, particularly for time deposits. This reflects intensified competition among banks for stable, long-term funding sources despite overall ample system liquidity.
| Deposit Category | Nov 2024 | Oct 2025 | Nov 2025 | Change |
|---|---|---|---|---|
| Savings Deposit Rate | 2.69% | 2.93% | 2.88% | -0.05 pp |
| Overall Time Deposit | 8.18% | 8.36% | 8.54% | +0.18 pp |
| 12-Month Deposit Rate | 9.63% | 9.21% | 10.02% | +0.81 pp |
| Negotiated Deposit Rate | 10.14% | 11.22% | 11.67% | +0.45 pp |
The sharp 81 basis point jump in 12-month deposit rates to 10.02% significantly improves returns, encouraging financial savings mobilization.
Rising time and negotiated deposit rates signal banks are competing actively for stable funding despite adequate system liquidity.
Savings rates remained relatively flat, consistent with their high liquidity and transactional nature versus term deposits.
The narrowing of the short-term interest rate spread represents one of November's most significant developments, indicating enhanced banking sector efficiency and improved monetary policy transmission.
| Period | Interest Rate Spread | Change | Interpretation |
|---|---|---|---|
| November 2024 | 5.93% | - | Baseline |
| October 2025 | 6.28% | +0.35 pp | Temporary widening |
| November 2025 | 5.51% | -0.77 pp | Significant improvement |
Interest rate movements in November 2025 occurred within a well-anchored monetary policy framework, demonstrating effective transmission from the Bank of Tanzania's policy stance to market rates.
| Indicator | Value | Policy Significance |
|---|---|---|
| Central Bank Rate (CBR) | 5.75% | Accommodative stance anchoring market rates |
| 7-Day IBCM Rate (Average) | 6.15% | Within policy corridor, effective transmission |
| Inflation Rate | 3.4% | Well within 3-5% target range |
| Private Sector Credit Growth | 18.1% | Strong lending supporting economic expansion |
Market rates adjusted in line with monetary policy without destabilizing inflation, confirming the Bank of Tanzania's control over financial conditions.
The combination of low inflation (3.4%) and strong credit growth (18.1%) demonstrates successful policy calibration supporting growth without overheating.
The 5.75% policy rate remains supportive, with ample room for adjustment if economic conditions change, providing policy flexibility.
| Aspect | Lending Rates | Deposit Rates |
|---|---|---|
| Direction (Nov 2025) | Slight increase (+0.08 pp) | Moderate increase (+0.81 pp on 12-month) |
| Main Driver | Strong credit demand (18.1% growth) | Bank competition for stable deposits |
| Economic Impact | Supports investment and business expansion | Encourages savings mobilization |
| Risk Signal | Contained - rates remain affordable | Low - reflects healthy competition |
| Year-on-Year Trend | Down 0.40 pp from Nov 2024 | Up 0.39 pp on 12-month from Nov 2024 |
Looking ahead to early 2026, the interest rate environment is expected to remain stable with several supporting factors:
The November 2025 interest rate data paints a picture of a mature, well-functioning financial system supporting Tanzania's economic ambitions. The modest rise in lending rates reflected healthy credit demand rather than monetary tightening, while the more pronounced increases in deposit rates rewarded savers and demonstrated vibrant bank competition.
Most significantly, the narrowing interest rate spread from 6.28% to 5.51% signals improved banking sector efficiency and effective monetary policy transmission. This development, combined with low inflation at 3.4%, stable policy rates, and robust 18.1% private-sector credit growth, creates an optimal environment for sustained economic expansion.
As Tanzania advances its development agenda, this balanced interest rate environment—affordable lending supporting investment, attractive deposit rates encouraging savings, and efficient intermediation facilitating resource allocation—provides a solid foundation for continued progress toward middle-income status and beyond.
The Tanzania Shilling (TZS) continues to rank among the weaker currencies in Africa when measured by its nominal exchange rate against the US dollar, raising an important economic question about why it trails far behind Africa's strongest currencies such as the Tunisian Dinar (TND) and Libyan Dinar (LYD). This comprehensive analysis examines the structural, policy-related, and global factors shaping Tanzania's foreign exchange dynamics, providing insights for policymakers, investors, businesses, and the public.
1 TZS ≈ 0.0004 USD
As of December 2025, 1 USD exchanges for approximately 2,473 TZS, meaning 1 TZS is worth about 0.0004 USD. In stark contrast, 1 Tunisian Dinar equals 0.34 USD and 1 Libyan Dinar equals 0.18 USD. This wide gap highlights not just currency performance differences, but also deeper structural and policy-related factors shaping Tanzania's foreign exchange dynamics.
At the core of the shilling's weakness is Tanzania's import-dependent growth model. In 2025, the economy grew by about 6%, driven largely by infrastructure expansion, energy projects, mining, and urban development. While this growth is positive, it has significantly increased demand for foreign currency to pay for fuel, machinery, capital goods, and construction materials.
Another key factor is the current account deficit, projected at around 3.2% of GDP in 2025, reflecting a persistent imbalance between export earnings and import payments. Although Tanzania performed strongly in gold exports—earning approximately USD 4.59 billion by October 2025—and saw recovery in tourism, these inflows were still insufficient to fully offset the growing import bill.
According to the latest data from December 2025, the currency landscape in Africa shows significant disparities. The Tunisian Dinar (TND) leads as the strongest currency in Africa, with 1 TND ≈ 0.34 USD (or approximately 1 USD ≈ 2.94 TND). This strength is attributed to Tunisia's monetary discipline, controlled inflation, and restrictions on capital outflows.
| Rank | Currency | Code | Country/Region | Value (1 unit = USD) |
|---|---|---|---|---|
| 1 | Tunisian Dinar | TND | Tunisia | 0.34 |
| 2 | Libyan Dinar | LYD | Libya | 0.18 |
| 3 | Moroccan Dirham | MAD | Morocco | 0.11 |
| 4 | Ghanaian Cedi | GHS | Ghana | 0.087 |
| 5 | Botswana Pula | BWP | Botswana | 0.074 |
| 6 | Seychelles Rupee | SCR | Seychelles | 0.070 |
| 7 | Eritrean Nakfa | ERN | Eritrea | 0.066 |
| 8 | Namibian Dollar / Swazi Lilangeni | NAD / SZL | Namibia / Eswatini | 0.060 |
| 9 | Lesotho Loti | LSL | Lesotho | 0.058 |
| 10 | South African Rand | ZAR | South Africa | 0.058 |
The Tanzania Shilling (TZS) is among the weaker currencies in Africa nominally. As of late December 2025, 1 USD ≈ 2,473 TZS (or 1 TZS ≈ 0.000404 USD). This places it far below the top ranks, even weaker than lower entries like the Kenyan Shilling at approximately 0.0077 USD per unit.
| Country | Currency | Code | 1 unit = USD | 1 USD = local units | Position in Africa |
|---|---|---|---|---|---|
| Tunisia | Tunisian Dinar | TND | 0.34 | ~2.94 | Strongest |
| Libya | Libyan Dinar | LYD | 0.18 | ~5.41 | 2nd |
| Morocco | Moroccan Dirham | MAD | 0.11 | ~9.09 | 3rd |
| South Africa | South African Rand | ZAR | 0.058 | ~17.24 | ~10th |
| Kenya | Kenyan Shilling | KES | 0.0077 | ~129.87 | Lower mid |
| Tanzania | Tanzania Shilling | TZS | 0.000404 | ~2,473 | Weak |
| Rwanda | Rwandan Franc | RWF | 0.00069 | ~1,449 | Weak |
In East Africa (EAC members): TZS is relatively stable but nominally weaker than the Kenyan Shilling (KES). Uganda (UGX) and Burundi (BIF) are even weaker, with typical values of 1 UGX ≈ 0.00027 USD. Ethiopia's Birr is also considered weak in nominal terms.
The Tanzania Shilling (TZS) experienced notable volatility throughout 2025, weakening significantly in the first half of the year before stabilizing and even slightly appreciating toward the end. The shilling peaked at around 1 USD ≈ 2,700 TZS in mid-2025, making it briefly the world's worst-performing currency, before recovering to approximately 2,473 TZS by late December 2025. This represents an overall annual depreciation of about 3.5% compared to the start of the year.
Several interconnected factors drove the day-to-day and monthly pressures on the TZS:
The outlook is generally positive for relative stability or modest depreciation, supported by Tanzania's strong fundamentals:
Overall, while the TZS is likely to face some ongoing nominal weakening due to Tanzania's import-dependent growth model, 2026 should see greater stability than the volatile first half of 2025, with long-term benefits from investments potentially strengthening the currency in real terms over time.
Global factors have also played a significant role in the shilling's performance. The continued strength of the US dollar, driven by high interest rates and global risk aversion, placed pressure on emerging and frontier market currencies throughout 2025. Tanzania was not immune to these global dynamics.
Countries with stronger currencies, such as Tunisia and Libya, rely heavily on controlled foreign exchange systems, oil revenues, or strict limits on currency convertibility, which support nominal currency strength but do not necessarily reflect broader economic resilience or long-term sustainability.
Importantly, the shilling's weaker position does not necessarily imply economic failure. Unlike some of Africa's strongest currencies, Tanzania operates a more flexible and market-responsive exchange rate system, which absorbs shocks rather than masking them.
Key indicators of macroeconomic stability in 2025 include:
Therefore, the gap between the Tanzania Shilling and Africa's strongest currencies is best explained by structural trade dynamics, policy choices, and openness to global markets, rather than short-term mismanagement.
Understanding why the Tanzania Shilling lags behind Africa's strongest currencies is essential not only for policymakers, but also for investors, businesses, and the public. It underscores the trade-offs between currency strength, economic openness, and long-term growth, and frames the broader debate on whether nominal currency strength should be the ultimate benchmark for economic success in Tanzania's development trajectory.
In conclusion, the Tanzania Shilling's position behind Africa's strongest currencies is largely the result of structural economic realities rather than economic weakness. Tanzania's import-driven growth model, expanding infrastructure investments, and rising demand for foreign exchange naturally exert downward pressure on the shilling, while countries with stronger nominal currencies often rely on strict currency controls, limited convertibility, or resource-based inflows that artificially support exchange rates.
Despite episodes of volatility in 2025, the shilling demonstrated resilience through effective Bank of Tanzania interventions, low and stable inflation of around 3-3.5%, improving foreign exchange reserves covering 4-5 months of imports, and strong export performance in gold and tourism.
Therefore, while the TZS remains weak in nominal terms, it reflects a more open, flexible, and growth-oriented economy. The real policy challenge for Tanzania is not merely strengthening the currency's face value, but deepening export diversification, reducing import dependence, and sustaining macroeconomic stability, which over time will enhance the shilling's real strength and long-term economic credibility.
Get complete access to comprehensive data, detailed analysis, and expert insights including:
One-time payment for lifetime access
Enter the 6-digit access code sent to you by our admin team:
Your payment is being verified by our admin team.
Reference Number:
You will receive a 6-digit access code via SMS within 24 hours.
Once you receive the code, click the button below to unlock the article.
As of November 2025, the Bank of Tanzania (BoT) recorded total assets of TZS 29.67 trillion (approximately USD 12 billion), liabilities of TZS 26.85 trillion, and equity of TZS 2.83 trillion, featuring a remarkable increase in gold holdings (over TZS 4.67 trillion combined) and cash equivalents (TZS 4.45 trillion) driven by record gold sales and tourism revenue—this directly reflects Tanzania's strong economic performance in 2025, with GDP growth of 6.0–6.3%, inflation below 3.4%, and foreign exchange reserves of USD 6–7 billion (4.7 months of import cover). The BoT plays a critical role in managing the economy through monetary policies, such as purchasing domestic gold, controlling currency in circulation (TZS 9.7 trillion), and extending loans to the private sector to stimulate investment and sustainable development.
If this trend continues into 2026, in line with IMF projections (GDP growth of 6.3%), BoT assets are expected to reach TZS 32–35 trillion, liabilities to remain well-managed below TZS 30 trillion, and equity to strengthen above TZS 3 trillion—signaling a steadily growing and resilient economy. In comparison, the Central Bank of Kenya (CBK) holds total assets of approximately KES 2 trillion (USD 15–16 billion) with foreign reserves of around USD 12 billion (5.2–5.3 months of import cover) as of December 2025; while the CBK offers stronger liquid foreign reserves for greater protection against shocks, the BoT's gold-focused strategy provides a hedge against global price volatility, with both institutions contributing to their countries' growth (Kenya projected at 5.0–5.3% in 2026) through effective inflation control and credit stimulation. Read More: Central Bank Asset Dynamics and Tanzania’s Macroeconomic Performance in 2025–2026
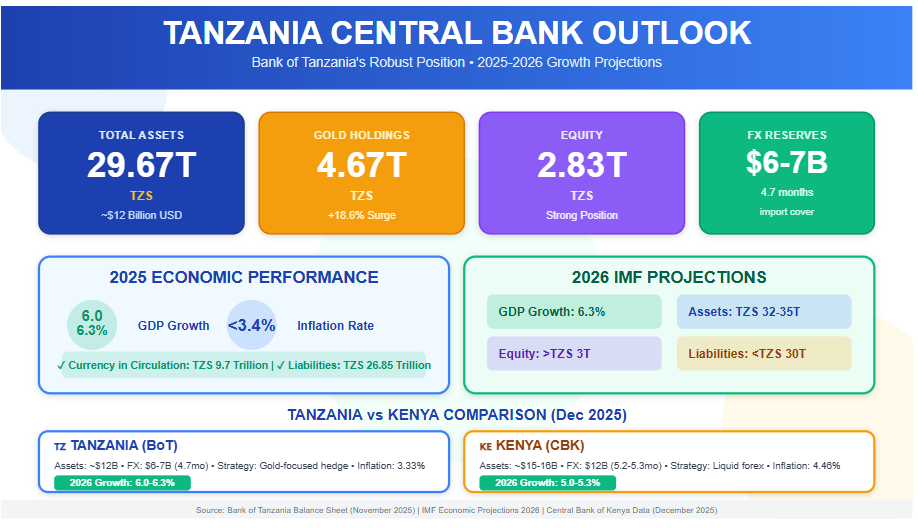
In East Africa, the Bank of Tanzania (BoT) and the Central Bank of Kenya (CBK) stand as critical institutions steering their respective economies toward stability and expansion. As of December 2025, both nations exhibit resilient growth trajectories, with Tanzania's GDP expanding by 5.6% in FY2024/25 and projections for 6.0-6.3% in 2025-2026, while Kenya anticipates 5.3% growth in 2025 amid controlled inflation. These figures reflect the central banks' pivotal roles in fostering economic development through monetary policy, reserve management, and financial stability. However, Tanzania's post-election political turmoil in late 2025 introduces risks that could dampen its 2026 outlook, underscoring the interplay between governance and economic progress. This article examines the functions of BoT and CBK in driving growth, offers a comparative lens, and explores how Tanzania's political dynamics might influence its economic path forward.
The BoT, established under the Bank of Tanzania Act of 2006, serves as the guardian of monetary stability while actively supporting broader economic growth. Its primary mandate includes formulating and implementing monetary policy to maintain low inflation—currently at 3.33% in 2025—and ensuring financial system soundness. Beyond price stability, the BoT contributes to development by developing financial markets, promoting inclusive finance, and accumulating foreign reserves to buffer against external shocks. For instance, its November 2025 balance sheet reveals total assets of TZS 29.67 trillion (approximately USD 12 billion), bolstered by an 18.6% surge in gold holdings to TZS 4.67 trillion, reflecting strategic purchases from domestic miners to diversify reserves and support the mining sector—a key driver of Tanzania's export-led growth.
By managing currency in circulation (TZS 9.7 trillion as of November) and extending loans to the private sector (up 62% month-on-month to TZS 1.35 trillion), the BoT stimulates investment in agriculture, tourism, and manufacturing, which employ over 65% of the workforce. In January 2025's Monthly Economic Review, the BoT emphasized aligning monetary policy with growth objectives, such as sustaining reserves at USD 6.17 billion (4.7 months of import cover) to enhance investor confidence and facilitate infrastructure projects like LNG developments. These efforts have helped Tanzania achieve resilient GDP growth despite global headwinds, positioning the bank as a catalyst for long-term development through policies that encourage savings, credit access, and economic diversification.
Similarly, the CBK, mandated by Article 231 of Kenya's Constitution, prioritizes price stability while promoting economic growth and public interest. It formulates monetary policy, issues currency, and regulates the financial sector to foster a stable environment for investment. As of December 2025, the CBK lowered its Central Bank Rate (CBR) to 9.00% from previous levels, aiming to stimulate economic activity, support SMEs, and boost lending amid inflation of 4.46% in November—well within its 2.5-7.5% target. This proactive stance, as outlined in its bi-annual Monetary Policy Statements, regulates money supply growth in line with GDP targets, using tools like Open Market Operations and a Cash Reserve Ratio of 3.25% to manage liquidity.
The CBK's foreign exchange reserves stand at approximately USD 12 billion (5.2-5.3 months of import cover), providing a stronger buffer than Tanzania's and enabling interventions to stabilize the Kenyan Shilling. By encouraging long-term investments and maintaining deflation-free conditions, the bank supports key sectors like agriculture, services, and manufacturing, which have driven Kenya's consistent GDP expansion. For example, its role in currency issuance and management ensures efficient transactions, while financial inclusion initiatives have expanded access to credit, contributing to poverty reduction and job creation. Overall, the CBK acts as an economic enabler, balancing stability with growth to position Kenya as a regional hub.
While both central banks share core functions like inflation control and reserve management, their approaches reflect national economic structures. Tanzania's BoT emphasizes commodity diversification, with gold comprising a significant portion of reserves, aligning with its mining-dependent economy. In contrast, Kenya's CBK relies more on liquid foreign currency holdings, suiting its service-oriented market with higher external trade volumes.
| Aspect | Bank of Tanzania (BoT) | Central Bank of Kenya (CBK) |
| Total Assets (est. Dec 2025) | ~USD 12 billion (TZS 29.67 trillion, Nov data) | ~USD 15-16 billion (KES ~2 trillion est.) |
| FX Reserves | ~USD 6-7 billion (4.7 months import cover) | ~USD 12 billion (5.2-5.3 months cover) |
| Key Growth Focus | Gold purchases, private sector lending; supports mining/tourism | Rate cuts for SMEs; stabilizes services/manufacturing |
| Inflation (2025) | 3.33% | 4.46% (Nov) |
| Policy Tools | Domestic gold acquisition, monetary easing | CBR at 9%, Open Market Operations |
| GDP Contribution | Enables 6%+ growth via reserves buildup | Sustains 5%+ growth through liquidity |
This table highlights Kenya's edge in reserve depth for external resilience, while Tanzania's strategy hedges against volatility through gold. Both institutions have effectively contained inflation below 5%, fostering environments conducive to investment and poverty alleviation.
Tanzania's political stability, once a regional benchmark, has been shaken by the October 2025 general elections, marred by allegations of irregularities and resulting in widespread protests. President Samia Suluhu Hassan secured re-election, but opposition parties like Chadema have decried the process as fraudulent, calling for a UN-overseen transitional government. Post-election violence led to a lethal crackdown by security forces, with UN experts condemning systematic human rights violations, including killings and digital restrictions. By December 2025, the government imposed nationwide protest bans, tightened security, and urged the military to remain apolitical amid escalating tensions.
This unrest could jeopardize Tanzania's 2026 economic projections of 6.1-6.3% GDP growth. Prolonged instability might deter foreign investment, disrupt tourism (a key forex earner), and strain fiscal resources through heightened security spending. If protests escalate, supply chain disruptions could inflate food prices, pushing inflation above the 3-5% target and eroding purchasing power. Moreover, international scrutiny from bodies like the UN and African Union could lead to sanctions or reduced aid, impacting reserves and infrastructure projects. However, if the government addresses grievances through dialogue—as hinted in recent calls for military professionalism—stability could return, allowing the BoT's policies to sustain growth amid global trade tensions.
The BoT and CBK exemplify how central banks can drive economic development by balancing stability with proactive growth measures, from reserve diversification in Tanzania to rate adjustments in Kenya. Their efforts have positioned both nations for robust 2025-2026 performance, with low inflation and adequate buffers against external risks. Yet, Tanzania's political volatility post-2025 elections poses a wildcard, potentially hindering 2026 growth through investor flight and fiscal strain. For sustained progress, addressing governance issues will be as crucial as monetary policy, ensuring these East African powerhouses continue their upward trajectories.
Economic Stability, Resilience, and Growth Momentum
By Amran Bhuzohera
Tanzania’s economy in 2025 continues to display strong resilience amid a complex post-election environment and global uncertainties. Data from the Bank of Tanzania (BoT) and National Bureau of Statistics (NBS) highlight a broadly stable macroeconomic landscape marked by low inflation, steady currency appreciation, manageable public debt, and rising foreign investment flows. The combination of policy discipline, export recovery, and domestic demand expansion positions Tanzania as one of East Africa’s most stable economies heading into 2026.
1. Inflation: Controlled and Predictable
Headline inflation remained within the 3–5% target range, rising slightly to 3.5% in October 2025 from 3.4% the previous month. The modest uptick reflects higher food prices (7.4%) partially offset by declining fuel and energy costs (–1.4% monthly).
| Indicator | Oct 2024 | Oct 2025 | Annual Change (%) | Notes |
| Headline Inflation | 3.0 | 3.5 | +0.5 | Stable, low inflation |
| Food Inflation | 7.0 | 7.4 | +0.4 | Driven by cereals and vegetables |
| Core Inflation | 2.2 | 2.1 | –0.1 | Stable non-food prices |
| Energy/Fuel Inflation | 3.7 | –1.4 (monthly) | — | Lower global oil prices |
Key takeaway: Inflation stability preserves purchasing power and encourages investor confidence. Food inflation remains a challenge, particularly for low-income households, but easing monthly trends suggest temporary relief.
2. Exchange Rate and External Sector: Strong Shilling, Narrowing Deficit
The Tanzanian shilling appreciated 9.4% year-on-year to an average of TZS 2,471.69/USD in September 2025, reversing the 10.1% depreciation of 2024. This reflects robust export performance—especially gold, cashews, and cereals—and increasing tourism earnings.
| Indicator | Sep 2025 | Change | Economic Implication |
| Exchange rate (TZS/USD) | 2,471.69 | +9.4% YoY | Strengthens import affordability |
| Current Account Balance | –1.5% of GDP | Narrowed | Boosted by tourism +15.8% |
| Foreign Reserves | USD 6.66B | 5.8 months import cover | Ample external buffer |
| Services Receipts | USD 6.97B | +4.6% | Tourism recovery |
Key takeaway: Currency strength has improved debt servicing capacity and dampened imported inflation, anchoring macroeconomic stability.
3. Public Debt: Sustainable and Development-Focused
Tanzania’s total national debt stood at TZS 127.47 trillion (USD 50.77 billion) as of September 2025, with external debt accounting for 70.6%. The debt composition remains largely concessional and directed toward infrastructure, energy, and social services.
| Category | Amount | Share (%) | Key Notes |
| Total Debt | TZS 127,474.5B | 100 | Up 1.4% MoM |
| External Debt | USD 35.44B | 69.8 | 77.5% held by central government |
| Domestic Debt | TZS 37,459B | 30.2 | 73% bonds, 27% T-bills |
| USD Share (of External) | 66% | — | FX exposure risk |
| Debt/GDP Ratio | 40.1% | — | Below EAC 50% ceiling |
Key takeaway: Debt levels are sustainable and aligned with regional thresholds. An appreciating shilling reduces repayment costs for USD-denominated debt, though diversification of borrowing remains essential.
4. Fiscal and Monetary Position: Discipline Anchored in Stability
Fiscal operations show a TZS 618.5 billion deficit, financed mainly through domestic bonds and concessional loans. Revenue performance reached 87.2% of target while expenditure execution stood at 71.9%. The BoT policy rate remained at 6.0%, supporting 12% private sector credit growth.
| Fiscal Indicator | Value | Performance |
| Revenue (collected) | TZS 2,728.1B | 87.2% of target |
| Expenditure | TZS 3,346.6B | 71.9% executed |
| Deficit | TZS 618.5B | 3.5% of GDP (approx.) |
| Policy Rate | 6.0% | Accommodative stance |
| Credit Growth | 12% | Driven by SMEs and trade |
Key takeaway: Fiscal discipline, supported by strong domestic debt markets, has preserved macroeconomic credibility without crowding out private credit.
5. Sectoral Outlook: Growth Catalysts Emerging
The 2025 outlook projects GDP growth between 5.5% and 6.5%, supported by agriculture, tourism, and manufacturing. Infrastructure investment and digital transformation remain key growth levers under the FYDP III framework.
| Sector | Contribution to GDP | 2025 Performance | Outlook |
| Agriculture | 25–30% | Food inflation pressure but export resilience | Needs irrigation, value addition |
| Tourism | 10–12% | Arrivals +15.8% | Post-election rebound |
| Manufacturing | 8–10% | Stable input costs | Expansion via local supply chains |
| Mining | 7–9% | Gold exports +12.8% | Sustained global demand |
Key takeaway: Structural investments in transport, power, and agriculture will sustain growth momentum into 2026, while diversification remains essential to shield against external shocks.
6. Zanzibar: Parallel Progress
Zanzibar’s economy mirrors mainland stability, posting 3.5% inflation and a USD 836.6 million current account surplus (+34.7%), driven by tourism (+28.2% arrivals). Fiscal discipline and service exports remain key strengths.
Conclusion
Tanzania’s 2025 economic story is one of stability amid transition. Inflation remains low, the shilling is strong, and debt sustainability is intact. However, persistent food inflation and USD exposure warrant close monitoring. Continued structural reforms, SME incentives, and agricultural modernization under the FYDP III will determine whether Tanzania sustains its 6%+ growth trajectory and advances toward upper-middle-income status by 2030.
In September 2025, Tanzania’s macroeconomic environment remained exceptionally stable, marked by a stronger shilling and low, well-anchored inflation. The exchange rate averaged TZS 2,471.69 per USD, appreciating by 0.75% month-on-month and 9.4% year-on-year—an impressive reversal from the sharp depreciation recorded in 2024. This stability was supported by strong export inflows from gold, cereals, and cashew nuts, alongside robust tourism earnings and targeted Bank of Tanzania interventions. Inflation held steady at 3.4%, well within the 3–5% target range and aligned with regional convergence criteria. Food inflation remained elevated at 7%, but non-food (1.9%) and energy inflation (3.7%) stayed subdued, helped by lower global oil prices and a strong currency. Together, these elements created a stable price environment, improving import affordability, reducing cost pressures for households and businesses, and enhancing the effectiveness of monetary policy transmission.
The Tanzania shilling remained relatively strong and stable in 2025.
Key Figures
Drivers of Shilling Strength
Inflation remained low, stable, and within official target range.
Inflation Figures
Components
When the shilling is stable/strong:
| Indicator | Value | Movement | Economic Meaning |
| Exchange rate (TZS/USD) | 2,471.69 | Appreciated | Supports price stability |
| Monthly exchange rate change | +0.75% | Strengthened | Lower import costs |
| Annual exchange rate change | +9.4% | Appreciated | Reduces imported inflation |
| Headline inflation | 3.4% | Stable | Within target |
| Food inflation | 7.0% | Slightly eased | Adequate domestic food supplies |
| Core inflation | 2.2% | Slightly up | Driven by household goods & transport |
| Energy/fuel inflation | 3.7% | Down | Supported by stable shilling and oil prices |
| Interbank rate | 6.45% | Within policy corridor | Monetary policy effective |
The interplay between the Tanzanian shilling's strength and low inflation in September 2025, as detailed in Sections 2.5 (Financial Markets, specifically the Interbank Foreign Exchange Market) and 2.2 (Inflation Developments) of the Bank of Tanzania's (BOT) Monthly Economic Review (October 2025), underscores a virtuous cycle of external resilience and price stability. The shilling appreciated 0.75% monthly (average TZS 2,471.69/USD vs. TZS 2,490.16 in August) and 9.4% annually—reversing the 10.1% depreciation seen in September 2024—amid robust export inflows (gold, cash crops, cashews), tourism earnings, and BOT's targeted intervention (net USD 11 million sale; Chart 2.5.3). This stability dovetails with headline inflation holding at 3.4% (within 3–5% target and EAC/SADC criteria), driven down by easing food (7.0%) and energy (3.7%) pressures. Below, I outline the implications, integrating broader economic dynamics like 6.3% Q2 GDP growth and accommodative policy (CBR 5.75%).
1. Shilling Appreciation: Bolstering External Buffers and Import Affordability
2. Inflation Stability: Reinforced by Currency Strength and Supply Factors
3. Interlinkages: Shilling Strength Amplifying Monetary Effectiveness and Growth
4. Macroeconomic and Policy Context from the Review
| Indicator | Value (Sep 2025) | Movement (vs. Aug 2025) | Economic Implication |
| Exchange Rate (TZS/USD Avg) | 2,471.69 | Appreciated 0.75% | Lowers import costs; curbs inflation pass-through. |
| Annual Exchange Change | +9.4% | Up from +7.6% | Reverses 2024 depreciation; builds FX reserves. |
| Headline Inflation | 3.4% | Stable | Within targets; supports growth without overheating. |
| Food Inflation | 7.0% | Eased from 7.7% | NFRA stocks buffer supply risks; shilling aids imports. |
| Core Inflation | 2.2% | Up from 2.0% | Mild pressure from domestics; offset by FX stability. |
| Energy/Fuel Inflation | 3.7% | Down from 11.5% (2024) | Oil + shilling synergy reduces transport costs. |
| Interbank Rate | 6.45% | Eased from 6.48% | Effective policy transmission; ample liquidity. |
In summary, the shilling's September 2025 strength implies fortified macroeconomic stability, directly muting inflation risks and enabling growth-focused policies. This tandem—rooted in exports, interventions, and supply adequacy—positions Tanzania resiliently, though vigilance on commodity volatility and food chains is essential for 2026 continuity.
In September 2025, Tanzania’s financial markets displayed strong liquidity and investor confidence, reflected in an oversubscribed T-bill auction (TZS 194.7 billion bids against TZS 80.7 billion tender) and a decline in average yields to 6.03% from 6.83% the previous month. Bond market activity remained solid, with long-term tenors (20- and 25-year) attracting substantial investor interest, contributing to total bids of TZS 2,271.5 billion, of which TZS 784.9 billion were accepted, and yields stabilizing between 12.48% and 13.55%. Meanwhile, the interbank cash market strengthened markedly, with transactions rising to TZS 3,261.6 billion from TZS 2,374.5 billion—an increase of TZS 887.1 billion—driven by higher commercial banking activity, stable liquidity conditions, and sustained export inflows. Interbank rates remained stable at 6.45%, comfortably within the 3.75–7.75% policy corridor, supported by the Bank of Tanzania’s active liquidity management through reverse repos. Collectively, these developments indicate a resilient and well-functioning financial ecosystem, where strong liquidity supports monetary policy transmission, reduces financing pressures, and deepens market confidence.
Government securities include Treasury bills (T-bills) and Treasury bonds (T-bonds). They are used for financing government operations and managing liquidity.
Key Highlights
Bond Market
The BOT conducted auctions for:
Accepted Bids and Yields
| Item | Value |
| T-bill tender size | TZS 80.7 billion |
| Total bids (T-bills) | TZS 194.7 billion |
| Accepted bids | TZS 80.7 billion |
| Average T-bill yield | 6.03% |
| T-bond total bids | TZS 2,271.5 billion |
| T-bond accepted bids | TZS 784.9 billion |
| 5-year yield | 12.48% |
| 20-year yield | 13.55% |
| 25-year yield | 13.19% |
The IBCM allows banks to borrow and lend liquidity—crucial for monetary policy transmission.
Key Highlights
Liquidity Dynamics
| Item | Value |
| Total IBCM transactions | TZS 3,261.6 billion |
| Previous month | TZS 2,374.5 billion |
| Increase | +887.1 billion |
| Share of 7-day transactions | 64.6% |
| Overall IBCM interest rate | 6.45% |
| August 2025 rate | 6.48% |
| Policy corridor | 3.75% – 7.75% |
| Market | Key Indicators | September 2025 Value |
| Government Securities | T-bill tender size | TZS 80.7 billion |
| T-bill bids | TZS 194.7 billion | |
| Bond bids | TZS 2,271.5 billion | |
| Accepted bond bids | TZS 784.9 billion | |
| Yields | 6.03% (T-bill), 12.48–13.55% (bonds) | |
| Interbank Cash Market | Total IBCM turnover | TZS 3,261.6 billion |
| 7-day share | 64.6% | |
| IBCM interest rate | 6.45% |
The data on Tanzania's government securities and interbank cash markets (IBCM) for September 2025, extracted from Financial Markets of the Bank of Tanzania's (BOT) Monthly Economic Review (October 2025), signals a liquid and confident financial system. This aligns with broader economic resilience: 6.3% Q2 GDP growth, stable 3.4% inflation, accommodative monetary policy (CBR 5.75%; Section 2.3), shilling appreciation (9.4% y/y; Section 2.5 IFEM), and a manageable fiscal deficit (TZS 618.5B financed partly via securities; Section 2.6). T-bill oversubscription (194.7B bids vs. 80.7B tender) and declining yields (6.03%) reflect surplus liquidity, while long-term bond demand (oversubscription for 20/25-year tenors) indicates investor optimism. IBCM turnover surged 37.4% MoM to TZS 3,261.6B, with rates steady at 6.45% within the 3.75–7.75% corridor, underscoring effective liquidity management amid export inflows (gold/crops/tourism). Below, I outline implications, categorized by market and linkages.
1. Government Securities Market: Investor Confidence and Liquidity Absorption
2. Interbank Cash Market (IBCM): Enhanced Transmission and Activity
3. Interlinkages: Liquidity Supporting Growth and Stability
4. Macroeconomic Context from the Review
| Market | Key Indicator | September 2025 Value | MoM Change | Economic Implication |
| Government Securities | T-Bill Tender Size | TZS 80.7B | — | Absorbs short-term liquidity; supports deficit financing. |
| T-Bill Bids/Accepted | TZS 194.7B / 80.7B | Oversubscribed | High confidence; yield drop (6.03%) eases govt costs. | |
| Bond Bids/Accepted | TZS 2,271.5B / 784.9B | Mixed (long oversubscribed) | Institutional demand for duration; stable yields (12–13%). | |
| IBCM | Total Turnover | TZS 3,261.6B | +37.4% (from 2,374.5B) | Reflects credit/export activity; aids policy transmission. |
| 7-Day Share | 64.6% | — | Preference for short-term; stable rates (6.45%) curb volatility. | |
| Overall Rate | 6.45% | -0.03 pp | Within corridor; supports low inflation/growth. |
In summary, September 2025's financial market dynamics imply a robust, liquid ecosystem that reinforces Tanzania's stability and growth enablers. Oversubscription and turnover growth signal trust and efficiency, mitigating fiscal pressures while amplifying monetary impact—key for navigating global risks into late 2025.
In July 2025, Tanzania's headline inflation rate remained stable at 3.3%, unchanged from June 2025 and well within the Bank of Tanzania's medium-term target range of 3-5%. This stability was driven by offsetting dynamics in the inflation basket: a slight rise in food inflation was counterbalanced by decelerations in non-food components, particularly energy, fuel, and utilities. According to the National Bureau of Statistics and Bank of Tanzania computations, this outcome aligned with regional convergence benchmarks in the East African Community (EAC) and Southern African Development Community (SADC), where inflation trends were mixed but generally moderate.
This stability contributed to a subdued inflation outlook, enabling supportive monetary policy adjustments.
Stable inflation fosters economic development by preserving purchasing power, reducing uncertainty for investors and consumers, and allowing central banks to ease monetary policy without risking price spirals. In Tanzania's case, the July 2025 inflation stability directly influenced development through enhanced credit availability, boosted economic activity, and sustained growth momentum. Low and predictable inflation encourages household consumption, business investment, and foreign direct investment, which are critical for Tanzania's transition toward middle-income status.
The Monetary Policy Committee (MPC) cited the stable inflation environment as a key factor in lowering the Central Bank Rate (CBR) to 5.75% from 6.00% for the quarter ending September 2025. This decision aimed to stimulate credit growth amid strengthening domestic conditions and diminishing global risks. As a result:
These figures reflect how inflation stability enabled liquidity injections—such as TZS 758.8 billion in reverse repo operations—to steer interbank rates within the 3.75-7.75% corridor, facilitating cheaper borrowing and investment.
Tanzania's overall economic growth has benefited from this inflation stability, with real GDP expanding robustly in 2025. Projections indicate GDP growth of approximately 6% for the year, up from an estimated 5.4% in 2024, supported by low inflation that mitigates cost-of-living pressures and enhances fiscal space. Stable inflation has also helped maintain a manageable fiscal balance and improved the current account, as noted by the IMF, contributing to foreign exchange reserve buildup and reduced external vulnerabilities.
In the agricultural sector—a key driver of Tanzania's economy—inflation stability intersected with food security measures. The National Food Reserve Agency maintained stocks at 485,930 tonnes in July 2025, up significantly from 368,855 tonnes in July 2024, buffering against food price volatility and supporting rural livelihoods.
While positive, food inflation's uptick (7.6%) highlights vulnerabilities to supply-side shocks, such as weather or global commodity trends (Mixed world commodity prices, with declines in maize and rice aiding stability). Overall, stable inflation has reinforced Tanzania's resilience, with the World Bank noting robust growth amid single-digit inflation. This environment positions Tanzania for sustained development, potentially accelerating poverty reduction and infrastructure investment, though external factors like global trade uncertainties could pose risks if inflation deviates.
| Category | Indicator | Value (July 2025) | Previous Month (Jun 2025) |
| Inflation | Headline Inflation Rate | 3.3% | 3.3% |
| Food and Non-Alcoholic Beverages | 7.6% | 7.3% | |
| Core Inflation | 1.9% | 1.9% | |
| Energy, Fuel, and Utilities | 1.0% | 2.1% | |
| Monetary Policy | Central Bank Rate (CBR) | 5.75% | 6.00% |
| 7-Day Interbank Cash Market (IBCM) Rate | 3.75% - 7.75% (corridor) | N/A | |
| Reverse Repo Transactions | TZS 758.8 billion | N/A | |
| Money Supply | Extended Broad Money Supply (M3) Growth | 19.9% | 18.7% |
| Private Sector Credit Growth | 15.9% | 15.9% | |
| Food Stocks | National Food Reserve Agency Stock | 485,930 tonnes | 477,923 tonnes |
| Maize Released | 1,855.3 tonnes | N/A | |
| Petroleum Prices | Petrol (TZS per liter) | ~TZS 3,200 | Slight decline |
| Diesel (TZS per liter) | ~TZS 3,200 | Slight decline | |
| Kerosene (TZS per liter) | ~TZS 3,200 | Slight decline |
Notes:
This table summarizes key economic indicators that reflect Tanzania's economic stability and policy responses as of July 2025, providing a snapshot for further analysis.