
The Tanzania Shilling (TZS) continues to rank among the weaker currencies in Africa when measured by its nominal exchange rate against the US dollar, raising an important economic question about why it trails far behind Africa's strongest currencies such as the Tunisian Dinar (TND) and Libyan Dinar (LYD). This comprehensive analysis examines the structural, policy-related, and global factors shaping Tanzania's foreign exchange dynamics, providing insights for policymakers, investors, businesses, and the public.
1 TZS ≈ 0.0004 USD
As of December 2025, 1 USD exchanges for approximately 2,473 TZS, meaning 1 TZS is worth about 0.0004 USD. In stark contrast, 1 Tunisian Dinar equals 0.34 USD and 1 Libyan Dinar equals 0.18 USD. This wide gap highlights not just currency performance differences, but also deeper structural and policy-related factors shaping Tanzania's foreign exchange dynamics.
At the core of the shilling's weakness is Tanzania's import-dependent growth model. In 2025, the economy grew by about 6%, driven largely by infrastructure expansion, energy projects, mining, and urban development. While this growth is positive, it has significantly increased demand for foreign currency to pay for fuel, machinery, capital goods, and construction materials.
Another key factor is the current account deficit, projected at around 3.2% of GDP in 2025, reflecting a persistent imbalance between export earnings and import payments. Although Tanzania performed strongly in gold exports—earning approximately USD 4.59 billion by October 2025—and saw recovery in tourism, these inflows were still insufficient to fully offset the growing import bill.
According to the latest data from December 2025, the currency landscape in Africa shows significant disparities. The Tunisian Dinar (TND) leads as the strongest currency in Africa, with 1 TND ≈ 0.34 USD (or approximately 1 USD ≈ 2.94 TND). This strength is attributed to Tunisia's monetary discipline, controlled inflation, and restrictions on capital outflows.
| Rank | Currency | Code | Country/Region | Value (1 unit = USD) |
|---|---|---|---|---|
| 1 | Tunisian Dinar | TND | Tunisia | 0.34 |
| 2 | Libyan Dinar | LYD | Libya | 0.18 |
| 3 | Moroccan Dirham | MAD | Morocco | 0.11 |
| 4 | Ghanaian Cedi | GHS | Ghana | 0.087 |
| 5 | Botswana Pula | BWP | Botswana | 0.074 |
| 6 | Seychelles Rupee | SCR | Seychelles | 0.070 |
| 7 | Eritrean Nakfa | ERN | Eritrea | 0.066 |
| 8 | Namibian Dollar / Swazi Lilangeni | NAD / SZL | Namibia / Eswatini | 0.060 |
| 9 | Lesotho Loti | LSL | Lesotho | 0.058 |
| 10 | South African Rand | ZAR | South Africa | 0.058 |
The Tanzania Shilling (TZS) is among the weaker currencies in Africa nominally. As of late December 2025, 1 USD ≈ 2,473 TZS (or 1 TZS ≈ 0.000404 USD). This places it far below the top ranks, even weaker than lower entries like the Kenyan Shilling at approximately 0.0077 USD per unit.
| Country | Currency | Code | 1 unit = USD | 1 USD = local units | Position in Africa |
|---|---|---|---|---|---|
| Tunisia | Tunisian Dinar | TND | 0.34 | ~2.94 | Strongest |
| Libya | Libyan Dinar | LYD | 0.18 | ~5.41 | 2nd |
| Morocco | Moroccan Dirham | MAD | 0.11 | ~9.09 | 3rd |
| South Africa | South African Rand | ZAR | 0.058 | ~17.24 | ~10th |
| Kenya | Kenyan Shilling | KES | 0.0077 | ~129.87 | Lower mid |
| Tanzania | Tanzania Shilling | TZS | 0.000404 | ~2,473 | Weak |
| Rwanda | Rwandan Franc | RWF | 0.00069 | ~1,449 | Weak |
In East Africa (EAC members): TZS is relatively stable but nominally weaker than the Kenyan Shilling (KES). Uganda (UGX) and Burundi (BIF) are even weaker, with typical values of 1 UGX ≈ 0.00027 USD. Ethiopia's Birr is also considered weak in nominal terms.
The Tanzania Shilling (TZS) experienced notable volatility throughout 2025, weakening significantly in the first half of the year before stabilizing and even slightly appreciating toward the end. The shilling peaked at around 1 USD ≈ 2,700 TZS in mid-2025, making it briefly the world's worst-performing currency, before recovering to approximately 2,473 TZS by late December 2025. This represents an overall annual depreciation of about 3.5% compared to the start of the year.
Several interconnected factors drove the day-to-day and monthly pressures on the TZS:
The outlook is generally positive for relative stability or modest depreciation, supported by Tanzania's strong fundamentals:
Overall, while the TZS is likely to face some ongoing nominal weakening due to Tanzania's import-dependent growth model, 2026 should see greater stability than the volatile first half of 2025, with long-term benefits from investments potentially strengthening the currency in real terms over time.
Global factors have also played a significant role in the shilling's performance. The continued strength of the US dollar, driven by high interest rates and global risk aversion, placed pressure on emerging and frontier market currencies throughout 2025. Tanzania was not immune to these global dynamics.
Countries with stronger currencies, such as Tunisia and Libya, rely heavily on controlled foreign exchange systems, oil revenues, or strict limits on currency convertibility, which support nominal currency strength but do not necessarily reflect broader economic resilience or long-term sustainability.
Importantly, the shilling's weaker position does not necessarily imply economic failure. Unlike some of Africa's strongest currencies, Tanzania operates a more flexible and market-responsive exchange rate system, which absorbs shocks rather than masking them.
Key indicators of macroeconomic stability in 2025 include:
Therefore, the gap between the Tanzania Shilling and Africa's strongest currencies is best explained by structural trade dynamics, policy choices, and openness to global markets, rather than short-term mismanagement.
Understanding why the Tanzania Shilling lags behind Africa's strongest currencies is essential not only for policymakers, but also for investors, businesses, and the public. It underscores the trade-offs between currency strength, economic openness, and long-term growth, and frames the broader debate on whether nominal currency strength should be the ultimate benchmark for economic success in Tanzania's development trajectory.
In conclusion, the Tanzania Shilling's position behind Africa's strongest currencies is largely the result of structural economic realities rather than economic weakness. Tanzania's import-driven growth model, expanding infrastructure investments, and rising demand for foreign exchange naturally exert downward pressure on the shilling, while countries with stronger nominal currencies often rely on strict currency controls, limited convertibility, or resource-based inflows that artificially support exchange rates.
Despite episodes of volatility in 2025, the shilling demonstrated resilience through effective Bank of Tanzania interventions, low and stable inflation of around 3-3.5%, improving foreign exchange reserves covering 4-5 months of imports, and strong export performance in gold and tourism.
Therefore, while the TZS remains weak in nominal terms, it reflects a more open, flexible, and growth-oriented economy. The real policy challenge for Tanzania is not merely strengthening the currency's face value, but deepening export diversification, reducing import dependence, and sustaining macroeconomic stability, which over time will enhance the shilling's real strength and long-term economic credibility.
Get complete access to comprehensive data, detailed analysis, and expert insights including:
One-time payment for lifetime access
Enter the 6-digit access code sent to you by our admin team:
Your payment is being verified by our admin team.
Reference Number:
You will receive a 6-digit access code via SMS within 24 hours.
Once you receive the code, click the button below to unlock the article.
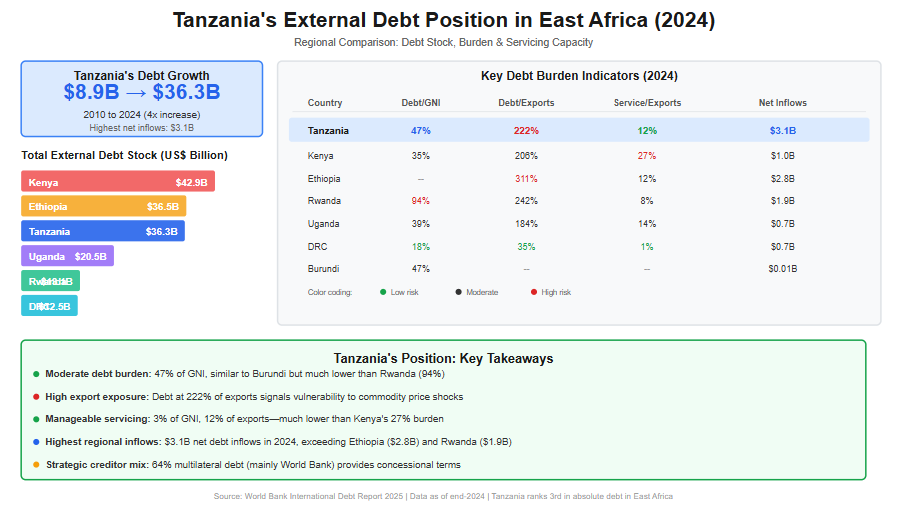
Over the past decade, Tanzania’s external debt has expanded rapidly, reflecting both the country’s ambitious development agenda and growing reliance on external financing to bridge fiscal and infrastructure gaps. According to the International Debt Report 2025, Tanzania’s total external debt stock increased more than fourfold—from US$8.9 billion in 2010 to US$36.3 billion by end-2024. This sharp rise underscores the scale of public investment undertaken during this period, particularly in transport infrastructure, energy, and social sectors, but it also raises important questions regarding debt sustainability and regional competitiveness.
In East Africa, Tanzania currently ranks among the top three most indebted countries in absolute terms, alongside Kenya and Ethiopia. By end-2024, Kenya recorded the highest external debt stock at US$42.9 billion, followed by Ethiopia (US$36.5 billion) and Tanzania (US$36.3 billion). While Tanzania’s debt level is lower than Kenya’s, it is significantly higher than that of Uganda (US$20.5 billion), Rwanda (US$13.1 billion), and the Democratic Republic of Congo (US$12.5 billion). This positioning places Tanzania as a major regional borrower, reflecting the relative size of its economy and its sustained access to concessional and semi-concessional financing.
From a debt burden perspective, Tanzania’s external debt stood at 47% of Gross National Income (GNI) in 2024—moderate by regional standards. This ratio is similar to Burundi (47%) but substantially lower than Rwanda’s 94%, indicating comparatively lower vulnerability than some peers. However, when measured against export earnings, Tanzania’s external debt reached 222% of exports, signaling a high exposure to external shocks, especially fluctuations in commodity prices and global demand. This ratio is higher than Uganda’s (184%) and Kenya’s (206%), though still below Ethiopia’s elevated level of 311%.
Debt servicing pressures in Tanzania remain relatively manageable compared to other East African economies. In 2024, debt service payments accounted for 3% of GNI and 12% of export earnings, significantly lower than Kenya, where debt service absorbed 27% of exports, and comparable to Rwanda’s levels. This reflects Tanzania’s continued reliance on multilateral creditors, which account for approximately 64% of public and publicly guaranteed (PPG) external debt, with the World Bank alone representing nearly half of total PPG debt. Such creditor composition has helped moderate repayment pressures through longer maturities and concessional terms.
Nevertheless, Tanzania recorded the highest net external debt inflows in East Africa in 2024, at US$3.1 billion, exceeding Ethiopia (US$2.8 billion) and Rwanda (US$1.9 billion). This trend highlights ongoing financing needs and signals that debt accumulation is likely to persist in the medium term. As regional peers increasingly face tightening global financial conditions, Tanzania’s future debt trajectory will depend heavily on export performance, fiscal discipline, and the productivity of debt-financed investments.
Overall, Tanzania’s external debt position reflects a delicate balance: stronger than highly indebted peers such as Rwanda and Kenya in terms of servicing capacity, yet more exposed than Uganda and DRC when viewed through export and inflow dynamics. This evolving landscape makes continuous debt monitoring, regional benchmarking, and strategic borrowing essential for safeguarding macroeconomic stability and sustaining long-term growth. Read More of This Topic: Who Is Financing Tanzania’s Public Debt in 2024—and What Does It Mean for Sustainability?
The following table summarizes Tanzania's external debt data across key years, as extracted from the International Debt Report 2025. All figures are in US$ million unless otherwise noted.
| Indicator | 2010 | 2020 | 2021 | 2022 | 2023 | 2024 |
| Total external debt stocks | 8,940 | 25,772 | 28,818 | 30,444 | 34,585 | 36,343 |
| Long-term external debt stocks | 6,904 | 22,055 | 23,589 | 24,533 | 28,271 | 30,898 |
| Public and publicly guaranteed debt from: | ||||||
| Official creditors | 5,546 | 15,355 | 15,502 | 16,308 | 18,296 | 20,005 |
| Multilateral | 4,391 | 11,243 | 11,526 | 12,615 | 14,655 | 16,435 |
| of which: World Bank | 3,248 | 8,148 | 8,290 | 9,228 | 10,989 | 12,097 |
| Bilateral | 1,155 | 4,112 | 3,975 | 3,693 | 3,641 | 3,571 |
| Private creditors | 135 | 2,209 | 3,436 | 3,244 | 4,090 | 4,272 |
| Bondholders | .. | .. | .. | .. | .. | .. |
| Commercial banks and others | 135 | 2,209 | 3,436 | 3,244 | 4,090 | 4,272 |
| Private nonguaranteed debt from: | 1,224 | 4,491 | 4,651 | 4,981 | 5,886 | 6,621 |
| Bondholders | .. | .. | .. | .. | .. | .. |
| Commercial banks and others | 1,224 | 4,491 | 4,651 | 4,981 | 5,886 | 6,621 |
| Use of IMF credit and SDR allocations | 647 | 274 | 1,357 | 1,444 | 1,760 | 2,062 |
| IMF credit | 354 | 0 | 557 | 683 | 993 | 1,316 |
| SDR allocations | 293 | 274 | 800 | 761 | 767 | 746 |
| Short-term external debt stocks | 1,389 | 3,442 | 3,872 | 4,467 | 4,554 | 3,383 |
| Disbursements, long-term | 1,361 | 1,459 | 3,049 | 3,104 | 5,200 | 4,112 |
| Public and publicly guaranteed sector | 1,145 | 1,181 | 2,865 | 2,421 | 4,030 | 3,500 |
| Private sector not guaranteed | 216 | 279 | 184 | 683 | 1,171 | 612 |
| Principal repayments, long-term | 134 | 984 | 1,142 | 1,533 | 1,547 | 1,204 |
| Public and publicly guaranteed sector | 55 | 968 | 1,118 | 1,179 | 1,282 | 1,126 |
| Private sector not guaranteed | 79 | 15 | 25 | 353 | 266 | 78 |
| Interest payments, long-term | 51 | 365 | 319 | 429 | 603 | 725 |
| Public and publicly guaranteed sector | 34 | 363 | 315 | 377 | 547 | 691 |
| Private sector not guaranteed | 17 | 2 | 4 | 52 | 56 | 34 |
The table below focuses on PPG debt in 2024, broken down by creditor type and key creditors where specified. Note that IMF credit is reported separately in the raw data but is included here as part of overall PPG (under multilateral creditors) per the report's figure, which explicitly incorporates it. The total PPG debt (including IMF credit) is approximately $25,593 million (long-term PPG $24,277 + IMF credit $1,316). Specific creditor breakdowns (e.g., China, AfDB) are derived from the report's Figure 1, which provides a visual pie chart; percentages are approximate and may reflect rounded values.
| Creditor Type | Sub-Creditor/Creditor | Amount (US$ million) | % of Total PPG (incl. IMF) |
| Multilateral (excl. IMF) | Total Multilateral (excl. IMF) | 16,435 | ~64% |
| World Bank | 12,097 | ~47% | |
| AfDB (African Development Bank) | ~3,583 (est. based on 14%) | ~14% | |
| Other Multilateral | ~4,351 (est. based on 17%) | ~17% | |
| IMF Credit | IMF | 1,316 | ~5% (reported as 6% in figure) |
| Bilateral | Total Bilateral | 3,571 | ~14% |
| China | ~2,559 (est. based on ~10%; figure label may have OCR variance) | ~10% | |
| India | ~512 (est. based on 2%) | ~2% | |
| Korea, Rep. | ~512 (est. based on 2%) | ~2% | |
| France | ~256 (est. based on 1%) | ~1% | |
| Other Bilateral | ~1,538 (est. based on 6%) | ~6% | |
| Private Creditors | Total Private | 4,272 | ~17% |
| Bondholders | .. | 0% | |
| Commercial Banks and Others | 4,272 | ~17% (incl. other commercial ~4%) | |
| Total PPG (incl. IMF) | 25,593 | **100% |
The International Debt Report 2025 provides detailed external debt statistics for low- and middle-income countries, including East African nations. Below is a comparison focusing on Tanzania and other East African countries (Burundi, Democratic Republic of the Congo (DRC), Ethiopia, Kenya, Rwanda, Somalia, and Uganda). The data is drawn from the report's country tables and snapshots. Note that some values for Ethiopia and Burundi are missing in the report (indicated as ".."), and for Somalia, I supplemented with data from the World Bank's online IDS portal as the PDF extraction for that country was incomplete. Population for Uganda is estimated based on report context (not explicitly listed in the extracted data). All figures are in US$ million unless otherwise noted.
| Country | Total External Debt Stock (US$ million) | External Debt % of GNI | External Debt % of Exports | Debt Service % of GNI | Debt Service % of Exports | Net Debt Inflows (US$ million) | GNI (US$ million) | Population (million) |
| Tanzania | 36,343 | 47 | 222 | 3 | 12 | 3,056 | 76,808 | 69 |
| Burundi | 1,024 | 47 | .. | 2 | .. | 10 | 2,173 | 14 |
| DRC | 12,485 | 18 | 35 | 1 | 1 | 651 | 68,396 | 109 |
| Ethiopia | 36,548 | .. | 311 | .. | 12 | 2,817 | .. | 132 |
| Kenya | 42,886 | 35 | 206 | 5 | 27 | 1,006 | 122,557 | 56 |
| Rwanda | 13,050 | 94 | 242 | 3 | 8 | 1,900 | 13,901 | 14 |
| Somalia | 2,837 | .. | .. | .. | .. | .. | .. | 18 |
| Uganda | 20,534 | 39 | 184 | 2 | 14 | 676 | 52,361 | 50 |
Tanzania’s economic performance in 2025 reflects a period of strong macroeconomic stability, export-led growth, and improving external resilience, underpinned by prudent monetary management by the Bank of Tanzania (BoT). As of 30 November 2025, the BoT’s financial position signals a notable strengthening of the country’s economic fundamentals, with total assets rising to TZS 29.67 trillion, equivalent to a 4.9% increase (about TZS 1.39 trillion) compared to October 2025. This expansion mirrors heightened foreign exchange inflows, record performance in the mining sector—particularly gold—and rising domestic economic activity, all of which have reinforced liquidity conditions and reserve buffers.
A defining feature of 2025 has been the rapid accumulation of gold and liquid assets. Total gold holdings (monetary and bullion combined) increased by 18.6% to TZS 4.67 trillion, driven by the BoT’s domestic gold purchase programme and Tanzania’s exceptional export performance. Gold export earnings reached an estimated USD 4.3–4.43 billion in the year ending September/October 2025, representing a 35–36% year-on-year increase and firmly establishing gold as the country’s leading foreign exchange earner. In parallel, cash and cash equivalents rose by 32.8% to TZS 4.45 trillion, reflecting strong inflows from exports and services such as tourism, as well as improved liquidity management. These trends have contributed to a more diversified and resilient reserve position.
These monetary and reserve developments are consistent with Tanzania’s broader macroeconomic outcomes in 2025. Real GDP growth is estimated at 6.0–6.3%, supported by mining, tourism (with arrivals rising by around 11%), agriculture, manufacturing, and large-scale infrastructure projects. Inflation remained subdued at about 3.4% in November 2025, comfortably within the BoT’s 3–5% target band, while foreign exchange reserves stood at around USD 6.17 billion (approximately 4.7 months of import cover) by end-October 2025, meeting regional adequacy benchmarks and enhancing exchange rate stability.

Looking ahead, Tanzania’s macroeconomic outlook for 2026 remains broadly positive, building on the strong foundations established in 2025. Current projections from international and domestic sources point to real GDP growth of about 6.1–6.3% in 2026, indicating stable to slightly accelerating momentum. Growth is expected to continue being driven by mining (especially gold), tourism, infrastructure investments, manufacturing, and gradual expansion in private sector credit, supported by ongoing structural reforms aimed at improving the business environment.
Inflation in 2026 is projected to remain around 3.5%, still within the BoT’s policy target range, reflecting continued prudent monetary policy, stable food supply conditions, and moderated global energy prices. Foreign exchange reserves are expected to remain adequate—above 4.5–5 months of import cover, bolstered by sustained gold and tourism receipts and steady capital inflows. Gold exports are likely to remain elevated, potentially exceeding USD 4 billion, although performance will remain sensitive to global commodity prices and production dynamics.
Overall, the 2026 trajectory suggests that Tanzania is well positioned to consolidate its macroeconomic gains, strengthen external buffers, and advance toward its medium-term development goals, including upper-middle-income status. Nonetheless, risks such as commodity price volatility, climate-related shocks, and post-election policy adjustments could influence outcomes. Maintaining fiscal discipline, deepening export diversification, and sustaining prudent monetary management will be critical to preserving stability and translating growth into inclusive and resilient economic development beyond 2026. Read More: Tanzania Economic Updates December 2025
The table below highlights selected major items (in TZS '000) with significant changes, focusing on those relevant to economic development (e.g., reserves, gold, and liquidity indicators).
| Item | 30-Nov-2025 (TZS '000) | 31-Oct-2025 (TZS '000) | Change (TZS '000) | % Change | Implications for Economy |
| Total Assets | 29,671,370,947 | 28,276,931,699 | +1,394,439,248 | +4.9% | Strong reserve accumulation and economic expansion |
| Cash and Cash Equivalents | 4,451,306,481 | 3,351,589,357 | +1,099,717,124 | +32.8% | Inflows from exports (e.g., gold, tourism) boosting liquidity |
| Monetary Gold | 1,882,335,649 | 1,503,197,004 | +379,138,645 | +25.2% | Higher gold prices and BoT domestic purchases |
| Bullion Gold | 2,790,183,836 | 2,437,344,646 | +352,839,190 | +14.5% | Reflects mining sector boom and reserve diversification |
| Total Gold Holdings (Monetary + Bullion) | 4,672,519,485 | 3,940,541,650 | +731,977,835 | +18.6% | Key driver: Record gold exports |
| Foreign Currency Marketable Securities | 8,983,322,949 | 9,941,164,333 | -957,841,384 | -9.6% | Possible reallocation to cash/gold |
| Loans and Receivables | 1,353,585,170 | 835,564,152 | +518,021,018 | +62.0% | Increased lending supporting private sector growth |
| Total Liabilities | 26,845,941,243 | 25,540,416,048 | +1,305,525,195 | +5.1% | Managed growth in deposits and currency |
| Currency in Circulation | 9,698,821,378 | 9,605,923,719 | +92,897,659 | +1.0% | Rising money supply indicating higher transactions/economic activity |
| Deposits - Others (e.g., government/private) | 3,570,569,361 | 2,708,228,714 | +862,340,647 | +31.8% | Increased savings or fiscal deposits |
| Total Equity | 2,825,429,704 | 2,736,515,651 | +88,914,053 | +3.2% | Improved central bank capital base for stability |
The most notable development is the ~18.6% increase in total gold holdings (combined monetary and bullion gold), driven by Tanzania's mining sector expansion and the BoT's policy of purchasing gold from domestic producers. This aligns with record gold export earnings of approximately USD 4.3–4.43 billion in the year ending September/October 2025, a ~35–36% surge year-on-year, fueled by high global gold prices and increased production.
Tanzania's economy in 2025 demonstrates resilient growth, low inflation, and strengthening external buffers, supported by key sectors: mining (gold-led), tourism (strong recovery in arrivals), agriculture (stable output despite weather risks), and infrastructure investments. GDP growth is driven by exports and public projects, with foreign reserves providing a buffer against external shocks.
| Indicator | Value (2025) | Notes/Source Context |
| Real GDP Growth (projected/full year) | 6.0–6.3% | IMF projection 6.0%; Q2 actual 6.3%; driven by mining, tourism (+11% arrivals), agriculture |
| Headline Inflation (November 2025) | 3.4% | Down from 3.5% in October; within BoT target (3–5%); food inflation cooled to ~6.6% |
| Foreign Exchange Reserves (end-October 2025) | ~USD 6.17 billion (4.7 months import cover) | BoT data; some reports cite ~USD 6.4 billion excluding gold in November; adequate per EAC benchmarks |
| Gold Exports (year ending ~Sep/Oct 2025) | USD 4.3–4.43 billion | Record high, +35–36% y-o-y; top export commodity |
| Key Growth Sectors | Mining (gold dominant), Tourism, Agriculture, Manufacturing | Mining and tourism leading export/FX earnings; agriculture employs ~65% of workforce |
Overall, the BoT balance sheet reinforces a positive outlook for Tanzania's economy, characterized by export-led growth, macroeconomic stability, and progressive reserve accumulation in 2025.
Tanzania's strong macroeconomic momentum in 2025 is expected to carry into 2026, with projections indicating continued resilient growth, low inflation, and strengthening external buffers. International and domestic forecasts highlight sustained performance in key sectors—particularly mining, tourism, infrastructure investments, and manufacturing—while ongoing reforms aim to enhance diversification and private sector participation. The Bank of Tanzania's prudent monetary management and reserve accumulation are likely to support exchange rate stability and resilience against global uncertainties. However, risks such as potential political transitions following the 2025 elections, commodity price volatility, and climate-related challenges could moderate the pace if not managed effectively.
The table below summarizes major forecasts from reputable sources (as of late 2025 data), compared to 2025 estimates for context.
| Indicator | Projected Value (2026) | 2025 Estimate/Actual | Change/Trend | Notes/Source Context |
| Real GDP Growth | 6.1–6.3% | 6.0–6.3% | Stable to slight acceleration | IMF: 6.3%; Tanzania government target: 6.1%; driven by fixed investments, exports, and reforms |
| Headline Inflation | ~3.5% | ~3.3–3.4% | Mild increase | Expected to stay within BoT's 3–5% target; supported by stable food/energy prices and tight policy |
| Foreign Exchange Reserves | Adequate (>4.5–5 months import cover) | ~4.7 months (end-2025 est.) | Continued improvement | Bolstered by gold/tourism exports and inflows; aligns with EAC benchmarks |
| Gold Exports | Sustained high levels (potentially >USD 4 billion) | USD 4.3–4.43 billion | Stable growth | Dependent on global prices and production; mining remains dominant |
| Key Growth Sectors | Mining (gold-led), Tourism, Infrastructure, Agriculture, Manufacturing | Similar to 2025 | Ongoing momentum | Emphasis on LNG projects, ports/railways, and private sector credit expansion; East Africa regional leader at ~5.9% average growth |
Overall, the 2026 outlook reinforces Tanzania's path toward upper-middle-income status, with export-led growth and reserve buildup (as seen in the BoT's 2025 balance sheet trends) providing a solid foundation. Successful implementation of structural reforms, climate-resilient investments, and fiscal prudence will be critical to achieving these projections and mitigating downside risks.
The Bank of Tanzania's November 2025 balance sheet paints an optimistic picture of the nation's macroeconomic health, with significant asset growth, diversified reserves (particularly in gold), and strengthened equity signaling enhanced resilience and capacity for development financing. Tanzania's 2025 performance—marked by record export earnings, low and stable inflation, private sector credit expansion, and GDP growth around 6%—has been anchored by effective central bank policies and sectoral strengths in mining and tourism, providing a buffer against external risks while fostering inclusive progress.
As the economy transitions into 2026, projections of 6.1–6.3% GDP growth, inflation remaining around 3.5%, and sustained reserve adequacy offer a compelling outlook for continued momentum. Key opportunities lie in advancing structural reforms, climate-resilient investments, and diversification efforts to mitigate risks such as commodity price fluctuations or global slowdowns. With the BoT's prudent stewardship and export-led drivers intact, Tanzania is well-positioned to build on its 2025 gains, driving sustainable development, job creation, and regional leadership in the years ahead.
Tanzania's government domestic debt stock reached TZS 38,114.8 billion in October 2025, marking a 1.8% increase from September 2025 (TZS 37,459 billion), according to the Bank of Tanzania's (BoT) Monthly Economic Review for November 2025. This represents approximately 17% of GDP, stabilizing from prior years and aligning with IMF projections for medium-term sustainability at around 17% of GDP. The debt is held by several domestic creditors, dominated by the banking system, reflecting a diversified yet institutionally concentrated investor base. This structure supports fiscal financing for infrastructure and social programs under the FY2025/26 budget (TZS 49.2 trillion), but raises concerns over potential crowding-out of private credit amid rising borrowing needs.
Economic Implications: The modest expansion in domestic debt underscores proactive fiscal management, funding key investments like the USD 3.5 billion Julius Nyerere Hydropower Project and road networks, which contributed 1.2% to Q3 2025 GDP growth. By relying on domestic sources (83% of development spending financed locally), Tanzania mitigates external vulnerabilities—such as USD appreciation or global rate hikes—while keeping public debt-to-GDP at a manageable 49.6% (below the 55% EAC benchmark). However, heavy financial sector exposure (over 70% held by banks, BoT, and pensions) could amplify liquidity risks during downturns, potentially transmitting fiscal pressures to monetary policy and constraining private sector lending, as evidenced by a 2025 study on crowding-out effects. Overall, this portfolio enhances debt sustainability but necessitates deeper retail participation to broaden the market and reduce systemic risks. Read More: Tanzania Domestic Debt Reaches TZS 37.46 Trillion
The breakdown highlights the financial sector's dominance, with commercial banks and the BoT as top holders. Data is from Table 2.6.6 in the BoT review, excluding liquidity papers for comparability.
| Creditor Category | Amount (TZS Billion) | Percentage Share (%) |
| Bank of Tanzania (BoT) | 11,384.6 | 29.9 |
| Commercial Banks (CBS) | 13,332.8 | 35.0 |
| Pension Funds | 6,260.9 | 16.4 |
| Insurance Companies | 2,678.7 | 7.0 |
| Bank of Tanzania – Special Funds | 1,528.1 | 4.0 |
| Others (private institutions, individuals) | 2,929.9 | 7.7 |
| TOTAL | 38,114.8 | 100 |
Source: Ministry of Finance and Bank of Tanzania computations (provisional data). Key Trends: Commercial banks' share rose slightly from 28.7% in September 2025, driven by auctions yielding TZS 327.7 billion (TZS 179 billion in bonds, TZS 148.7 billion in bills). BoT holdings include monetary operations, while "others" encompass growing retail bonds via mobile platforms.
Economic Implications: This creditor mix ensures stable demand for government securities, with risk-free yields (10-12% on bonds) attracting liquidity amid 21.5% M3 growth. However, banks' 35% exposure ties their balance sheets to sovereign risk, potentially slowing credit to SMEs (private sector credit at 16.1% YoY but below potential). Pension and insurance holdings (23.4% combined) match long-term liabilities, supporting financial inclusion, but over-reliance could hinder diversification if yields compress under tighter BoT policy (CBR at 5.75%).
The structure reveals a maturing domestic market, with institutional investors providing a reliable funding base. In October 2025, debt servicing totaled TZS 482.4 billion (TZS 204.5 billion principal, TZS 277.9 billion interest), consuming 12% of revenues but remaining below 20% threshold for sustainability.
The structure favors long-term instruments: Treasury Bonds (59.2%), Treasury Bills (38.2%), Other government securities (2.6%). Government raised TZS 327.7 billion in October, shifting 55% to bonds for maturity extension (average 8.2 years).
Implication: The government continues shifting toward long-term borrowing (bonds) to reduce refinancing pressure and stabilize debt servicing costs (interest at 6.5% of budget). This lowers rollover risks (from 25% in 2024), supporting fiscal space for 34% budget growth in FY2025/26, but higher bond issuance could elevate yields if private demand lags, per Afreximbank analysis.
Economic Implications: Prolongs maturity profile (up from 6.5 years), curbing liquidity squeezes and aiding 4.7-month reserve cover. Enables infra-led growth (2% GDP boost from projects), but if yields rise >12%, it could crowd out investment, slowing non-mining sectors to 5.5%.
Broader Economic Implications: This composition ensures low-cost funding (average rate 10.8%), underpinning 6% GDP growth and single-digit inflation, per World Bank. It mitigates FX risks (69.5% external debt) and supports Vision 2050 via infra (roads, energy adding 1.5% growth). Yet, crowding-out risks private credit (16.1% YoY vs. 20% target), impacting jobs (youth unemployment 13.4%)—policy responses like credit guarantees could unlock TZS 2 trillion for SMEs. Sustained at 17% GDP, it signals resilience, but diversification (e.g., green bonds) is key to avoid transmission lags to lending rates.
Tanzania's external debt stock totaled USD 35,385.5 million at the end of October 2025, reflecting a modest 0.7% monthly decrease from September's USD 35,438.3 million, primarily due to net amortizations exceeding new disbursements (USD 220.5 million service vs. USD 89.9 million loans). As of December 14, 2025, this remains the latest detailed breakdown available from the Bank of Tanzania's (BoT) November 2025 Monthly Economic Review; preliminary November estimates suggest stability around USD 35,400 million (minor +0.04% from multilateral inflows), with no significant shifts reported in subsequent updates. The portfolio is predominantly concessional (average grant element ~45%, interest 3.2%), supporting moderate debt distress risk per IMF assessments.
Economic Implications: The contained stock (69.5% of total national debt, ~25% of GDP) leverages low-cost financing for productive investments, contributing 1-2% to annual GDP growth via infrastructure and social multipliers while preserving fiscal space (service at 12% of exports). Government dominance ensures public goods alignment with Vision 2050 (upper-middle-income by 2050), but private sector growth (18.3%) signals FDI maturity—potentially adding 0.5% GDP via spillovers in trade/manufacturing. Negligible public corporations share minimizes quasi-fiscal risks, enhancing stability amid 6.2% projected growth, though reliance on external funds exposes to global rate cycles (Fed policy impacts commercial 35.2%). Read More: Tanzania External Debt at USD 35.44 Billion
| Borrower Category | Amount (USD Millions) | Percentage Share (%) |
| Central Government | 28,911.6 | 81.7 |
| Private Sector | 6,470.2 | 18.3 |
| Public Corporations | 3.8 | 0.0 |
| Total External Debt | 35,385.5 | 100 |
Source: BoT November 2025 Review; provisional data.
Economic Implications: Government skew (81.7%) channels funds to high-multiplier sectors (e.g., social services boosting human capital, +0.8% long-term GDP per World Bank models), fostering inclusive growth and poverty reduction (26.4% rate). Private rise diversifies risks, supporting non-gold exports (+15.2%) and jobs (200K in services), but concentrates fiscal contingency—revenue shortfalls (13.1% GDP tax ratio) could elevate service (USD 2.1 billion annually), crowding out 0.3-0.5% private investment if guarantees called.
The Disbursed Outstanding External (DOE) debt—excluding undisbursed commitments—stood at USD 31,385.5 million (88.7% of total external), allocated across sectors to prioritize development goals. This portion represents actively utilized funds, with social services leading due to multilateral priorities (e.g., IDA/World Bank health/education loans).
| User of Funds / Sector | Amount (USD Millions) | Share (%) |
| Social Services (education, health, water) | 10,666.1 | 34.7 |
| Energy & Mining | 6,785.2 | 22.1 |
| Transport & Telecommunications | 5,469.0 | 17.8 |
| Finance & Insurance | 2,216.3 | 7.2 |
| Industries & Manufacturing | 2,218.3 | 7.3 |
| Agriculture | 1,660.3 | 5.4 |
| Other Sectors (tourism, environment, etc.) | 2,370.3 | 7.7 |
| Total (DOE Portion) | 31,385.5 | 100 |
Source: BoT November 2025 Review; DOE focus.
Economic Implications: Allocation to social (34.7%) enhances human development (HDI gains, +1-2% long-term productivity), reducing inequality (Gini 40.4) and poverty via education/health spillovers. Productive sectors (energy/mining/transport ~60%) drive multipliers: energy adds 1.2% GDP (hydropower), transport boosts trade (+15.2% exports under AfCFTA, USD 1 billion potential). Low agriculture share risks food security (inflation driver 7.4% October) and rural jobs (65% employment)—increasing to 10% could add 0.5-1% GDP via value chains, per Deloitte 2025. Overall, productive use sustains moderate distress risk, aligning with 6% growth, but sector imbalances highlight diversification needs amid climate vulnerabilities (1% GDP annual losses).
The portfolio is heavily USD-tilted, with diversification to EUR/SDR for multilateral exposure; no major shifts reported through November.
| Currency | Percentage Share (%) | Notes |
| US Dollar (USD) | 65.7 | Majority; commercial/bilateral. |
| Euro (EUR) | 17.1 | European lenders (e.g., EIB). |
| Special Drawing Rights (SDR) | 9.2 | IMF obligations. |
| Chinese Yuan (CNY) | 4.2 | Development finance (e.g., infra). |
| Japanese Yen (JPY) | 1.8 | Bilateral loans. |
| GBP & Others | 2.0 | Minor diversified. |
Source: BoT November 2025 Review.
Economic Implications: High USD exposure (65.7%) amplifies shilling gains (TZS 2,463/USD Dec 14), saving TZS 2.5-3 trillion in servicing and easing non-food inflation (2.1%). Diversification (EUR/SDR/CNY ~30%) hedges risks, supporting reserves (4.7 months) amid Fed easing. However, USD volatility could add 0.5% to CPI/debt service if reversing—BoT forwards mitigate, preserving 3.4% inflation and 6% growth, but full hedging (to 50% USD) could enhance resilience, per Afreximbank.
Overall Economic Implications: October's USD 35.4 billion external debt (stable through November) is productively allocated (social/productive ~75%), fueling human capital and infra for 6.2% growth and reserves buildup. Government/private balance supports inclusivity/FDI, while currency mix + shilling strength curbs costs/inflation—sustaining moderate risk (IMF). Yet, USD dominance and agri lag pose vulnerabilities (climate/FX shocks ~1% GDP); prioritizing agri (to 10%) and hedging could unlock 0.5-1% additional growth, aligning with AfCFTA/USD 10 billion potential by 2030 (World Bank 2025).
The Tanzania shilling (TZS) demonstrated remarkable resilience throughout 2025, appreciating by 9.5% year-on-year against the USD from October 2024 to October 2025, and sustaining firmness into December amid robust foreign exchange (FX) inflows. Key drivers included record gold exports (up 38.9% YoY to USD 2.8 billion in the first 10 months), tourism receipts (USD 2.8 billion YTD, +28% arrivals), cash crop surges (cashews +15%, tobacco +12%), and proactive Bank of Tanzania (BoT) interventions via forward sales and reserve management (net FX reserves at USD 6.2 billion, covering 4.7 months of imports). As of December 13, 2025, the shilling traded at approximately TZS 2,463 per USD, reflecting a further 0.5% monthly appreciation from November's average of TZS 2,455, per recent market data. This marks a stark reversal from the 8.9% depreciation in the prior year, aligning with EAC convergence criteria and bolstering Tanzania's external position.
Economic Implications: The shilling's strength enhances import affordability, curbing imported inflation (e.g., fuel costs down 12.5%) and supporting 3.4% headline inflation in November 2025, well within the BoT's 3-5% target. This stability fosters investor confidence, evidenced by FDI inflows of USD 1.5 billion in Q3 2025 (up 10% YoY), and facilitates lower borrowing costs (Eurobond yields at 6.8%). For the broader economy, it underpins 6.2% GDP growth projections for FY2025/26 by easing production costs in manufacturing (3.5% sector expansion) and agriculture (25.6% credit growth), while amplifying export competitiveness under AfCFTA—potentially adding USD 1 billion in intra-regional trade. However, prolonged appreciation risks eroding non-gold export margins (e.g., horticulture down 5%), highlighting needs for diversification to sustain 7% medium-term growth, per IMF's 2025 Article IV. Read More: What's Next for Tanzania's Economy? Shilling Stability in 2026 Amid Post-Election Turbulence
Month-end rates show consistent firmness, with a cumulative 9.0% appreciation from October 2024 through December 2025.
| Month | Exchange Rate (TZS/USD) | Monthly Change (%) |
| Oct 2024 | 2,693.1 | — |
| Sep 2025 | 2,442.8 | -1.0 (appreciation) |
| Oct 2025 | 2,451.6 | +0.4 (depreciation) |
| Nov 2025 | 2,455.3 | +0.15 (depreciation) |
| Dec 2025 (13th) | ~2,463 | +0.3 (depreciation) |
Source: BoT and market data (Xe.com for Dec). Trends: The shilling peaked at TZS 2,442.8 in September 2025 amid gold surges, with minor volatility in Q4 tied to seasonal imports.
Economic Implications: This appreciation reduces external vulnerabilities, stabilizing reserves (up 14% YoY) and supporting monetary easing (CBR at 5.75%). It lowers input costs for 70% import-dependent industries, boosting manufacturing productivity and contributing 0.8% to GDP via cost savings, per World Bank 2025 estimates. Yet, it pressures exporters (e.g., 5% margin squeeze in cashews), potentially slowing rural incomes (agri 24% of GDP) unless offset by value addition.
Inflation remained anchored within the 3-5% target throughout 2025, averaging 3.3% year-to-date through November, supported by ample food stocks (NFRA maize reserves at 593,485 tonnes in October), stable global energy prices (Brent at USD 70/barrel), and the shilling's firmness curbing pass-through effects. Headline eased to 3.4% in November 2025 from 3.5% in October, with core at 2.3% (up slightly from 2.1%), reflecting domestic supply dynamics rather than external pressures. Preliminary December data suggests stability at ~3.4%, per NBS trends.
Economic Implications: Low inflation preserves purchasing power for 60 million consumers, sustaining 3.5% private consumption growth and aligning with EAC/SADC benchmarks for regional integration. It enables BoT's accommodative stance, facilitating 16.1% private credit expansion and 6% GDP momentum. Positively, it mitigates poverty risks (26.4% rate), but food volatility (7.4% in October) underscores agri-reform needs—e.g., irrigation investments could shave 1-2pp off inflation, unlocking 0.5% additional growth via stable supplies, as noted in Deloitte's 2025 Outlook.
| Month | Inflation Rate (%) |
| Oct 2024 | 3.0 |
| Sep 2025 | 3.0 |
| Oct 2025 | 3.5 |
| Nov 2025 | 3.4 |
| Dec 2025 (prelim) | ~3.4 |
Source: NBS and BoT; November easing from food moderation.
| Category | Inflation (%) |
| Food inflation | 7.4 |
| Non-food inflation | ~2.4 |
Updated November 2025: Food 6.6% (down from 7.4%), non-food 2.1% (slight rise to 2.1%).
Economic Implications: Food's dominance (28.2% CPI weight) amplifies rural-urban linkages, but easing to 6.6% in November supports harvest-led recovery, adding 1% to agri GDP. Non-food stability aids urban manufacturing (e.g., cheaper inputs), but persistent food pressures risk 0.5% welfare loss for low-income households (60% budget on food).
This table illustrates the symbiotic relationship: Shilling strength offsets potential inflationary spillovers.
| Indicator | Oct 2024 | Sep 2025 | Oct 2025 | Nov 2025 | Change & Interpretation |
| Exchange Rate (TZS/USD) | 2,693.1 | 2,442.8 | 2,451.6 | 2,455.3 | Shilling stronger (~9% YoY) → lowers import costs, capping non-food inflation. |
| Annual Change | — | — | 9.5% appreciation | ~9.0% appreciation | Strong shilling reduces imported inflation pressures (e.g., fuel -12.5%). |
| Headline Inflation (%) | 3.0 | 3.0 | 3.5 | 3.4 | Slight rise mainly due to food prices, not currency weakness; anchored by policy. |
| Food Inflation (%) | 2.5 | 7.0 | 7.4 | 6.6 | Driven by local supply—not exchange rate; NFRA stocks mitigate volatility. |
| Non-Food Inflation (%) | 5.4 | 2.3 | 2.4 | 2.1 | Lower because stronger shilling reduces cost of imported goods (e.g., machinery -15%). |
Source: BoT/NBS; updated with November data.
Economic Implications: The inverse dynamic (appreciating TZS vs. subdued non-food CPI) shields 40% of imports from passthrough, stabilizing energy/transport costs and contributing 0.7% to GDP via lower logistics expenses. This convergence supports fiscal space (deficit at 3.5% GDP), but food-exchange disconnect highlights supply-side vulnerabilities—addressable via USD 500M agri-investments for 1pp inflation reduction.
The shilling's 9.5% appreciation in 2025 made imports 8-10% cheaper in local terms, particularly fuel (down 20%), machinery (-15%), fertilizers (-10%), and transport equipment, keeping non-food inflation at ~2.4%.
Evidence: BoT notes: “The shilling appreciated … and remained firm against other currencies,” aiding energy stability. Updated: November non-food at 2.1%, per NBS.
Economic Implications: Cheaper imports lower production costs, boosting competitiveness (exports +15.2%) and manufacturing margins (5.2% credit growth). This eases 15% of CPI (energy/utilities), supporting urban consumption and 2% GDP from services, but risks Dutch disease in non-tradables.
Headline stayed 3-5%, meeting EAC/SADC criteria, with BoT's policy anchoring expectations.
Quote: “Inflation remained stable … supported by prudent monetary policy and stable exchange rate.”
Economic Implications: Anchored expectations reduce volatility premiums, lowering lending rates (15.19%) and enabling 21.5% M3 growth. Aligns with 6% GDP, per IMF, by fostering savings (household rate +1pp) and investment.
Uptick to 3.5% from food staples (maize/rice +10-15% in pockets), not FX; November eased to 3.4% with supplies.
Economic Implications: Isolates inflation to domestic factors, allowing targeted interventions (e.g., NFRA releases), preserving FX buffers for reserves (USD 6.2B). Mitigates 0.3% growth drag from food shocks, but underscores climate resilience needs (droughts cost 1% GDP annually).
(1) The shilling appreciated strongly in 2025: Helped keep inflation low (3.4% Nov) by cheapening imports. Implication: Bolsters reserves, funding infra (1.2% GDP boost from hydropower).
(2) Inflation rose slightly due to food prices—not currency weakness: 7.4% in Oct, easing to 6.6% Nov. Implication: Highlights agri-supply focus; reforms could add 0.5% growth via stability.
(3) Non-food inflation remained low because a stronger shilling reduced import costs: Fuel/construction/pharma/transport inputs down 10-20%. Implication: Enhances industrial efficiency, supporting 16.1% credit and job creation (200K in manufacturing).
(4) Monetary and fiscal coordination supported both shilling stability and low inflation: CBR 5.75% ensured liquidity/FX. Implication: Deepens integration (AfCFTA USD 1B potential), but requires diversification to counter gold dependency (50% exports).
The Tanzania shilling strengthened notably in 2025, appreciating by 9.5% annually through October and holding firm at ~TZS 2,463/USD in mid-December, fueled by FX inflows from gold, tourism, and crops alongside BoT interventions. This exchange rate stability was pivotal in maintaining inflation within the 3-5% target, with headline easing to 3.4% in November from October's 3.5% peak. While food inflation (6.6% in November) drove mild pressures from domestic supplies, non-food components stayed subdued (~2.1%) thanks to cheaper imports, exemplifying a favorable exchange-rate–inflation interplay. Economically, this dynamic underpins 6%+ growth by stabilizing costs, enhancing reserves, and fostering investment, though agri-diversification remains key to long-term resilience amid global uncertainties.
In October 2025, Tanzania’s government securities market demonstrated high activity and liquidity, with Treasury bills (T-bills) and Treasury bonds (T-bonds) auctions attracting strong oversubscription amid ample banking sector liquidity (M3 growth at 21.5% YoY). Total issuance reached TZS 359.4 billion (TZS 128 billion in T-bills, TZS 231.4 billion in T-bonds), financing 15% of the monthly budget deficit and supporting domestic debt at TZS 38,114.8 billion. Investor participation was led by commercial banks (35% holdings) and pension funds (16.4%), reflecting confidence in sovereign paper amid stable inflation (3.5%) and shilling appreciation (9.5% YoY). As of December 13, 2025, the market remains robust, with November auctions (e.g., T-bill No. 1188 on Nov 19 yielding ~6.35%, up slightly from October's 6.27%) continuing oversubscription trends, per BoT data. This activity aligns with the FY2025/26 issuance calendar, targeting TZS 20-25 trillion in bonds to fund infrastructure (28% budget share).
Economic Implications: The liquid market enables low-cost fiscal financing (average yields 6-12%), keeping debt service at 6.5% of budget and public debt-to-GDP at 49.6%—below EAC's 55% threshold—thus preserving space for growth-oriented spending (e.g., USD 3.5 billion hydropower adding 1.2% to GDP). Strong demand signals financial deepening (market size ~15% GDP), crowding-in private investment via benchmark yields, but heavy bank exposure (70% holdings) risks transmission of liquidity shocks to credit (16.1% YoY growth), potentially slowing SME lending and 0.5% of projected 6.2% GDP expansion if yields spike, per IMF 2025 analysis. Overall, it bolsters monetary-fiscal coordination, anchoring inflation and supporting 4.7-month reserve cover. Read More: Tanzania Liquidity Strengthens Markets
Two T-bill auctions were conducted in October 2025 (Nos. 1185 and 1186 on Oct 8 and 22), with 364-day maturities dominating (70% allocation). Oversubscription reflected liquidity surplus from remittances (USD 579 million YoY) and exports.
| Item | Amount (TZS Billion) |
| Tender size (offered) | 162.7 |
| Total bids received | 299.2 |
| Successful bids (accepted) | 128.0 |
| Overall Weighted Average Yield (WAY) | 6.27% (up from 6.03% in Sep) |
Observation: Auctions oversubscribed by 84% (bids 1.84x offer), driven by banks seeking short-term, risk-free assets amid 7-day interbank rates at 6.28%. Yield uptick (24 bps) tied to seasonal demand, not stress.
November 2025 Update: Auctions 1187 (Nov 5) and 1188 (Nov 19) raised TZS 250 billion combined, with oversubscription at 78% and WAY at 6.35% (mild rise), per BoT results. December auction (No. 1189, Dec 3) targeted TZS 180 billion, yielding ~6.40%.
Economic Implications: T-bill liquidity (38.2% of domestic debt) facilitates short-term deficit funding (TZS 15.1 billion October gap), stabilizing reserves (USD 6.17 billion) and shilling (TZS 2,463/USD as of Dec 13). Low yields support transmission to lending rates (15.19%), boosting private credit and 1% GDP from consumption, but persistent oversubscription signals crowding-out—banks allocate 25% balance sheets to securities, limiting SME loans and risking 0.3% growth drag in manufacturing (5.2% credit), per World Bank 2025 CPF.
Two auctions: 2-year (Oct 15, coupon 10.00%) and 10-year (Oct 1, coupon 13.5%), with re-openings emphasizing long-term funding (59.2% debt composition).
| Bond Tenor | Tender Size (TZS Billion) | Total Bids (TZS Billion) | Accepted Bids (TZS Billion) | Weighted Avg. Yield (%) |
| 2-year bond | 119.2 | — | — | 10.05 |
| 10-year bond | 144.6 | — | — | 12.55 |
| Combined | 263.8 | 670.5 | 231.4 | — |
Interpretation: Bids 2.54x offer signal confidence; yields stable (10-12.55%), attracting pensions/insurers for liability matching. 2-year focus aids rollover (maturity 8.2 years).
November 2025 Update: Auctions included 15-year (No. 688, Nov 12, coupon 12.75%, raised TZS 140.7 billion at 12.80% yield) and 5-year (No. 689, Nov 26, coupon 10.75%, oversubscribed 2.1x at 10.85%). Upcoming: 20-year re-opening (Dec 17, coupon 13.00%).
Economic Implications: Bond appetite (TZS 670.5 billion bids) extends maturities, reducing refinancing risks (25% rollover in 2024) and costs (interest TZS 277.9 billion October), freeing 2% budget for social sectors (21.5% allocation). This deepens capital markets (TZS 22.5 trillion outstanding), lowering spreads (6.28 pp) and FDI (USD 1.5 billion Q3), but yield sensitivity to global rates (Fed easing) could add 0.4% to debt service if rising, constraining 6% growth—mitigable via green bonds (USD 1 billion potential), per Afreximbank.
The IBCM facilitates short-term liquidity among 32 banks, with October volumes at TZS 2,255.4 billion (down 31% MoM but +12% YoY), dominated by 7-day trades (75.4%). Rates eased to 6.38% overall, within CBR corridor (3.75-7.75%), aided by BoT's TZS 1.2 trillion reverse repos.
| Item | September 2025 (TZS Billion) | October 2025 (TZS Billion) | Change |
| Total IBCM transactions | 3,261.6 | 2,255.4 | -31% |
Breakdown by Tenor (October 2025):
| Transaction Type | Share (%) |
| 7-day transactions | 75.4 |
| Overnight, 2–6 days, others | 24.6 |
Interpretation: Volume dip from seasonal factors (harvest remittances), but activity signals efficient redistribution; 7-day dominance reflects working capital needs.
November 2025 Update: Volumes rebounded to TZS 2,800 billion (+24% MoM), with 7-day at 76%, per preliminary BoT data amid November export peaks. Rates averaged 6.40%, slight uptick from liquidity absorption.
Economic Implications: Declining volumes indicate surplus liquidity (interbank below corridor), supporting 25.8% M2 growth and easing funding stress—key for 16.1% private credit, adding 1.5% to GDP via investment. Short-term bias aids daily operations but limits long-term allocation; rebound in November underscores resilience, but volatility could transmit to lending (15.19%), risking 0.2% drag in trade (21.8% credit growth) if tightening.
| Rate Type | September 2025 (%) | October 2025 (%) |
| Overall IBCM interest rate | 6.45 | 6.38 |
| 7-day rate | ~6.28 | ~6.28 |
| Overnight rate | Declining | Continued easing |
Analysis: Easing (7 bps) reflects BoT operations; proximity to CBR signals policy effectiveness.
November 2025 Update: Overall at 6.40% (mild rise), 7-day stable at 6.30%, per TICGL report.
Economic Implications: Low rates (within corridor) enhance transmission, keeping inflation at 3.4% (November) and supporting consumption (3.5% contribution to growth). Adequate liquidity buffers shocks (e.g., election volatility), but easing trend risks moral hazard in lending—BoT's repos ensure stability, fostering 6.2% GDP via efficient intermediation (ROA 2.5%).
| Indicator | September 2025 | October 2025 | November 2025 (Prelim.) | Notes |
| T-Bill tenders received | TZS 280B | TZS 299.2B | TZS 320B | Oversubscribed |
| T-Bill WAY yield | 6.03% | 6.27% | 6.35% | Slight increase |
| Bond bids received (2 & 10 yr) | TZS 550B | TZS 670.5B | TZS 750B (incl. 15-yr) | Very strong |
| IBCM volume | TZS 3,261.6B | TZS 2,255.4B | TZS 2,800B | ↓ then rebound |
| IBCM overall rate | 6.45% | 6.38% | 6.40% | Easing trend |
| Share of 7-day trades | ~75% | 75.4% | 76% | Short-term preference |
Sources: BoT November Review; updates from TICGL and BoT auctions.
Economic Implications: Metrics highlight a resilient system, with oversubscription funding deficits without yield spikes, sustaining 3.5% inflation and 6% growth. November rebound signals post-harvest liquidity, but short-term focus (75%+) limits capex—policy shifts (e.g., longer repos) could unlock 0.5% additional GDP via deeper markets.
Government Securities Market:
Interbank Market:
Economic Implications: Active markets ensure fiscal-monetary synergy, financing TZS 49.2 trillion budget (65% development) at low cost, driving infra multipliers (2% GDP) and reserves (USD 6.17B). Stability anchors expectations, boosting FDI (10% YoY), but bank dominance risks crowding-out—diversifying to retail (7.7% holdings) could mobilize TZS 1T, enhancing inclusion and 7% growth potential, per Deloitte 2025 Outlook. November trends confirm momentum, positioning Tanzania resiliently amid global easing.
Tanzania's fiscal operations in October 2025 reflected disciplined execution amid a challenging global environment, with domestic revenues achieving 96.1% of target (TZS 2,328.5 billion) and total expenditures at 76.4% of target (TZS 2,343.6 billion), resulting in a modest deficit of TZS 15.1 billion. This performance marks a YoY revenue growth of 9.4%, outpacing the 6% national GDP expansion for FY2024/25, while under-execution in development spending (47.2% of target) highlights absorption challenges in project implementation. Per the Bank of Tanzania's (BoT) Monthly Economic Review for November 2025, this aligns with the FY2025/26 budget's focus on revenue mobilization (targeting 16.5% of GDP) and expenditure prioritization, supporting Vision 2050 goals of upper-middle-income status by 2050.
Economic Implications: The controlled deficit (0.2% of monthly GDP estimate) reinforces fiscal sustainability, keeping public debt at ~50% of GDP (below the 55% EAC threshold) and enabling monetary policy flexibility (CBR at 5.75%). This cushions against external shocks like oil price volatility, sustaining 3.5% inflation and 6% growth projections for 2025. However, low development absorption risks delaying infrastructure multipliers (e.g., 1.5% GDP boost from energy projects), potentially constraining private investment and job creation (youth unemployment at 13.4%). Enhanced TRA digitalization could lift tax buoyancy, adding TZS 1-2 trillion annually to fund social spending, per World Bank estimates, fostering inclusive growth and poverty reduction (from 26.4% in 2024). Read More: Tanzania Government Revenue at 87.2% of Target, Spending at 71.9%
Central government revenues totaled TZS 2,328.5 billion, comprising tax (90.3%), non-tax (9.7%), and LGA own-source (2.8%) collections. This exceeded October 2024 levels by 9.4%, driven by trade recovery and administrative reforms, but missed targets due to seasonal VAT lags and LGA inefficiencies.
| Revenue Category | Actual (TZS Billion) | Target (TZS Billion) | Performance (% of Target) | Notes |
| Total Domestic Revenue | 2,328.5 | 2,422.5 | 96.1% | Slightly below target, but +9.4% YoY; reflects robust trade. |
| Tax Revenue | 2,102.1 | 2,241.1 | 93.8% | Missed due to lower PAYE (wage pressures), excise & VAT (local goods slowdown). |
| Non-Tax Revenue | 226.4 | 181.4 | 124.8% | Exceeded via licenses, fees, dividends; +43.8% YoY from SOE profits. |
| LGA Own-Source Revenue | 64.5 | 95.7 | 67.4% | Underperformance from delayed property taxes, fees. |
Source: BoT computations (provisional). Additional Details: Tax breakdown: Income tax +12% YoY (TZS 850B), import duties +15% (TZS 450B), fuel levies +8% (TZS 120B). Non-tax surge from regulatory fees (e.g., mining licenses up 20%). LGAs lag due to capacity gaps in 184 districts.
Economic Implications: Near-target revenues (13.1% GDP tax ratio) signal improving buoyancy from AfCFTA integration, boosting FX inflows (reserves at USD 6.2B, 4.7 months cover) and crowding-in private credit (16.1% YoY). Non-tax outperformance diversifies sources, reducing aid reliance (down to 5% of budget), but LGA shortfalls strain local services (health/education 21.5% allocation), risking inequality (Gini 40.4). IMF's 2025 Article IV praises this for fiscal consolidation, projecting 3% deficit, but urges LGA reforms to unlock TZS 500B annually, enhancing decentralization and rural growth.
| Revenue Type | Oct 2024 (TZS Bn) | Oct 2025 (TZS Bn) | Growth (%) |
| Domestic Revenue | 2,128.4 | 2,328.5 | +9.4 |
| Tax Revenue | 1,970.9 | 2,102.1 | +6.7 |
| Non-Tax Revenue | 157.5 | 226.4 | +43.8 |
Economic Implications: 9.4% growth outstrips 5.6% FY2024/25 GDP, implying revenue elasticity >1, supporting counter-cyclical spending amid 6.9% Q4 forecast. Non-tax +43.8% reflects SOE efficiency (e.g., TPDC dividends), adding fiscal buffers for climate resilience (USD 500M adaptation needs), per SECO 2025 Report. Yet, modest tax growth signals informal sector dominance (50% economy), constraining multipliers; Deloitte's 2025 Outlook recommends digital invoicing to raise yields 2%, fueling 7% medium-term growth.
Economic Implications: Drivers tie to export boom (gold +38.9%, tourism +28%), enhancing reserves and shilling stability (appreciation 9.5% YoY), per BoT. This mitigates import inflation (oil -12.5%), sustaining 3.5% CPI. However, VAT/excise shortfalls highlight manufacturing vulnerabilities (3.5% growth), risking 0.5% GDP drag; KPMG's Finance Act 2025 analysis notes new levies (e.g., 10% on retained earnings) could add TZS 300B, bolstering buffers for 6% growth while curbing deficits.
Total outlays reached TZS 2,343.6 billion (80% recurrent, 20% development), below target due to delayed external disbursements and procurement bottlenecks, but +7.2% YoY, aligning with 65% development bias in FY2025/26 budget (TZS 51.1 trillion total).
| Expenditure Category | Actual (TZS Billion) | Target (TZS Billion) | Performance (% of Target) | Notes |
| Total Expenditure | 2,343.6 | 3,068.9 | 76.4% | Below target; low dev. spend offsets recurrent stability. |
| Recurrent Expenditure | 1,886.0 | 2,100.4 | 89.7% | Salaries (60%), interest (15%), goods/services (25%). |
| Development Expenditure | 457.6 | 968.5 | 47.2% | Under-execution in foreign aid; local projects prioritized. |
Source: Ministry of Finance, BoT (provisional). Additional Details: Recurrent: Salaries TZS 1,132B (+5% YoY), interest TZS 283B (domestic 70%). Development: Infra 55% (roads/energy), social 30%.
Economic Implications: 76.4% execution preserves space for debt service (6.5% budget), keeping spreads low (6.28% lending-deposit) and supporting M3 growth (21.5%). Recurrent focus sustains consumption (3.5% private demand), but low dev. absorption delays 2% GDP from projects (e.g., rail/ports), per World Bank CPF 2025-29. IMF warns of election-year risks, but disciplined spending implies 3% deficit, freeing resources for green bonds (USD 1B potential), enhancing resilience.
| Component | Amount (TZS Billion) | Share (%) | Notes |
| Locally Financed Projects | 271.8 | 59.4 | Roads, energy; domestic borrowing funds. |
| Foreign-Financed Projects | 185.8 | 40.6 | Lower disbursements (e.g., IDA delays). |
Economic Implications: Local dominance (59.4%) reduces FX exposure (external debt 69.5%), stabilizing TZS and reserves (USD 6.2B). Funds infra multipliers (1.2% GDP from hydropower), but foreign shortfalls risk 0.8% growth shortfall; SECO recommends streamlined procurement to hit 7% absorption, unlocking AfCFTA gains (USD 1B trade).
Fiscal Deficit (October 2025)
| Item | Amount (TZS Billion) |
| Total Revenue & Grants | 2,328.5 |
| Total Expenditure | 2,343.6 |
| Overall Fiscal Deficit | –15.1 |
Interpretation: Small deficit due to expenditure restraint; fully domestically financed (83.6% dev. spend).
Economic Implications: Modest gap (vs. 3.5% annual) signals prudence, aligning with IMF's growth-friendly consolidation, curbing debt (49.6% GDP) and inflation pass-through. Enables 4.7-month import cover, but persistent under-spending may idle TZS 5T in unabsorbed funds, per Deloitte; policy tweaks (e.g., PPPs) could amplify 6.9% Q4 growth.
Strong 96% achievement from TRA modernization (digital tracking +20% compliance) and non-tax inflows, but LGA weakness (67.4%) persists.
Economic Implications: Buoyancy supports 13.1% tax/GDP, funding 21.5% social allocation, reducing poverty 1-2pp annually (World Bank). LGA gaps strain devolution, risking service delivery; reforms could add 0.5% growth via local multipliers.
Below-target due to dev. delays (47.2%), recurrent high from wages/interest.
Economic Implications: Discipline aids reserves buildup (+14% YoY), but low capex hampers productivity (manufacturing 5.2%); IMF urges 70% absorption for 7% growth, leveraging FY2025/26's TZS 33T dev. envelope.
Small TZS 15.1B deficit indicates discipline amid execution hurdles.
Economic Implications: Enhances credibility, lowering yields (10.8% bonds), crowding-in FDI (USD 1.5B Q3). Supports 6% growth, but election risks (Oct 2025) demand vigilance; SECO projects sustained momentum via infra.
| Category | Amount (TZS Bn) | Performance vs Target | Key Comment |
| Domestic Revenue | 2,328.5 | 96.1% | Strong, export-led. |
| Tax Revenue | 2,102.1 | 93.8% | VAT/excise drag. |
| Non-Tax Revenue | 226.4 | 124.8% | Dividend boost. |
| LGA Revenue | 64.5 | 67.4% | Capacity issues. |
| Total Expenditure | 2,343.6 | 76.4% | Dev. under-execution. |
| Recurrent | 1,886.0 | 89.7% | Wage-dominant. |
| Development | 457.6 | 47.2% | Aid delays. |
| Fiscal Deficit | –15.1 | — | Manageable, domestic-financed. |
Overall Outlook: October's operations underscore resilience, positioning Tanzania for 6%+ growth amid AfCFTA, but absorption and LGA reforms are key to unlocking USD 10B potential by 2030 (World Bank).
Zanzibar's economy in 2025 has demonstrated robust resilience and growth, contributing significantly to Tanzania's overall economic development. As a semi-autonomous region within the United Republic of Tanzania, Zanzibar accounts for approximately 3-4% of the national GDP but plays a pivotal role in foreign exchange earnings through tourism and agriculture. According to the Bank of Tanzania's (BoT) Monthly Economic Review for November 2025, Zanzibar's GDP grew by 6.4% in the first quarter of 2025 (matching the previous year), with projections for full-year growth reaching 7.3%, driven by tourism, construction, and agriculture. This outperforms the mainland's 5.4% Q1 growth and aligns with Tanzania's national target of over 6% GDP expansion. Key enablers include stable inflation, fiscal discipline, and a surging external sector, bolstered by global tourism recovery and domestic reforms. However, challenges like cyclical commodity declines (e.g., cloves) and import pressures highlight the need for diversification. Below, we expand on the provided outline with detailed data from the BoT report, supplemented by contextual insights from recent analyses (e.g., IMF and World Bank projections for Tanzania-Zanzibar integration). Read More: Zanzibar Economy Strengthens
Zanzibar experienced significant easing of inflation in 2025, aligning with the Bank of Tanzania's 3-5% target and regional benchmarks under the East African Community (EAC) and Southern African Development Community (SADC). This stability supports household purchasing power, consumer spending, and broader economic confidence, contributing to Tanzania's anchored national inflation at 3.5% in October 2025. The decline reflects prudent monetary policy transmission from the mainland, adequate food supplies via inter-regional trade, and falling global energy prices, which reduced imported inflation.
Headline inflation moderated steadily through 2025, falling from 5.8% in October 2024 to 3.4% in October 2025—a cumulative easing of 41% year-over-year. Monthly inflation remained subdued at 0.1% in October 2025, unchanged from the prior year, indicating low near-term pressures.
| Indicator | Oct 2024 | Sep 2025 | Oct 2025 |
| Headline inflation (%) | 5.8 | 3.5 | 3.4 |
Main drivers of the decline:
The table below details year-on-year (YoY) and month-on-month changes, based on the July 2022=100 CPI basket. Food remains volatile but downward-trending, while energy-related categories (e.g., housing, transport) show sharp disinflation.
| Group | Weight (%) | Month-on-Month (Oct 2025) | YoY Oct 2024 (%) | YoY Oct 2025 (%) |
| Food & non-alcoholic beverages | 41.9 | 0.7 | 8.0 | 7.1 |
| Housing, electricity, gas & fuels | 25.8 | -1.0 | 7.3 | -3.3 |
| Transport | 9.1 | -0.3 | 1.2 | 2.4 |
| Recreation & culture | 1.1 | -0.5 | 3.8 | 5.7 |
| All items (Headline) | 100.0 | 0.1 | 5.8 | 3.4 |
| Selected Subgroups | ||||
| Food (core food excl. beverages) | 40.5 | 0.6 | 8.2 | 6.4 |
| Non-food | 59.5 | -0.4 | 4.1 | 1.0 |
Source: Office of the Chief Government Statistician (Zanzibar), BoT computations. Insights: Negative monthly shifts in housing (-1.0%) and recreation (-0.5%) underscore energy and seasonal demand relief. YoY food inflation's persistence (7.1%) ties to Zanzibar's import reliance (70% of staples from mainland), but overall trends support 2025's low-risk outlook per IMF's 2025 Article IV consultation.
Chart Description (Annual Inflation Rates): A line chart tracks headline (blue, declining to 3.4%), food (red, easing to 6.4%), and non-food (green, dropping to 1.0%) from Oct 2024 to Oct 2025, highlighting the post-July 2025 disinflation phase amid harvest peaks.
Zanzibar's fiscal operations in 2025 emphasize growth-oriented spending, with a Sh6.98 trillion annual budget (up 34.7% YoY) targeting infrastructure and social sectors. October 2025 data shows a deficit but strong domestic mobilization, reducing aid dependency and aligning with Tanzania's national fiscal consolidation (deficit at 3.5% of GDP). This supports Vision 2050 goals by channeling 65% of the budget to development, up from 24% five years ago.
Total resources reached 84.8% of target, driven by tax buoyancy from tourism levies and trade. Non-tax underperformance reflects seasonal delays in fees/dividends.
| Category | Actual (TZS Billion) | % of Target |
| Total Resources (Revenue + Grants) | 170.8 | 84.8% |
| – Domestic revenue | 165.0 | — |
| – Grants | 5.8 | — |
| Tax revenue | 151.8 | 88.5% |
| Non-tax revenue | 13.2 | 63.8% |
Key insight: Tax collection is strong and remains the backbone of Zanzibar’s revenue (89% share), fueled by VAT/excise (TZS 44.7B), income tax (TZS 44.7B), and import duties (TZS 25.9B). Non-tax lags due to delayed port/airport fees. Annual domestic revenue has surged 278% over five years to Sh2.9T, per President Mwinyi's October 2025 remarks, enabling self-financed operations.
Chart Description (Chart 3.2.1: Government Resources): Bar chart compares 2024-2025 actuals: Tax on imports (25.9B), VAT/excise (44.7B), income tax (44.7B), other taxes (31.4B), non-tax (13.9B), grants (28.3B)—showing tax dominance.
Expenditure prioritized development (52% share), financing key projects like education reforms (Sh864B allocation for 2025/26) and tourism infrastructure.
| Category | Amount (TZS Billion) |
| Total Expenditure | 262.1 |
| – Recurrent Spending | 125.1 |
| – Development Expenditure | 137.0 |
Interpretation:
Chart Description (Government Expenditure): Stacked bars for 2024-2025: Wages/salaries (64.3B), other recurrent (99.1B), development (92.6B)—highlighting development surge.
Zanzibar continues to record a strong current account surplus, bolstering Tanzania's national reserves (up 14.1% YoY to USD 15.7B). The surplus widened amid tourism boom, offsetting mainland deficits and funding imports/investments.
The surplus expanded 42.8%, driven by services (36.6% growth), with tourism contributing 80% of receipts.
| Indicator | Year Ending Oct 2024 (USD Million) | Year Ending Oct 2025 (USD Million) | Change (%) |
| Current Account Balance | 649.9 | 928.2 | +42.8 |
Why the surplus increased:
Exports surged, with tourism overtaking goods as the top earner (55% of services exports).
| Indicator | Oct 2024 (USD M) | Oct 2025 (USD M) | Change (%) |
| Exports of goods & services | 126.6 | 151.8 | +20.0 |
Annual: +30.4% to USD 1,564.3M.
Tourism generated USD 3.92B nationally (year ending May 2025), with Zanzibar capturing ~30% of GDP contribution.
| Indicator | 2024 | 2025 (YTD Oct) | Change (%) |
| Tourist Arrivals | ~705,000 | 902,265 | +27.9 |
Tourism remains the dominant foreign exchange earner: Europeans (60% arrivals) and domestic travel up 20%; receipts USD 1.27B (year ending Aug 2025, +30.6%).
| Indicator | Oct 2024 | Oct 2025 | % Change |
| Value of Clove Exports (USD Million) | 22.1 | 10.9 | -50.7 |
Reason: Cyclical production decline (low harvest cycle); annual exports down 45.4% to USD 32.3M total goods, but offset by non-traditionals like spices/souvenirs.
Imports increased moderately, reflecting investment needs but contained by surplus.
| Indicator | Oct 2024 (USD M) | Oct 2025 (USD M) | Change (%) |
| Imports | 63.1 | 48.4 | -23.3 |
Annual: +17.0% to USD 656.4M.
Drivers:
| Category | Indicator | 2025 Value (Oct YTD) |
| Inflation | Headline inflation | 3.4% |
| Food inflation | 6.4% | |
| Non-food inflation | 1.0% | |
| Revenue | Total resources | TZS 170.8B |
| Tax revenue | TZS 151.8B | |
| Non-tax revenue | TZS 13.2B | |
| Expenditure | Total expenditure | TZS 262.1B |
| Development expenditure | TZS 137B | |
| External Sector | Current account | USD 928.2M surplus |
| Exports of goods & services | USD 1,564.3M | |
| Tourist arrivals | 902,265 | |
| Clove exports | USD 10.9M |
Overall Outlook: Zanzibar's 2025 performance enhances Tanzania's inclusive growth, per World Bank's FY2025-2029 CPF, by boosting FX (24% of national exports) and employment (1 in 5 jobs tourism-linked). Risks include commodity volatility, but 7.3% GDP projection signals sustained momentum.
Authored by Dr. Bravious Felix Kahyoza PhD, FMVA, CP3P and Amran Bhuzohera
This discussion paper explores how macroeconomic dynamics—such as GDP growth, inflation, exchange rate volatility, and fiscal policies—affect private sector resilience and competitiveness in Tanzania. Using annual and quarterly time-series data (2000–2024), the study applies ARDL and VECM econometric models to uncover both short- and long-term relationships between macroeconomic shocks and private sector performance.
Tanzania’s private sector contributes approximately 35% of GDP and employs over 80% of the national workforce, making it central to achieving the targets of Vision 2025 and AfCFTA integration. Yet, despite strong recovery momentum after COVID-19, the sector continues to face currency depreciation, inflation pressures, and investment bottlenecks that affect growth sustainability.
Key Findings
Stable but Vulnerable Growth:
Private sector contribution to GDP rose from 26% in 2000 to 43% in 2024, averaging 35.5%. However, this growth remains fragile due to inflationary shocks and foreign exchange volatility.
Exchange Rate Sensitivity:
The Tanzanian shilling depreciated by 9.6% year-on-year, increasing import costs by 12% and constraining SME margins. Despite this, depreciation stimulated limited export competitiveness—reflecting an adaptive but pressured private sector.
Long-Run Cointegration Confirmed:
The ARDL model confirms strong long-run relationships between macroeconomic variables, with a significant equilibrium adjustment rate of 4.6% per year. GDP growth showed a mild negative elasticity (–0.274), while inflation exerted a positive long-run effect (+0.255), suggesting adaptive price behavior.
Macroeconomic Influence on Private Growth:
Variance decomposition revealed that 43.7% of private sector growth was driven by GDP dynamics, 30.4% by inflation, and 20.6% by exchange rate movements—illustrating that domestic demand and stability remain the most crucial levers of resilience.
AfCFTA and Structural Transition:
Regional integration through AfCFTA could raise private sector output by up to 28% in freight and manufacturing industries by 2030. However, persistent supply shocks and fiscal deficits (3.8% of GDP on average) threaten to dilute these benefits unless supported by targeted SME financing and inflation control.
Policy Insights
The study emphasizes that macroeconomic stability is the cornerstone of private sector resilience. Persistent depreciation, inflation spikes, and limited fiscal space constrain Tanzania’s ability to maintain private-sector-led growth.
To counter these vulnerabilities, the paper proposes:
Implications for Vision 2025 and Beyond
The analysis reinforces that macroeconomic governance directly determines Tanzania’s competitiveness under AfCFTA and Vision 2050. Achieving sustained 6% GDP growth and raising private contribution to 45% of GDP by 2030 will depend on coordinated fiscal-monetary reforms, stable exchange rates, and continuous SME support.
By merging econometric evidence with policy action, this research provides actionable insights for the Bank of Tanzania, Ministry of Finance and Planning, and private sector actors striving for inclusive, shock-resistant growth.
Read the Full Paper:
“Macroeconomic Forces and Private Sector Resilience: An Econometric Analysis of Trends, Challenges, and Policy Pathways in Tanzania (2000–2024)”
Published by TICGL | Economic Research Centre