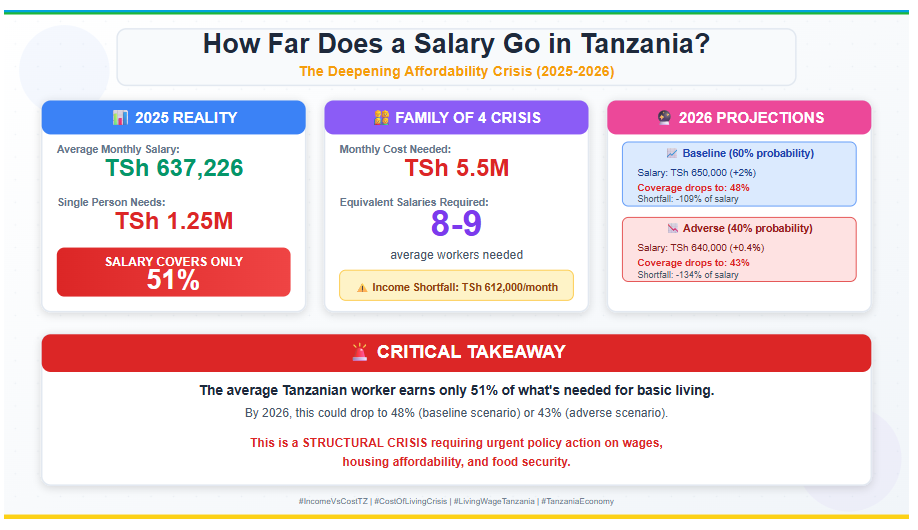
Tanzania is facing a deepening affordability challenge as the gap between household incomes and the cost of living continues to widen. In 2025, the average monthly salary stands at TSh 637,226, yet a single person requires approximately TSh 1.25 million per month to meet basic living expenses—equivalent to 196% of the average salary. This leaves an income shortfall of nearly TSh 612,000, meaning the typical worker earns only 51% of what is needed to live modestly. The situation is far more severe for families: a household of four needs about TSh 4.75 million per month for a moderate lifestyle and closer to TSh 5.5 million to remain financially stable—an amount equal to the combined earnings of 8–9 average workers. Looking ahead to 2026, projections suggest the crisis will intensify. Under the baseline scenario, salaries rise marginally to TSh 650,000 (+2%), while living costs for a single person increase to TSh 1.36 million, widening the deficit to -109% of salary. In an adverse scenario, workers may earn only 43% of their basic needs, with family living costs exceeding TSh 6.6 million per month. These figures highlight a structural imbalance where economic growth and wage adjustments are failing to keep pace with rising living costs—signaling an urgent need for policy action on wages, housing affordability, and food security. More On This Topic: Is the Cost of Living in Tanzania Outpacing Incomes as We Enter 2026?
| Category | Amount (TSh) | % of Salary |
| Average Monthly Salary | 637,226 | 100% |
| Monthly Living Cost | 1,249,000 | 196% |
| Income Shortfall | -611,774 | -96% |
Key Insight: A single person needs to earn nearly double the average salary just to cover basic expenses.
| Category | Amount (TSh) | Equivalent Salaries Needed |
| Single Average Salary | 637,226 | 1 person |
| Family Monthly Cost | 4,750,000 | 7.5 people |
| Required Household Income | 5,500,000 | 8.6 people |
Key Insight: A family needs the combined income of 8-9 average workers to live moderately—typically requiring 2 high-earning adults plus additional income sources.
| Metric | 2025 | 2026 Baseline | 2026 Adverse |
| Avg. Monthly Salary | 637,226 | 650,000 (+2%) | 640,000 (+0.4%) |
| Single Person Cost | 1,249,000 | 1,360,000 | 1,500,000 |
| Income Shortfall | -611,774 (-96%) | -710,000 (-109%) | -860,000 (-134%) |
| Salary Coverage | 51% of needs | 48% of needs | 43% of needs |
The average Tanzanian worker currently earns only 51% of what's needed for basic living. By 2026, this could drop to 48% (baseline) or 43% (adverse scenario).
This isn't just an income problem—it's a structural crisis requiring urgent policy action on wages, housing affordability, and food security.
Tanzania's deepening cost-of-living crisis reveals a profound structural disconnect between wages and essential expenses. In 2025, the average monthly salary of TSh 637,226 covers only 51% of a single person's basic needs (TSh 1.25 million) and forces families of four to rely on the equivalent of 8–9 average incomes to achieve modest financial stability (TSh 5.5 million). Projections for 2026 indicate further deterioration: under the baseline scenario, salary coverage falls to 48% for individuals, with family costs rising toward TSh 6 million; in the adverse scenario, workers may earn just 43% of their needs, pushing family expenses beyond TSh 6.6 million.
These trends signal that economic growth and wage adjustments are failing to keep pace with inflation in housing, food, and other essentials. Without urgent, targeted policy interventions—raising living wages, improving housing affordability, strengthening food security, and promoting inclusive growth—the affordability gap will widen further, eroding living standards and deepening inequality for millions of Tanzanians. Addressing this crisis is not only an economic imperative but a moral one, essential for building a more equitable and sustainable future.
The cost of living has become one of the most pressing economic realities shaping everyday life in Tanzania. While the country continues to post relatively strong macroeconomic indicators—such as GDP growth of 5.6% in 2025—these headline figures mask a growing disconnect between household incomes and the actual cost of meeting basic needs. For millions of Tanzanians, especially salaried workers, small entrepreneurs, and urban households, affordability is no longer just a concern—it is a structural challenge.
According to the 2025 Cost of Living Analysis, Tanzania remains 61.2% cheaper overall than the United States, with rent costs approximately 78.3% lower. However, this international comparison obscures a more critical domestic reality: local wages have not kept pace with the rising cost of housing, food, utilities, and essential services.
In 2025, the average monthly salary is estimated at 637,226 Tanzanian Shillings (TSh). Against this income, the estimated monthly cost of living for a single person—excluding rent—stands at 1,152,096 TSh, while a family of four requires approximately 4.1 million TSh per month to meet basic needs.
This means that even before accounting for rent, the average worker earns less than half of what is required to sustain a modest standard of living.
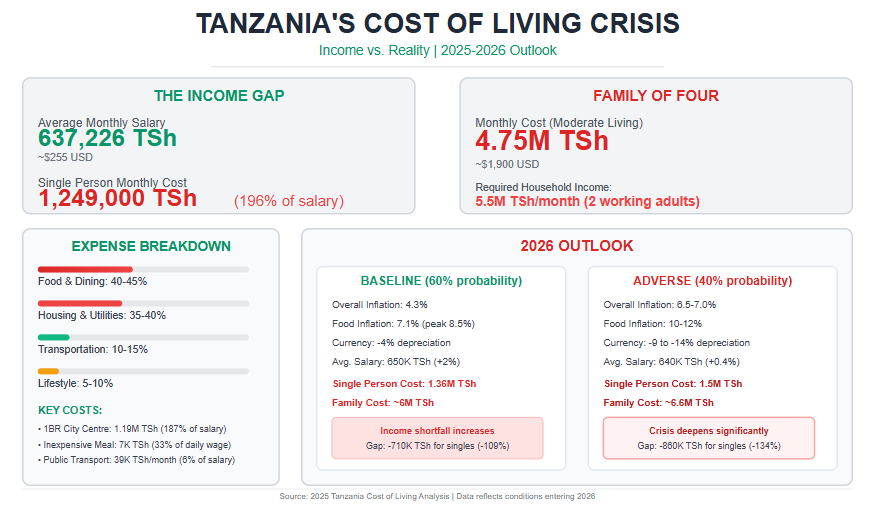
Food and dining account for the largest share of household expenditure, consuming 40–45% of monthly income. A simple inexpensive meal costs around 7,000 TSh, equivalent to 33% of an average daily wage, while a mid-range meal for two can exceed 50,000 TSh, or more than two full days of income for many workers.
Even staple grocery items—though relatively affordable individually—accumulate into a significant monthly burden, especially for families.
Housing costs present an even deeper structural challenge. Renting a one-bedroom apartment in a city centre costs approximately 1.19 million TSh per month, representing 187% of the average monthly salary. Even outside city centres, rent for a modest one-bedroom unit consumes over 70% of average income, while three-bedroom family housing exceeds total earnings entirely.
Utilities and internet add a further 300,000 TSh per month, reinforcing the affordability gap.
Transportation remains relatively affordable—public transport costs around 39,000 TSh per month, or about 6% of salary—but private vehicle ownership is increasingly out of reach, with the cost of a new compact car equivalent to nearly 70 months of income.
When all expenses are combined, a budget-conscious single person requires approximately 1.25 million TSh per month, nearly double the average salary. For a family of four, sustainable living requires a household income of 4.8–5.5 million TSh per month, typically achievable only with two high-earning adults or external income sources.
This growing income–cost gap explains rising household debt, reduced savings, informal coping strategies, and increasing vulnerability among urban populations. It also places pressure on businesses, as workers demand higher wages while firms face higher operating costs.
The outlook for 2026 presents both risk and uncertainty. Under the baseline scenario—where political and economic conditions stabilize—overall inflation is projected to rise to 4.3%, with food inflation averaging 7.1% and peaking as high as 8.5% mid-year. The Tanzanian Shilling is expected to depreciate by about 4%, pushing up the cost of imported goods, fuel, and agricultural inputs.
In this scenario, average monthly salaries are projected to rise marginally to around 650,000 TSh, while the monthly cost of living for a single person climbs to 1.36 million TSh—deepening the affordability gap rather than closing it. Families would require close to 6 million TSh per month to maintain a moderate standard of living.
Under an adverse scenario, characterized by prolonged political or economic disruptions, inflation could rise to 6.5–7.0%, food prices could increase by 10–12%, and the currency could depreciate by up to 14%. This would push the monthly cost of living for a single person to 1.5 million TSh, while families could face costs exceeding 5.7 million TSh, further increasing poverty and inequality.
The data sends a clear message: Tanzania’s cost-of-living challenge is no longer about prices alone—it is about income adequacy, economic structure, and policy choices. Without deliberate action on wages, housing supply, food systems, and productivity, economic growth risks becoming disconnected from lived reality. As the country looks toward 2026 and beyond, addressing the cost of living is not just an economic necessity—it is a social and political imperative.
Tanzania offers a significantly lower cost of living compared to the United States, making it an affordable destination for both residents and expatriates. The data shows Tanzania is 61.2% cheaper overall than the US, with rent being 78.3% lower. More on This Topic: Will Tanzania's Robust Central Bank Position Ensure Continued Growth Through 2026?
| Household Type | Monthly Cost (Excluding Rent) | USD Equivalent* |
| Family of Four | 4,110,219 TSh | ~$1,644 |
| Single Person | 1,152,096 TSh | ~$461 |
*Based on approximate exchange rate of 2,500 TSh = 1 USD
| Item | Average Cost | Price Range | % of Daily Wage** |
| Inexpensive Meal | 7,000 TSh | 3,000-15,000 | 33% |
| Mid-Range Meal (2 people) | 50,000 TSh | 30,000-120,000 | 235% |
| Fast Food Combo | 20,000 TSh | 15,000-25,000 | 94% |
| Cappuccino | 5,149 TSh | 2,000-7,500 | 24% |
| Local Beer (0.5L) | 2,500 TSh | 2,000-5,000 | 12% |
**Based on average daily wage of ~21,241 TSh (637,226/30 days)
| Category | Item | Cost | Budget Impact |
| Staples | White Rice (1kg) | 2,711 TSh | Low |
| Fresh Bread (500g) | 1,986 TSh | Low | |
| Eggs (12) | 5,291 TSh | Low | |
| Protein | Chicken (1kg) | 12,346 TSh | Medium |
| Beef (1kg) | 10,500 TSh | Medium | |
| Local Cheese (1kg) | 22,125 TSh | High | |
| Produce | Bananas (1kg) | 2,527 TSh | Low |
| Tomatoes (1kg) | 2,406 TSh | Low | |
| Apples (1kg) | 6,167 TSh | Medium |
Weekly grocery budget for single person: ~60,000-80,000 TSh (26-35% of monthly food costs)
| Type | Location | Monthly Rent | Annual Cost | % of Avg Salary |
| 1-Bedroom | City Centre | 1,194,740 TSh | 14,336,880 | 187% |
| 1-Bedroom | Outside Centre | 452,967 TSh | 5,435,604 | 71% |
| 3-Bedroom | City Centre | 2,060,000 TSh | 24,720,000 | 323% |
| 3-Bedroom | Outside Centre | 822,208 TSh | 9,866,496 | 129% |
Key Insight: Living outside the city centre saves approximately 62% on rent for 1-bedroom apartments and 60% for 3-bedroom apartments.
| Service | Average Cost | Range | % of Rent (1BR Outside) |
| Electricity, Water, Gas, Garbage | 181,593 TSh | 120,000-300,000 | 40% |
| Internet (60+ Mbps) | 99,923 TSh | 50,000-150,000 | 22% |
| Mobile Phone (10GB+) | 28,294 TSh | 10,000-50,000 | 6% |
| Total Utilities | 309,810 TSh | - | 68% |
| Transport Type | Cost | Monthly Impact |
| Public Transport | One-way ticket: 650 TSh | |
| Monthly pass: 39,000 TSh | 6% of salary | |
| Private Transport | Gasoline (1L): 2,979 TSh | |
| New Compact Car: 44,297,674 TSh | 69.5 months salary | |
| Taxi Services | Start fare: 4,000 TSh | |
| Per km: 4,000 TSh |
Budget Recommendation: Public transport is highly affordable at 39,000 TSh/month. For car owners, factor in ~50,000-80,000 TSh monthly for fuel (based on average commuting).
| Category | Item | Cost | Affordability |
| Fitness | Gym Membership | 145,556 TSh | 23% of salary |
| Entertainment | Cinema Ticket | 12,000 TSh | 2% of salary |
| Tennis Court (1hr) | 16,250 TSh | 3% of salary | |
| Clothing | Jeans (Levi's) | 39,375 TSh | 6% of salary |
| Running Shoes | 83,571 TSh | 13% of salary |
| Service | Annual Cost | Monthly Equivalent | % of Annual Salary |
| Preschool/Kindergarten | 18,617,766 TSh | 1,551,480 TSh | 243% |
| International Primary School | 31,434,444 TSh | 2,619,537 TSh | 411% |
Critical Note: International schooling is extremely expensive relative to local salaries, typically requiring expatriate-level income or significant family savings.
| Expense Category | Monthly Cost | % of Total |
| Rent (1BR outside centre) | 450,000 TSh | 36% |
| Utilities | 310,000 TSh | 25% |
| Food (groceries + occasional dining) | 280,000 TSh | 22% |
| Transportation (public) | 39,000 TSh | 3% |
| Mobile/Internet | 50,000 TSh | 4% |
| Entertainment/Misc | 120,000 TSh | 10% |
| TOTAL | 1,249,000 TSh | 100% |
Budget vs Average Salary: 196% (requires income above average)
| Expense Category | Monthly Cost | % of Total |
| Rent (3BR outside centre) | 850,000 TSh | 18% |
| Utilities | 350,000 TSh | 7% |
| Food (groceries + dining) | 1,200,000 TSh | 25% |
| Transportation (car + fuel) | 200,000 TSh | 4% |
| Education (2 children, local school) | 500,000 TSh | 11% |
| Healthcare/Insurance | 300,000 TSh | 6% |
| Entertainment/Misc | 350,000 TSh | 7% |
| Savings | 1,000,000 TSh | 21% |
| TOTAL | 4,750,000 TSh | 100% |
Household Income Needed: ~4,800,000-5,500,000 TSh/month (2 working adults)
Assumption: Unrest subsides by Q1 2026, limited international sanctions
| Economic Indicator | 2025 Actual | 2026 Baseline Projection | Change |
| GDP Growth | 5.6% | 5.8% | +0.2% |
| Overall Inflation | 3.4% | 4.3% | +0.9% |
| Food Inflation | 6.6% | 7.1% (avg), 8.5% (peak July) | +0.5-1.9% |
| Currency (TSh/USD) | 2,692 | 2,799 | -4.0% depreciation |
| Tourism Revenue Growth | +15% | -12% (Q1) then recovery | Net: -5% |
| Foreign Aid | $3B+ annually | Reduced by $150M | -5% |
Assumption: Unrest continues into mid-2026, broader sanctions imposed
| Economic Indicator | 2026 Adverse Projection | Change from Baseline |
| GDP Growth | 4.0% | -1.8% |
| Overall Inflation | 6.5-7.0% | +2.2-2.7% |
| Food Inflation | 10-12% | +2.9-4.9% |
| Currency (TSh/USD) | 2,950-3,100 | -9-14% depreciation |
| FDI Inflows | 50% reduction | -$1.5B |
| Poverty Rate | 26% (from 25%) | +1% |
| Category | 2025 | 2026 Baseline | 2026 Adverse |
| Average Monthly Salary | 637,226 TSh | 650,000 TSh (+2%) | 640,000 TSh (+0.4%) |
| Single Person Monthly Costs | 1,249,000 TSh | 1,360,000 TSh | 1,500,000 TSh |
| Income Shortfall (Single) | -611,774 TSh (-96%) | -710,000 TSh (-109%) | -860,000 TSh (-134%) |
| Family of Four Costs | 4,750,000 TSh | 5,175,000 TSh | 5,700,000 TSh |
| Required Household Income | ~5,500,000 TSh | ~6,000,000 TSh | ~6,600,000 TSh |
Critical Finding: The average salary falls significantly below estimated costs, with shortfalls ranging from 546,679 TSh for single persons to over 3.6 million TSh for families with one earner.
Tanzania's food and non-alcoholic beverages inflation rose to 7.7% in August 2025, up from 7.6% in July, reflecting a year-on-year price increase in this category, which holds the largest CPI weight of 28.2%. The food index climbed from 121.12 in August 2024 to 130.48 in August 2025, though it remained nearly flat month-to-month (130.47 to 130.48), buoyed by price drops in staples like maize (-1.9%) and vegetables (-1.8%). This stability masks underlying pressures from agricultural supply challenges, impacting 25-30% of GDP and threatening household affordability, especially for the 57% of households citing food costs as a major concern in 2024.
This means that on average, the prices of food and non-alcoholic beverages increased by 7.7% over the year.
Even though annual food inflation was high, the monthly food index was almost flat (0.0%), because prices of some items went down, offsetting increases in others.
Items that recorded price decreases include:
These declines helped stabilize the monthly food inflation despite strong annual growth.
Key Insights
Summary:
Food and non-alcoholic beverages in Tanzania saw 7.7% annual inflation in August 2025, driven mainly by higher year-on-year food costs. However, month-to-month food prices were stable, with declines in staple grains, vegetables, and pulses balancing out other pressures.
| Period | Food CPI Index (2020=100) | Annual Food Inflation Rate (%) | Monthly Change (%) |
| August 2024 | 121.12 | - | - |
| July 2025 | 130.47 | 7.6* | - |
| August 2025 | 130.48 | 7.7 | 0.0 |
*Note: July 2025 food inflation rate (7.6%) is mentioned in the text as comparison to August 2025 rate.
| Index Type | Weight (%) | Index Value (2020=100) | Annual Inflation Rate (%) |
| Core Index | 73.9 | 115.98 | 2.0 |
| Non-Core Index | 26.1 | 130.51 | 7.3 |
| Energy, Fuel and Utilities | 5.7 | 130.72 | 2.6 |
| Services Index | 37.2 | 112.69 | 0.8 |
| Goods Index | 62.8 | 123.96 | 4.9 |
| Education Services | 4.1 | 114.32 | 2.8 |
| All Items Less Food | 71.82 | 115.56 | 1.6 |
Key Highlights:
In August 2025, Tanzania's food and non-alcoholic beverages inflation reached 7.7%, more than double the headline rate of 3.4%, driven by a year-on-year index rise from 121.12 to 130.48 despite monthly stability (0.0% change from July's 130.47). This category's dominant 28.2% CPI weight amplifies its role in eroding household purchasing power, particularly amid projections of 4.0% overall inflation and 6.0% GDP growth, highlighting vulnerabilities in agriculture and potential poverty exacerbation for low-income groups.
Impact on Households and Poverty
Food inflation disproportionately affects low-income and rural households in Tanzania, where food expenditures can exceed 50% of budgets, compared to the national CPI weight of 28.2%. The 7.7% annual rise in August 2025, up from 7.6% in July and 7.3% in June, intensifies cost-of-living pressures, potentially pushing more households into poverty. In 2024, 57% of households reported food price hikes as a major shock, contributing to intersecting crises like hunger and economic instability. Globally, a 1% food price increase can raise poverty by 0.0001% in low- to middle-income groups, a trend applicable to Tanzania where urban poverty is exacerbated by reduced welfare and access to nutritious food. However, long-term spikes may benefit net food producers, though short-term volatility from weather and supply issues hinders this for subsistence farmers.
Macroeconomic Effects
As the primary inflation driver, food prices at 7.7% in August 2025 elevate the non-core index to 7.3%, contrasting with core inflation's stability at 2.0% (excluding volatiles like unprocessed food). This contributes to headline inflation's slight rise to 3.4%, within the Bank of Tanzania's (BOT) 3-5% target, but risks broader price instability if unchecked. Agriculture, comprising 25-30% of GDP, faces disruptions from weather-induced supply shortages, amplifying import dependencies and exchange rate pressures (USD/TZS around 2,470). Despite this, Tanzania's 6.0% GDP growth projection for 2025 remains robust, supported by mining and services, though persistent food hikes could dampen consumption and widen inequality.
| Implication | Key Figure (August 2025) | Broader Effect |
| Cost of Living | Food Inflation: 7.7% | Reduces real incomes, especially for urban poor; offsets non-food stability (1.6%). |
| GDP Contribution | Agriculture: 25-30% | Volatility threatens 6.0% growth forecast; potential for welfare gains long-term. |
| Poverty Risk | Households Affected: ~57% (2024 data) | Exacerbates hunger-poverty nexus in SSA. |
Agricultural Sector Challenges
Monthly price declines in staples like maize (-1.9%), vegetables (-1.8%), and tubers (e.g., sweet potatoes -3.3%) provided short-term relief in August 2025, but year-on-year pressures stem from supply disruptions, including weather events and global commodity trends (FAO index up 7.6% annually). These factors, combined with rising input costs, challenge Tanzania's food security recovery post-pandemic, where agriculture employs over 65% of the workforce. Easing global prices offer some buffer, but domestic volatility could hinder export competitiveness and stock buffers (e.g., 557k tonnes noted earlier in 2025).
Policy Responses and Outlook
BOT's cautious accommodative policy for 2025/26, maintaining low rates to anchor inflation while supporting growth, addresses food-driven pressures through liquidity management and reserves (USD 6 billion). Recommendations include agricultural subsidies and infrastructure to mitigate supply shocks. IMF projections of 4.0% inflation suggest moderation, but sustained food hikes risk derailing 6.0% growth, necessitating targeted interventions for inclusive development.
The National Consumer Price Index (NCPI) for August 2025 reveals a stable yet nuanced inflationary landscape in Tanzania, with the annual headline inflation rate rising marginally to 3.4% from 3.3% in July 2025. This slight uptick, driven predominantly by a 7.7% increase in food and non-alcoholic beverage prices, underscores the significant influence of the agricultural sector, which holds a 28.2% weight in the CPI basket. Despite a minor monthly decline in the overall index from 119.85 to 119.77, reflecting seasonal price drops in staples like maize and vegetables, core inflation remained steady at 2.0%, indicating underlying price stability. These figures highlight Tanzania's balanced economic management amid a projected 6% GDP growth, though persistent food price pressures pose challenges for household affordability and rural livelihoods.
The CPI slightly declined from 119.85 in July 2025 to 119.77 in August 2025 (-0.1%), due to lower prices of several items:
Summary:
Tanzania’s inflation in August 2025 remained stable and moderate at 3.4%, mainly driven by food prices (7.7% increase). Core inflation (2.0%) shows underlying stability, but seasonal drops in key food and fuel items slightly reduced the monthly index.
| Period | CPI Index (2020=100) | Annual Inflation Rate (%) | Monthly Change (%) |
| August 2024 | 115.78 | 3.1 | - |
| September 2024 | 115.88 | 3.1 | - |
| October 2024 | 115.54 | 3.0 | - |
| November 2024 | 116.05 | 3.0 | - |
| December 2024 | 116.87 | 3.1 | - |
| January 2025 | 117.57 | 3.1 | - |
| February 2025 | 118.28 | 3.2 | - |
| March 2025 | 119.27 | 3.3 | - |
| April 2025 | 119.78 | 3.2 | - |
| May 2025 | 119.85 | 3.2 | - |
| June 2025 | 120.18 | 3.3 | - |
| July 2025 | 119.85 | 3.3 | -0.3 |
| August 2025 | 119.77 | 3.4 | -0.1 |
| Index Type | Weight (%) | Index Value (2020=100) | Annual Inflation Rate (%) |
| Core Index | 73.9 | 115.98 | 2.0 |
| Non-Core Index | 26.1 | 130.51 | 7.3 |
| Energy, Fuel and Utilities | 5.7 | 130.72 | 2.6 |
| Services Index | 37.2 | 112.69 | 0.8 |
| Goods Index | 62.8 | 123.96 | 4.9 |
| Education Services | 4.1 | 114.32 | 2.8 |
| All Items Less Food | 71.82 | 115.56 | 1.6 |
Key Highlights:
Tanzania's headline inflation rate of 3.4% in August 2025 reflects a stable macroeconomic environment, remaining within the Bank of Tanzania's (BOT) target range of 3-5%. This moderate level, up slightly from 3.3% in July, indicates controlled price pressures overall, supported by prudent monetary policies and improved supply conditions in non-food sectors. However, the data highlights persistent challenges, particularly from food price increases, which could strain household budgets and exacerbate inequality. Drawing from the attached National Bureau of Statistics (NBS) document and recent economic analyses, this inflation profile supports robust GDP growth projections while underscoring the need for targeted interventions in agriculture and food security. Below, I break down the key economic implications.
| Sector | Annual Inflation Rate (Aug 2025) | Economic Implication |
| Transport | 1.4% | Low costs support logistics and trade, enhancing export growth (Tanzania's exports up in mining and tourism). |
| Housing, Water, Electricity, Gas & Fuels | 2.1% | Stable utility prices aid household budgeting and industrial productivity. |
| Education Services | 3.0% | Moderate rise aligns with investments in human capital, crucial for long-term growth. |
| Services Index (Overall) | 0.8% | Low pressure fosters service sector expansion, which employs a growing urban workforce. |
BOT's strategy emphasizes inflation targeting while supporting 6%+ growth, with tools like reserve requirements and open market operations to manage liquidity. Fiscal measures, including subsidies for agriculture and infrastructure investments, could mitigate food risks. The IMF's 2025 Article IV consultation notes improving conditions under prudent management, with growth expected to average 6% long-term. East Africa's regional outlook projects easing inflation (from 20.8% in 2024 to 19.1% in 2025), but Tanzania's lower rate positions it favorably.
In summary, August 2025's inflation data underscores Tanzania's resilient economy, with low overall rates fostering investment and growth amid a projected 6% GDP expansion. However, elevated food inflation poses risks to inclusive development, necessitating enhanced agricultural productivity and social safety nets for sustained stability.