
Fiscal decentralization in Tanzania, pursued through the policy of Decentralization by Devolution (D by D), aims to empower Local Government Authorities (LGAs) with greater financial autonomy to fund and manage local development effectively. A key measure of success is the extent to which LGAs can rely on own-source revenue—locally generated through property rates, fees, licenses, and service levies—rather than central government transfers. The core question is whether this policy has meaningfully improved the financial sustainability of LGAs, enabling them to independently finance the bulk of grassroots projects such as roads, schools, health centers, water supply, and sanitation.
Evidence from LGA revenue data spanning 2010 to 2025 indicates that fiscal decentralization has not significantly enhanced financial sustainability. While own-source revenue has grown substantially in absolute terms—from TZS 13.9 billion in 2010 to TZS 147.8 billion in 2025 (a more than tenfold increase)—this has failed to reduce heavy dependence on central transfers. The own-source share of total LGA revenue averaged only 2.8% over the period (excluding the anomalous 0.5% in 2016), ranging from a low of 1.9% in 2012 to a high of 4.1% in 2025. In recent years, despite own-source collections reaching TZS 121.9 billion in 2024 and TZS 147.8 billion in 2025, the share remained modest at 3–4%. This means central government transfers continued to account for 96–98% of total LGA revenue, which expanded from TZS 609.7 billion in 2010 to TZS 3,570.4 billion in 2025.
This persistently low own-source contribution highlights limited progress toward true fiscal autonomy. LGAs, despite implementing most development projects critical to national goals like the Five-Year Development Plans and Sustainable Development Goals, lack the financial independence needed for proactive, timely, and locally prioritized planning. Delays in project execution and resource inefficiencies often result from this dependency.
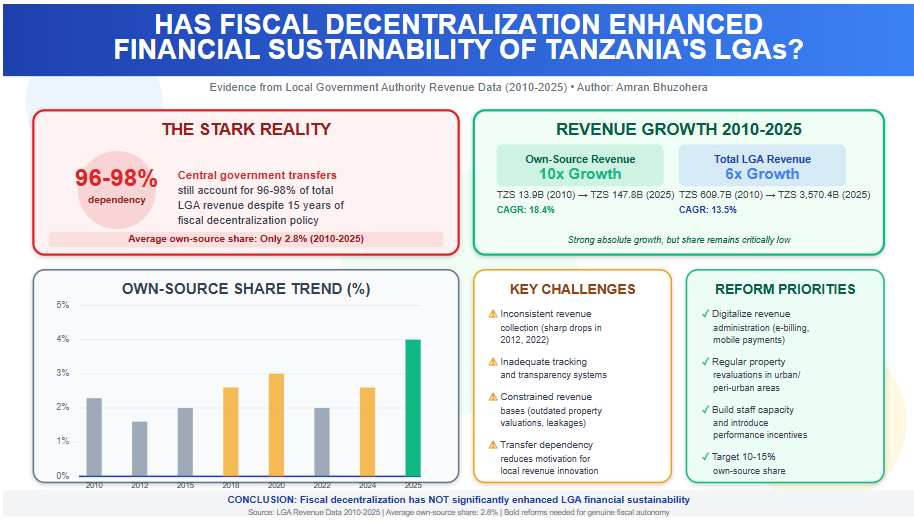
Recent trends offer cautious optimism, with own-source growth accelerating in 2023–2025 and the share reaching 4.1% in 2025—the highest in the period. However, this remains far below levels needed for genuine sustainability.
To achieve meaningful enhancement through fiscal decentralization, targeted reforms are required. Priorities include digitalizing revenue administration (e.g., electronic billing and mobile payments), conducting regular property revaluations, building staff capacity, and introducing incentives for high-performing LGAs, such as greater autonomy or matching grants. Linking revenue strategies to local economic drivers—like agriculture, tourism, and small industries—could further boost collections organically. A medium-term target of 10–15% own-source share would better align resources with community needs, foster decentralized development, and build resilience against fiscal shocks.
In summary, while absolute own-source revenue has risen impressively, the low and stagnant share over 2010–2025 demonstrates that fiscal decentralization has yet to deliver substantial financial sustainability for Tanzania’s LGAs. Sustained, bold reforms are essential to realize the full potential of devolution.
Note: The 2016 data point shows Own Sources as 0.0B (likely a recording error or missing data, as noted in the document's limitations). It is treated as anomalous in trend calculations. The "Non-Tax Revenue" column does not factor into the LGA Share % and appears unrelated to the core self-reliance metric (possibly national non-tax figures or a separate category). Read More: Local Government Revenue Collections in Tanzania
| Year | Own Sources (B TZS) | Total Revenue (B TZS) | LGA Share (%) |
| 2010 | 13.9 | 609.7 | 2.3 |
| 2011 | 20.0 | 722.0 | 2.8 |
| 2012 | 17.2 | 909.4 | 1.9 |
| 2013 | 27.2 | 1,041.8 | 2.6 |
| 2014 | 23.3 | 1,112.9 | 2.1 |
| 2015 | 41.0 | 1,478.9 | 2.8 |
| 2016 | 0.0 | 1,394.8 | 0.5 |
| 2017 | 44.6 | 1,781.9 | 2.5 |
| 2018 | 58.9 | 1,817.5 | 3.2 |
| 2019 | 61.7 | 2,180.4 | 2.8 |
| 2020 | 86.1 | 2,354.8 | 3.7 |
| 2021 | 82.8 | 2,545.8 | 3.3 |
| 2022 | 69.1 | 3,085.7 | 2.2 |
| 2023 | 100.8 | 3,110.9 | 3.2 |
| 2024 | 121.9 | 3,877.4 | 3.1 |
| 2025 | 147.8 | 3,570.4 | 4.1 |
The revenue data from 2010 to 2025 clearly illustrates that Tanzania's Local Government Authorities (LGAs) remain heavily dependent on central government transfers, which consistently account for 95–98% of total revenue. Even at the highest point in the period—4.1% own-source share in 2025 (TZS 147.8 billion out of TZS 3,570.4 billion total)—locally generated funds cover only a marginal fraction of budgetary needs. This structural dependency severely constrains fiscal autonomy at the local level, where the majority of development projects are executed, including critical infrastructure such as roads, schools, health centers, and water supply systems.
Despite the overall low share, several encouraging trends emerge:
These gains suggest that, with continued effort, higher levels of self-reliance are achievable.
The data also exposes significant obstacles that hinder progress:
To build on recent progress and reduce reliance on central transfers, LGAs must pursue targeted, sustained reforms that address both administrative and structural constraints:
In conclusion, while absolute own-source revenue has shown impressive growth and recent trends are promising, true economic self-reliance demands accelerating the own-source share well beyond the current low single digits. Without comprehensive reforms to address volatility, administrative gaps, and narrow revenue bases, LGAs will continue to face limited fiscal space. The upward trajectory since 2020 demonstrates potential, but only deliberate policy action will close the gap and enable LGAs to finance local development more independently and effectively.
Tanzania has received significant Official Development Assistance (ODA) over the years, with disbursements peaking at $761M in 2013 before gradually declining to $389M in 2024 and a projected $118M in 2025. ODA accounted for 8.55% of GNI, with major donors including the World Bank ($1.095B) and the United States ($429.5M). As Tanzania's GNI reached $79B (2024) and tax revenue stood at 11% of GDP, the decline in aid signals a transition towards economic self-reliance.
An overview of official development assistance (ODA) disbursements to Tanzania in U.S. dollars, showing the financial support received from international donors over the years:
1. Disbursements Overview
2. Key ODA Donors to Tanzania
These organizations and countries provided the highest amounts in recent years:
3. Economic and Social Indicators
4. Trends in ODA Disbursements to Tanzania (2001-2025)
5. Insights
Table: Tanzania’s ODA Trends and Economic Indicators (2001-2025)
| Category | Figures | Year(s) |
| Peak ODA Disbursement | $761M | 2013 |
| Recent ODA Disbursement | $389M | 2024 |
| Projected ODA Disbursement | $118M | 2025 |
| ODA as % of GNI | 8.55% | 2024 |
| ODA Per Capita | $41.13 | 2024 |
| Top Donor – World Bank | $1.095B | Recent Years |
| Top Donor – United States | $429.5M | Recent Years |
| Top Donor – Global Fund | $225M | Recent Years |
| Population | 70.5M (38.9% urban, 61.1% rural) | 2024 |
| Gross National Income (GNI) | $79B | 2024 |
| GNI Per Capita | $1,200 | 2024 |
| Government Tax Revenue (% GDP) | 11% | 2024 |
1. Tanzania's Economic Dependency on ODA
2. Trends in Foreign Aid
3. Shift in Tanzania’s Financial Landscape
4. Implications for Tanzania
Tanzania is transitioning away from heavy aid dependence, which is a sign of economic progress. However, the country must strengthen its domestic revenue base, improve fiscal policies, and attract private investment to sustain growth without relying on ODA.
Table: Tanzania’s ODA Disbursements (2001-2025)
| Country Name | Income Group Name | Transaction Type | Fiscal Year | Amount (USD) |
| Tanzania | Low-Income Country | Disbursements | 2001 | 56,271,677.00 |
| Tanzania | Low-Income Country | Disbursements | 2002 | 44,921,288.00 |
| Tanzania | Low-Income Country | Disbursements | 2003 | 77,758,665.00 |
| Tanzania | Low-Income Country | Disbursements | 2004 | 75,349,538.00 |
| Tanzania | Low-Income Country | Disbursements | 2005 | 98,453,065.00 |
| Tanzania | Low-Income Country | Disbursements | 2006 | 121,328,607.00 |
| Tanzania | Low-Income Country | Disbursements | 2007 | 170,535,939.00 |
| Tanzania | Low-Income Country | Disbursements | 2008 | 201,805,905.00 |
| Tanzania | Low-Income Country | Disbursements | 2009 | 304,986,154.00 |
| Tanzania | Low-Income Country | Disbursements | 2010 | 417,027,558.00 |
| Tanzania | Low-Income Country | Disbursements | 2011 | 528,712,694.00 |
| Tanzania | Low-Income Country | Disbursements | 2012 | 541,809,375.00 |
| Tanzania | Low-Income Country | Disbursements | 2013 | 761,034,304.00 |
| Tanzania | Low-Income Country | Disbursements | 2014 | 599,437,705.00 |
| Tanzania | Low-Income Country | Disbursements | 2015 | 460,667,149.00 |
| Tanzania | Low-Income Country | Disbursements | 2016 | 529,056,776.00 |
| Tanzania | Low-Income Country | Disbursements | 2017 | 575,891,919.00 |
| Tanzania | Low-Income Country | Disbursements | 2018 | 654,077,929.00 |
| Tanzania | Low-Income Country | Disbursements | 2019 | 647,335,947.00 |
| Tanzania | Low-Income Country | Disbursements | 2020 | 588,223,684.00 |
| Tanzania | Low-Income Country | Disbursements | 2021 | 482,382,313.00 |
| Tanzania | Low-Income Country | Disbursements | 2022 | 509,285,215.00 |
| Tanzania | Low-Income Country | Disbursements | 2023 | 647,676,578.00 |
| Tanzania | Low-Income Country | Disbursements | 2024 | 389,156,342.00 |
| Tanzania | Low-Income Country | Disbursements | 2025 | 118,411,425.00 |