
Regional Performance, Investment Implications & Economic Projections
Tanzania demonstrated superior inflation management in 2025, achieving an annual average of 3.3% and outperforming regional peers Kenya (4.1%) and Uganda (3.6%). Despite food inflation surging from 2.1% to 6.4%, the country maintained exceptional stability through declining core inflation (3.4% to 2.2%) and non-food inflation (3.5% to 2.0%).
| Month | Tanzania (%) | Kenya (%) | Uganda (%) | Best Performer |
|---|---|---|---|---|
| Jan 2025 | 3.1 | 3.3 | 3.6 | Tanzania |
| Feb 2025 | 3.2 | 3.5 | 3.7 | Tanzania |
| Mar 2025 | 3.3 | 3.6 | 3.4 | Uganda |
| Apr 2025 | 3.2 | 4.1 | 3.5 | Tanzania |
| May 2025 | 3.2 | 3.8 | 3.8 | Tanzania |
| Jun 2025 | 3.3 | 3.8 | 3.9 | Tanzania |
| Jul 2025 | 3.3 | 4.1 | 3.8 | Tanzania |
| Aug 2025 | 3.4 | 4.5 | 3.8 | Tanzania |
| Sep 2025 | 3.4 | 4.6 | 4.0 | Tanzania |
| Oct 2025 | 3.5 | 4.6 | 3.4 | Uganda |
| Nov 2025 | 3.4 | 4.5 | 3.1 | Uganda |
| Dec 2025 | 3.6 | 4.5 | 3.1 | Uganda |
| Annual Average | 3.3 | 4.1 | 3.6 | Tanzania |
| Category | Weight (%) | 12-Month Change (%) | Status |
|---|---|---|---|
| Food & Non-alcoholic Beverages | 28.2 | 6.7 | ⚠️ High Pressure |
| Alcoholic Beverages & Tobacco | 1.9 | 3.4 | Moderate |
| Clothing & Footwear | 10.8 | 2.0 | ✅ Well-controlled |
| Housing, Water, Utilities | 15.1 | 2.3 | ✅ Stable |
| Furnishings & Household | 7.9 | 3.0 | Moderate |
| Health | 2.5 | 1.3 | ✅ Excellent |
| Transport | 14.1 | 4.1 | Elevated |
| Information & Communication | 5.4 | 0.5 | ✅ Minimal |
| Recreation & Culture | 1.6 | 0.3 | ✅ Minimal |
| Education Services | 2.0 | 2.9 | Moderate |
| Restaurants & Accommodation | 6.6 | 0.9 | ✅ Low |
| Core Inflation | 73.9 | 2.5 | ✅ Strong Control |
| Non-Core Inflation | 26.1 | 6.7 | ⚠️ Volatile |
| TOTAL - ALL ITEMS | 100.0 | 3.6 | Target Range |
| Category | 2024 Average (%) | 2025 Average (%) | Change (pp) | Trend |
|---|---|---|---|---|
| Headline Inflation | 3.1 | 3.3 | +0.2 | ↗️ Slight increase |
| Food Inflation | 2.1 | 6.4 | +4.3 | ⚠️ Sharp increase |
| Non-Food Inflation | 3.5 | 2.0 | -1.5 | ✅ Strong decline |
| Core Inflation | 3.4 | 2.2 | -1.2 | ✅ Significant improvement |
| Non-Core Inflation | 2.2 | 6.2 | +4.0 | ⚠️ Major increase |
| Factor | Tanzania | Kenya | Uganda | Tanzania Advantage |
|---|---|---|---|---|
| 2025 Average Inflation | 3.3% | 4.1% | 3.6% | ✅ Lowest |
| Stability (Std Dev) | ~0.15 | ~0.53 | ~0.29 | ✅ Most stable |
| Core Inflation | 2.2% | N/A | N/A | ✅ Well-controlled |
| Months as Best Performer | 8/12 | 0/12 | 4/12 | ✅ Clear leader |
| Purchasing Power | Best | Worst | Middle | ✅ Investment appeal |
| Country | Baseline Forecast (%) | Range (%) | Key Sources |
|---|---|---|---|
| Tanzania | 3.8 | 3.0 - 4.2 | BoT, Trading Economics, TICGL |
| Kenya | 4.8 | 4.0 - 5.2 | IMF (5.2%), World Bank (5.0%) |
| Uganda | 3.7 | 3.3 - 4.2 | Trading Economics, Deloitte/EIU |
| Quarter | Projected Inflation (%) | Expected Trend |
|---|---|---|
| Q1 2026 | 2.7 | Below 2025 average |
| Q2 2026 | 3.1 | Gradual increase |
| Q3 2026 | 2.7 | Stabilization |
| Q4 2026 | 2.9 | Year-end stability |
| 2026 Average | ~2.9 | Below 2025 |
| Indicator | Current Status | 2026 Target | Policy Stance |
|---|---|---|---|
| Policy Rate | 5.75% | Maintained | Accommodative |
| Inflation Target | 3-5% | 3-5% | On target |
| GDP Growth | 5.5-6.0% | 5.5-6.0% | Supportive |
| Foreign Reserves | Improving | Stable | Positive |
Inflation Range: 3.0 - 3.5% | GDP Impact: 6.0%+ growth
Key Drivers: Good rainfall patterns, stable food supply, global commodity price moderation, continued strong monetary policy management.
Inflation Range: 3.5 - 4.2% | GDP Impact: 5.5-6.0% growth
Key Drivers: Normal weather conditions, Bank of Tanzania targets met, regional stability maintained, accommodative monetary policy continues.
Inflation Range: 4.5 - 6.0% | GDP Impact: 4.5-5.0% growth
Key Drivers: Drought conditions, political tensions related to potential elections, global economic shocks, currency depreciation pressures.
| Risk Factor | Impact on Inflation | Probability | Potential Addition (pp) |
|---|---|---|---|
| Drought/Agricultural Shock | Food prices surge | Medium | +1.0 to +1.5 |
| Political Instability (Elections) | Supply disruptions | Low-Medium | +0.5 to +1.0 |
| Global Oil Price Spike | Transport, energy costs | Medium | +0.5 to +0.8 |
| Currency Depreciation | Import prices | Low | +0.3 to +0.5 |
| Regional Food Shortages | Cross-border food prices | Medium | +0.5 to +1.0 |
| Climate Events (El Niño) | Agricultural production | Medium-High | +1.0 to +2.0 |
| Category | Indicators to Monitor | Impact Channel | Priority |
|---|---|---|---|
| Agriculture | Rainfall patterns, crop yields, livestock health | Direct food prices (28.2% of CPI) | Critical |
| Energy | Global oil prices, diesel/petrol local pricing | Transport (14.1%), utilities (5.7%) | High |
| Currency | TZS/USD exchange rate, foreign reserves | Import prices, goods inflation | High |
| Regional | EAC inflation trends, cross-border trade | Food supply, competitive pressures | Medium-High |
| Policy | BoT rate decisions, fiscal policy | Interest rates, demand-side | Medium |
| Political | Election preparations, stability | Supply chains, investor confidence | Medium |
Data Sources: National Bureau of Statistics Tanzania (NBS), Bank of Tanzania (BoT), Trading Economics, International Monetary Fund (IMF), World Bank, Tanzania Investment and Consultant Group Limited (TICGL), Deloitte/Economist Intelligence Unit (EIU)
Next Update: January 2026 NCPI Release - February 9, 2026
Comprehensive Assessment of TZS 128.4 Trillion Debt Position
Tanzania's national debt stock reached approximately TZS 128.4 trillion by the end of November 2025, reflecting a strategic development financing approach heavily anchored on external resources. This comprehensive analysis reveals a debt structure characterized by external dominance at 69.7% of the total, with domestic debt providing a crucial 30.3% stabilizing buffer against foreign exchange volatility.
The debt composition demonstrates the government's continued role as the primary borrower, with the public sector accounting for TZS 103.5 trillion (80.5%) of total obligations, while private sector debt stood at TZS 24.9 trillion (19.5%). This distribution underscores the central government's strategic focus on financing critical infrastructure, social services, and transformative investments essential for Tanzania's development trajectory.
Critically, the monthly debt growth rate of 0.4% signals controlled and sustainable accumulation, a positive indicator for fiscal stability and macroeconomic management. Despite the external-heavy debt structure, sustainability risks remain well-managed through robust foreign exchange reserves covering approximately 4.9 months of imports, an expanding domestic debt market, and prudent fiscal policies maintained by the Bank of Tanzania and Ministry of Finance.
Tanzania's debt position remains manageable and sustainable under current fiscal frameworks, with moderate growth rates, adequate reserve buffers, and development-oriented borrowing strategies supporting long-term economic growth objectives.
| Debt Category | Amount (TZS Trillion) | USD Equivalent | Percentage Share |
|---|---|---|---|
| External Debt | 90.0 | USD 36.1 billion | 69.7% |
| Domestic Debt | 38.4 | USD 15.4 billion | 30.3% |
| Total National Debt | 128.4 | USD 51.5 billion | 100.0% |
Tanzania's debt architecture reveals significant reliance on external financing sources, with nearly 70% of total obligations denominated in foreign currencies. This structure reflects the country's development financing strategy, where concessional loans and development partner financing play pivotal roles in funding large-scale infrastructure projects, including transportation networks, energy facilities, and social infrastructure.
The domestic debt component, while smaller, serves as a critical stabilizing mechanism. It reduces overall foreign exchange exposure, provides diversification in funding sources, and supports the development of local capital markets. The 30.3% domestic share offers important insulation against currency depreciation risks that could otherwise amplify debt servicing costs.
| Indicator | Value | Implication |
|---|---|---|
| Monthly Debt Growth | 0.4% | Controlled, sustainable pace |
| Dominant Component | External (69.7%) | Development-focused financing |
| FX Reserve Cover | 4.9 months | Strong external buffer |
| Exchange Rate | ~2,490 TZS/USD | Stable currency environment |
| Sector | Amount (TZS Trillion) | Percentage Share | Primary Purpose |
|---|---|---|---|
| Public Sector | 103.5 | 80.5% | Infrastructure, social services, strategic investments |
| Private Sector | 24.9 | 19.5% | Business expansion, trade finance, investments |
| Total National Debt | 128.4 | 100.0% | Combined development financing |
The public sector's commanding 80.5% share of national debt reflects Tanzania's development model, where government-led investment drives economic transformation. This concentration is consistent with comparable emerging economies pursuing infrastructure-intensive growth strategies, where public sector borrowing finances critical projects with high social returns but long payback periods.
Private sector debt at 19.5% represents borrowing by businesses, financial institutions, and individuals for commercial purposes. While significantly smaller than public debt, private sector external borrowing supports trade finance, business expansion, and private investment in productive sectors, complementing public sector development efforts.
| Sustainability Indicator | Current Status | Assessment | Risk Level |
|---|---|---|---|
| Debt Composition | External-heavy (69.7%) | FX exposure present | Medium |
| Domestic Debt Buffer | 30.3% of total | Reduces currency risk | Low |
| Monthly Growth Rate | 0.4% | Moderate, controlled | Low |
| FX Reserve Coverage | 4.9 months imports | Strong buffer | Low |
| Debt Purpose | Development-oriented | Growth-enhancing | Low |
Growing Domestic Market: Expanding local debt market provides alternative financing and reduces FX dependency
Adequate Reserves: 4.9 months of import cover significantly exceeds the 3-month adequacy threshold
Productive Investment: Debt financing infrastructure and services with long-term growth potential
Moderate Pace: 0.4% monthly growth indicates disciplined borrowing and debt management
Exchange Rate Volatility: TZS depreciation increases local currency debt service burden on external obligations
Global Interest Rates: Rising international rates affect borrowing costs and refinancing terms
Revenue Performance: Debt sustainability depends on continued strong domestic revenue mobilization
Economic Growth: Maintaining robust GDP growth essential for manageable debt-to-GDP ratios
Tanzania's debt sustainability outlook remains positive under current macroeconomic conditions and fiscal policies. The combination of moderate debt accumulation, productive use of borrowed funds, adequate reserve buffers, and growing domestic financing capacity creates a resilient debt management framework. However, continued vigilance on exchange rate movements, global financial conditions, and revenue performance is essential.
Tanzania's debt management approach balances development financing needs with fiscal sustainability objectives. The government, through the Ministry of Finance and Bank of Tanzania, employs several strategic mechanisms to maintain debt sustainability while funding critical national priorities.
The growth of Tanzania's domestic debt market from 30.3% of total debt represents a strategic achievement with multiple benefits. A deeper local capital market reduces vulnerability to external shocks, provides more flexible financing options, and supports broader financial sector development. The increasing participation of pension funds, insurance companies, and retail investors signals growing confidence in government securities.
Future debt strategy aims to gradually increase the domestic share to 40-45% over the medium term, further reducing foreign exchange exposure while supporting local financial market deepening. This transition requires continued macroeconomic stability, competitive domestic interest rates, and sustained investor confidence.
Understanding Tanzania's debt position requires context of the broader economy. With GDP estimated at approximately TZS 200-210 trillion in 2025, the debt-to-GDP ratio stands around 61-64%, a level considered manageable for a developing economy pursuing infrastructure-intensive growth.
| Economic Metric | Value | Implication for Debt |
|---|---|---|
| Nominal GDP (est.) | ~TZS 205 trillion | Growing denominator improves ratios |
| Debt-to-GDP Ratio | ~62-63% | Within sustainable range |
| GDP Growth Rate | 6.0-6.5% | Outpacing debt growth |
| Revenue-to-GDP | ~15-16% | Supports debt service capacity |
Tanzania's GDP growth consistently exceeding 6% provides crucial debt sustainability support. When economic growth outpaces debt accumulation, debt-to-GDP ratios naturally stabilize or decline over time, even with continued borrowing for development purposes. This dynamic creates fiscal space for strategic investments while maintaining macroeconomic stability.
The 4.9 months of import cover provided by foreign exchange reserves represents a critical strength in Tanzania's debt sustainability framework. This substantial buffer significantly exceeds the 3-month international adequacy standard, providing protection against external shocks and confidence to international creditors.
| Reserve Metric | Value | Assessment |
|---|---|---|
| Import Cover | 4.9 months | Well above 3-month adequacy threshold |
| Reserve Trend | Stable to growing | Strengthening external position |
| External Debt Ratio | 69.7% of total | Reserves provide servicing buffer |
| Currency Stability | Relatively stable TZS | Supports debt servicing capacity |
Strong reserve levels perform multiple functions: they enable smooth debt servicing on external obligations, provide confidence to foreign investors and creditors, support currency stability, and offer protection against unexpected external shocks such as commodity price swings or global financial turbulence.
Looking ahead, Tanzania's debt management success will depend on maintaining the prudent approach evident in current data while adapting to evolving economic circumstances and opportunities. Several strategic priorities emerge from this analysis:
Controlled Growth: 0.4% monthly pace demonstrates disciplined borrowing
Strong Reserves: 4.9 months import cover provides substantial buffer
Productive Use: Infrastructure focus supports long-term growth
Growing Domestic Market: Reducing FX dependency over time
Robust GDP Growth: 6%+ growth outpacing debt accumulation
The combination of prudent debt management, strong economic growth, adequate reserves, and strategic investment focus positions Tanzania well for sustainable development financing. Continued attention to these fundamentals, alongside adaptive responses to global economic conditions, will be essential for maintaining this positive trajectory.
Tanzania's national debt stock of TZS 128.4 trillion as of end-November 2025 reflects a deliberate development financing strategy that balances growth imperatives with fiscal sustainability. The external-dominated structure (69.7%) enables access to large-scale, concessional financing for transformative infrastructure, while the growing domestic component (30.3%) provides critical currency risk mitigation.
Several factors support a positive sustainability assessment. The moderate 0.4% monthly growth rate indicates disciplined borrowing aligned with absorptive capacity. Foreign exchange reserves covering 4.9 months of imports provide a robust external buffer well above international adequacy standards. The productive, development-oriented use of borrowed funds supports future revenue generation and economic growth that outpaces debt accumulation.
The public sector's 80.5% share of total debt reflects government-led development strategy common in infrastructure-intensive growth phases. This concentration, while creating fiscal obligations, finances critical assets with long-term economic and social returns—transportation networks, energy systems, social infrastructure, and economic facilities that enhance productivity and competitiveness.
Risks exist and require ongoing attention. The external-heavy structure creates vulnerability to exchange rate fluctuations, with TZS depreciation increasing local currency debt service costs. Global interest rate trends affect borrowing conditions and refinancing costs. Revenue performance must keep pace with debt service obligations to maintain fiscal balance.
However, these risks are actively managed through strategic debt policies, reserve accumulation, domestic market development, and prudent fiscal management. The expanding domestic debt market, improving revenue mobilization, strong economic growth, and careful project selection all contribute to sustainable debt dynamics.
Looking forward, maintaining this positive trajectory requires continued policy discipline, strategic borrowing focused on high-return investments, ongoing domestic market development, and adaptive responses to global economic conditions. With these elements in place, Tanzania's debt position supports rather than constrains development ambitions, providing financing for transformative investments while preserving macroeconomic stability.
Tourism-Led Expansion Drives 7.1% GDP Growth and Regional Leadership
Zanzibar's economy demonstrated exceptional resilience and growth throughout 2025, significantly outperforming the national average and establishing itself as a crucial growth engine within the Tanzanian Union. The archipelago achieved a remarkable 7.1% real GDP growth in 2024, with projections indicating continued robust expansion into 2025.
The economic success story is anchored by a thriving tourism sector that generated 736,755 visitor arrivals in the twelve months ending November 2025, representing a substantial 16.2% year-on-year increase. This tourism boom created powerful multiplier effects across hospitality, transport, trade, and construction sectors, while generating critical foreign exchange earnings that strengthened Zanzibar's external position.
Macroeconomic stability improved alongside growth, with headline inflation moderating to 4.6% in November 2025 from 4.8% in October. Enhanced fiscal revenue collection, primarily from tourism-related levies and taxes on goods and services, provided the fiscal space for increased infrastructure and social service investments while maintaining a manageable deficit position.
| Indicator | Performance |
|---|---|
| Real GDP Growth (2024) | 7.1% |
| Growth Outlook (2025) | Strong, tourism-led expansion |
| Main Growth Drivers | Tourism, trade, construction, transport |
| Comparative Performance | Above national average (6.0-6.5%) |
Zanzibar's 7.1% growth significantly exceeded mainland Tanzania's performance, demonstrating the archipelago's unique competitive advantages in high-value tourism and services. The economic expansion translated into tangible improvements in employment opportunities and gradual poverty reduction, particularly in tourism-dependent regions.
| Inflation Measure | October 2025 | November 2025 | Change |
|---|---|---|---|
| Headline Inflation | 4.8% | 4.6% | ▼ -0.2pp |
| Food Inflation | 7.2% | 6.8% | ▼ -0.4pp |
| Non-Food Inflation | 3.3% | 3.1% | ▼ -0.2pp |
Inflation trends showed encouraging moderation in November 2025, with headline inflation declining to 4.6%. The improvement reflects relatively stable non-food inflation at 3.1%, benefiting from global commodity price stability and Tanzanian shilling strength. However, food inflation remained elevated at 6.8%, driven by supply constraints, seasonal factors, and Zanzibar's significant import dependence for food staples.
The persistence of food price pressures represents the primary inflation challenge, particularly given food's substantial weight in household consumption baskets. Addressing this requires continued focus on enhancing agricultural productivity, improving supply chain efficiency, and managing import costs.
| Tourism Indicator | Performance |
|---|---|
| Tourist Arrivals (12 months to Nov 2025) | 736,755 |
| Year-on-Year Growth | +16.2% |
| Average Hotel Occupancy | Above 65% |
| Main Source Markets | Europe, Asia, Africa |
| Economic Impact | Employment, FX earnings, multiplier effects |
Tourism solidified its position as Zanzibar's dominant economic driver, with 736,755 arrivals representing robust 16.2% year-on-year growth. The sustained hotel occupancy above 65% demonstrates strong and consistent demand across accommodation categories, from luxury resorts to boutique properties.
The tourism sector's impact extends far beyond direct visitor spending. It generates substantial employment across hospitality, transport, retail, and cultural services; produces critical foreign exchange earnings that strengthen external balances; and creates powerful linkages with agriculture, handicrafts, and construction sectors. European markets remained the primary source of arrivals, complemented by growing Asian and African visitor segments.
| External Indicator | Status |
|---|---|
| Export Performance | Improved (cloves, tourism services) |
| Import Demand | Rising (food, fuel, construction materials) |
| Trade Balance | Deficit, but narrowing |
| Foreign Exchange Inflows | Strong from tourism |
| Overall External Position | Strengthening |
Zanzibar's external sector showed resilience despite persistent merchandise trade deficits. Rising import demand for food, fuel, and construction materials reflected both economic growth and supply constraints, but robust tourism receipts effectively offset these pressures.
Foreign exchange earnings from tourism proved crucial in narrowing the trade deficit and strengthening overall external balances. This performance directly contributed to Tanzania's improved national current account position and services surplus, demonstrating Zanzibar's strategic importance to the Union's external stability.
| Fiscal Indicator | Performance |
|---|---|
| Revenue Collection | Improved |
| Main Revenue Sources | Taxes on goods & services, tourism-related levies |
| Expenditure Focus | Social services & infrastructure |
| Fiscal Balance | Manageable deficit |
| Debt Sustainability | Within prudent limits |
Fiscal performance strengthened considerably, with improved domestic revenue mobilization providing essential fiscal space for development priorities. The Revolutionary Government of Zanzibar successfully enhanced tax collection efficiency, particularly on goods and services and tourism-related activities, without creating excessive economic burdens.
The additional revenues financed higher public spending on critical infrastructure projects and social services, including education, health, and public facilities. The fiscal deficit remained manageable and sustainable, indicating responsible fiscal management that balances development needs with macroeconomic stability.
| Social Indicator | Trend |
|---|---|
| Overall Employment | Improving |
| Main Job-Creating Sectors | Tourism, trade, construction |
| Youth Employment | Gradual improvement |
| Poverty Pressure | Moderating |
| Skills Development | Enhanced focus on hospitality training |
Employment trends showed positive momentum, particularly in tourism, trade, and construction sectors. The tourism boom created diverse employment opportunities ranging from hospitality services to transport, retail, and cultural activities, with significant benefits for youth employment.
The combination of economic growth and improved employment outcomes contributed to moderating poverty pressures. However, ensuring inclusive growth that reaches all segments of society and geographic areas remains an ongoing priority for policymakers.
While Zanzibar's economic performance was strong, several challenges require strategic attention. Food inflation and import dependence highlight the need for enhanced agricultural productivity and food security initiatives. The heavy concentration in tourism, while currently beneficial, creates vulnerability to global economic downturns, health crises, or geopolitical disruptions.
Zanzibar's economic trajectory for 2025 and beyond appears highly positive, supported by sustained tourism demand, improving infrastructure, and macroeconomic stability. The archipelago's positioning as a premium tourism destination, combined with its strategic location in the Indian Ocean, provides substantial growth opportunities.
Success in capitalizing on these opportunities will require sustained policy focus on infrastructure development, human capital enhancement, economic diversification, and environmental sustainability. Maintaining macroeconomic stability while pursuing ambitious development goals remains essential.
Zanzibar's economic performance in 2025 demonstrates the archipelago's emergence as a vital growth pole within the Tanzanian Union and broader East African region. The 7.1% GDP growth, driven by exceptional tourism performance, positions Zanzibar significantly ahead of regional peers and validates the strategic focus on high-value services sectors.
The combination of robust growth, moderating inflation, improving fiscal and external positions, and expanding employment creates a strong foundation for sustainable development. Tourism's role as the economic backbone, generating foreign exchange equivalent to more than half of Tanzania's services receipts, underscores Zanzibar's strategic economic importance.
Looking forward, maintaining this positive trajectory requires balancing tourism expansion with economic diversification, addressing food security challenges, investing in infrastructure and human capital, and ensuring growth benefits reach all segments of society. With continued sound policy management and strategic investment, Zanzibar is well-positioned to sustain its role as an economic leader and model for tourism-led development in East Africa.
The Tanzania Shilling (TZS) continues to rank among the weaker currencies in Africa when measured by its nominal exchange rate against the US dollar, raising an important economic question about why it trails far behind Africa's strongest currencies such as the Tunisian Dinar (TND) and Libyan Dinar (LYD). This comprehensive analysis examines the structural, policy-related, and global factors shaping Tanzania's foreign exchange dynamics, providing insights for policymakers, investors, businesses, and the public.
1 TZS ≈ 0.0004 USD
As of December 2025, 1 USD exchanges for approximately 2,473 TZS, meaning 1 TZS is worth about 0.0004 USD. In stark contrast, 1 Tunisian Dinar equals 0.34 USD and 1 Libyan Dinar equals 0.18 USD. This wide gap highlights not just currency performance differences, but also deeper structural and policy-related factors shaping Tanzania's foreign exchange dynamics.
At the core of the shilling's weakness is Tanzania's import-dependent growth model. In 2025, the economy grew by about 6%, driven largely by infrastructure expansion, energy projects, mining, and urban development. While this growth is positive, it has significantly increased demand for foreign currency to pay for fuel, machinery, capital goods, and construction materials.
Another key factor is the current account deficit, projected at around 3.2% of GDP in 2025, reflecting a persistent imbalance between export earnings and import payments. Although Tanzania performed strongly in gold exports—earning approximately USD 4.59 billion by October 2025—and saw recovery in tourism, these inflows were still insufficient to fully offset the growing import bill.
According to the latest data from December 2025, the currency landscape in Africa shows significant disparities. The Tunisian Dinar (TND) leads as the strongest currency in Africa, with 1 TND ≈ 0.34 USD (or approximately 1 USD ≈ 2.94 TND). This strength is attributed to Tunisia's monetary discipline, controlled inflation, and restrictions on capital outflows.
| Rank | Currency | Code | Country/Region | Value (1 unit = USD) |
|---|---|---|---|---|
| 1 | Tunisian Dinar | TND | Tunisia | 0.34 |
| 2 | Libyan Dinar | LYD | Libya | 0.18 |
| 3 | Moroccan Dirham | MAD | Morocco | 0.11 |
| 4 | Ghanaian Cedi | GHS | Ghana | 0.087 |
| 5 | Botswana Pula | BWP | Botswana | 0.074 |
| 6 | Seychelles Rupee | SCR | Seychelles | 0.070 |
| 7 | Eritrean Nakfa | ERN | Eritrea | 0.066 |
| 8 | Namibian Dollar / Swazi Lilangeni | NAD / SZL | Namibia / Eswatini | 0.060 |
| 9 | Lesotho Loti | LSL | Lesotho | 0.058 |
| 10 | South African Rand | ZAR | South Africa | 0.058 |
The Tanzania Shilling (TZS) is among the weaker currencies in Africa nominally. As of late December 2025, 1 USD ≈ 2,473 TZS (or 1 TZS ≈ 0.000404 USD). This places it far below the top ranks, even weaker than lower entries like the Kenyan Shilling at approximately 0.0077 USD per unit.
| Country | Currency | Code | 1 unit = USD | 1 USD = local units | Position in Africa |
|---|---|---|---|---|---|
| Tunisia | Tunisian Dinar | TND | 0.34 | ~2.94 | Strongest |
| Libya | Libyan Dinar | LYD | 0.18 | ~5.41 | 2nd |
| Morocco | Moroccan Dirham | MAD | 0.11 | ~9.09 | 3rd |
| South Africa | South African Rand | ZAR | 0.058 | ~17.24 | ~10th |
| Kenya | Kenyan Shilling | KES | 0.0077 | ~129.87 | Lower mid |
| Tanzania | Tanzania Shilling | TZS | 0.000404 | ~2,473 | Weak |
| Rwanda | Rwandan Franc | RWF | 0.00069 | ~1,449 | Weak |
In East Africa (EAC members): TZS is relatively stable but nominally weaker than the Kenyan Shilling (KES). Uganda (UGX) and Burundi (BIF) are even weaker, with typical values of 1 UGX ≈ 0.00027 USD. Ethiopia's Birr is also considered weak in nominal terms.
The Tanzania Shilling (TZS) experienced notable volatility throughout 2025, weakening significantly in the first half of the year before stabilizing and even slightly appreciating toward the end. The shilling peaked at around 1 USD ≈ 2,700 TZS in mid-2025, making it briefly the world's worst-performing currency, before recovering to approximately 2,473 TZS by late December 2025. This represents an overall annual depreciation of about 3.5% compared to the start of the year.
Several interconnected factors drove the day-to-day and monthly pressures on the TZS:
The outlook is generally positive for relative stability or modest depreciation, supported by Tanzania's strong fundamentals:
Overall, while the TZS is likely to face some ongoing nominal weakening due to Tanzania's import-dependent growth model, 2026 should see greater stability than the volatile first half of 2025, with long-term benefits from investments potentially strengthening the currency in real terms over time.
Global factors have also played a significant role in the shilling's performance. The continued strength of the US dollar, driven by high interest rates and global risk aversion, placed pressure on emerging and frontier market currencies throughout 2025. Tanzania was not immune to these global dynamics.
Countries with stronger currencies, such as Tunisia and Libya, rely heavily on controlled foreign exchange systems, oil revenues, or strict limits on currency convertibility, which support nominal currency strength but do not necessarily reflect broader economic resilience or long-term sustainability.
Importantly, the shilling's weaker position does not necessarily imply economic failure. Unlike some of Africa's strongest currencies, Tanzania operates a more flexible and market-responsive exchange rate system, which absorbs shocks rather than masking them.
Key indicators of macroeconomic stability in 2025 include:
Therefore, the gap between the Tanzania Shilling and Africa's strongest currencies is best explained by structural trade dynamics, policy choices, and openness to global markets, rather than short-term mismanagement.
Understanding why the Tanzania Shilling lags behind Africa's strongest currencies is essential not only for policymakers, but also for investors, businesses, and the public. It underscores the trade-offs between currency strength, economic openness, and long-term growth, and frames the broader debate on whether nominal currency strength should be the ultimate benchmark for economic success in Tanzania's development trajectory.
In conclusion, the Tanzania Shilling's position behind Africa's strongest currencies is largely the result of structural economic realities rather than economic weakness. Tanzania's import-driven growth model, expanding infrastructure investments, and rising demand for foreign exchange naturally exert downward pressure on the shilling, while countries with stronger nominal currencies often rely on strict currency controls, limited convertibility, or resource-based inflows that artificially support exchange rates.
Despite episodes of volatility in 2025, the shilling demonstrated resilience through effective Bank of Tanzania interventions, low and stable inflation of around 3-3.5%, improving foreign exchange reserves covering 4-5 months of imports, and strong export performance in gold and tourism.
Therefore, while the TZS remains weak in nominal terms, it reflects a more open, flexible, and growth-oriented economy. The real policy challenge for Tanzania is not merely strengthening the currency's face value, but deepening export diversification, reducing import dependence, and sustaining macroeconomic stability, which over time will enhance the shilling's real strength and long-term economic credibility.
Get complete access to comprehensive data, detailed analysis, and expert insights including:
One-time payment for lifetime access
Enter the 6-digit access code sent to you by our admin team:
Your payment is being verified by our admin team.
Reference Number:
You will receive a 6-digit access code via SMS within 24 hours.
Once you receive the code, click the button below to unlock the article.
Over the past decade, Tanzania’s external debt has expanded rapidly, reflecting both the country’s ambitious development agenda and growing reliance on external financing to bridge fiscal and infrastructure gaps. According to the International Debt Report 2025, Tanzania’s total external debt stock increased more than fourfold—from US$8.9 billion in 2010 to US$36.3 billion by end-2024. This sharp rise underscores the scale of public investment undertaken during this period, particularly in transport infrastructure, energy, and social sectors, but it also raises important questions regarding debt sustainability and regional competitiveness.
In East Africa, Tanzania currently ranks among the top three most indebted countries in absolute terms, alongside Kenya and Ethiopia. By end-2024, Kenya recorded the highest external debt stock at US$42.9 billion, followed by Ethiopia (US$36.5 billion) and Tanzania (US$36.3 billion). While Tanzania’s debt level is lower than Kenya’s, it is significantly higher than that of Uganda (US$20.5 billion), Rwanda (US$13.1 billion), and the Democratic Republic of Congo (US$12.5 billion). This positioning places Tanzania as a major regional borrower, reflecting the relative size of its economy and its sustained access to concessional and semi-concessional financing.
From a debt burden perspective, Tanzania’s external debt stood at 47% of Gross National Income (GNI) in 2024—moderate by regional standards. This ratio is similar to Burundi (47%) but substantially lower than Rwanda’s 94%, indicating comparatively lower vulnerability than some peers. However, when measured against export earnings, Tanzania’s external debt reached 222% of exports, signaling a high exposure to external shocks, especially fluctuations in commodity prices and global demand. This ratio is higher than Uganda’s (184%) and Kenya’s (206%), though still below Ethiopia’s elevated level of 311%.
Debt servicing pressures in Tanzania remain relatively manageable compared to other East African economies. In 2024, debt service payments accounted for 3% of GNI and 12% of export earnings, significantly lower than Kenya, where debt service absorbed 27% of exports, and comparable to Rwanda’s levels. This reflects Tanzania’s continued reliance on multilateral creditors, which account for approximately 64% of public and publicly guaranteed (PPG) external debt, with the World Bank alone representing nearly half of total PPG debt. Such creditor composition has helped moderate repayment pressures through longer maturities and concessional terms.
Nevertheless, Tanzania recorded the highest net external debt inflows in East Africa in 2024, at US$3.1 billion, exceeding Ethiopia (US$2.8 billion) and Rwanda (US$1.9 billion). This trend highlights ongoing financing needs and signals that debt accumulation is likely to persist in the medium term. As regional peers increasingly face tightening global financial conditions, Tanzania’s future debt trajectory will depend heavily on export performance, fiscal discipline, and the productivity of debt-financed investments.
Overall, Tanzania’s external debt position reflects a delicate balance: stronger than highly indebted peers such as Rwanda and Kenya in terms of servicing capacity, yet more exposed than Uganda and DRC when viewed through export and inflow dynamics. This evolving landscape makes continuous debt monitoring, regional benchmarking, and strategic borrowing essential for safeguarding macroeconomic stability and sustaining long-term growth. Read More of This Topic: Who Is Financing Tanzania’s Public Debt in 2024—and What Does It Mean for Sustainability?
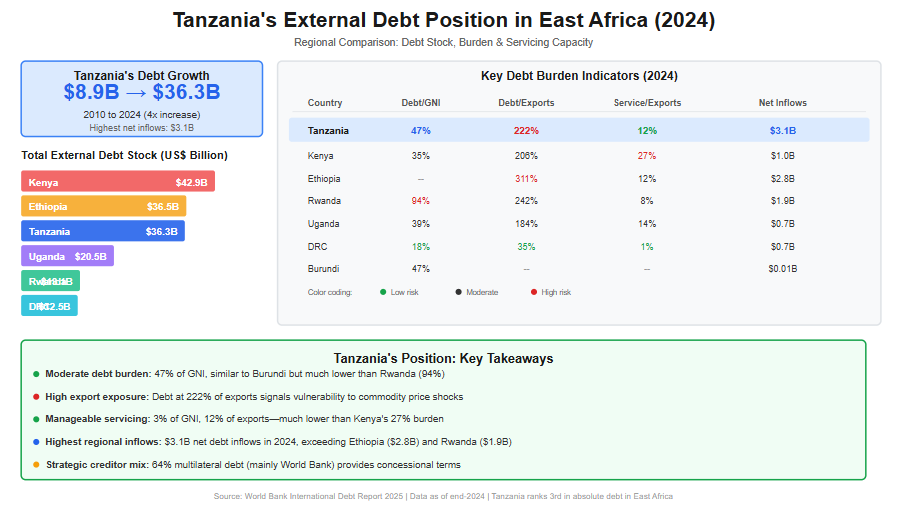
The following table summarizes Tanzania's external debt data across key years, as extracted from the International Debt Report 2025. All figures are in US$ million unless otherwise noted.
| Indicator | 2010 | 2020 | 2021 | 2022 | 2023 | 2024 |
| Total external debt stocks | 8,940 | 25,772 | 28,818 | 30,444 | 34,585 | 36,343 |
| Long-term external debt stocks | 6,904 | 22,055 | 23,589 | 24,533 | 28,271 | 30,898 |
| Public and publicly guaranteed debt from: | ||||||
| Official creditors | 5,546 | 15,355 | 15,502 | 16,308 | 18,296 | 20,005 |
| Multilateral | 4,391 | 11,243 | 11,526 | 12,615 | 14,655 | 16,435 |
| of which: World Bank | 3,248 | 8,148 | 8,290 | 9,228 | 10,989 | 12,097 |
| Bilateral | 1,155 | 4,112 | 3,975 | 3,693 | 3,641 | 3,571 |
| Private creditors | 135 | 2,209 | 3,436 | 3,244 | 4,090 | 4,272 |
| Bondholders | .. | .. | .. | .. | .. | .. |
| Commercial banks and others | 135 | 2,209 | 3,436 | 3,244 | 4,090 | 4,272 |
| Private nonguaranteed debt from: | 1,224 | 4,491 | 4,651 | 4,981 | 5,886 | 6,621 |
| Bondholders | .. | .. | .. | .. | .. | .. |
| Commercial banks and others | 1,224 | 4,491 | 4,651 | 4,981 | 5,886 | 6,621 |
| Use of IMF credit and SDR allocations | 647 | 274 | 1,357 | 1,444 | 1,760 | 2,062 |
| IMF credit | 354 | 0 | 557 | 683 | 993 | 1,316 |
| SDR allocations | 293 | 274 | 800 | 761 | 767 | 746 |
| Short-term external debt stocks | 1,389 | 3,442 | 3,872 | 4,467 | 4,554 | 3,383 |
| Disbursements, long-term | 1,361 | 1,459 | 3,049 | 3,104 | 5,200 | 4,112 |
| Public and publicly guaranteed sector | 1,145 | 1,181 | 2,865 | 2,421 | 4,030 | 3,500 |
| Private sector not guaranteed | 216 | 279 | 184 | 683 | 1,171 | 612 |
| Principal repayments, long-term | 134 | 984 | 1,142 | 1,533 | 1,547 | 1,204 |
| Public and publicly guaranteed sector | 55 | 968 | 1,118 | 1,179 | 1,282 | 1,126 |
| Private sector not guaranteed | 79 | 15 | 25 | 353 | 266 | 78 |
| Interest payments, long-term | 51 | 365 | 319 | 429 | 603 | 725 |
| Public and publicly guaranteed sector | 34 | 363 | 315 | 377 | 547 | 691 |
| Private sector not guaranteed | 17 | 2 | 4 | 52 | 56 | 34 |
The table below focuses on PPG debt in 2024, broken down by creditor type and key creditors where specified. Note that IMF credit is reported separately in the raw data but is included here as part of overall PPG (under multilateral creditors) per the report's figure, which explicitly incorporates it. The total PPG debt (including IMF credit) is approximately $25,593 million (long-term PPG $24,277 + IMF credit $1,316). Specific creditor breakdowns (e.g., China, AfDB) are derived from the report's Figure 1, which provides a visual pie chart; percentages are approximate and may reflect rounded values.
| Creditor Type | Sub-Creditor/Creditor | Amount (US$ million) | % of Total PPG (incl. IMF) |
| Multilateral (excl. IMF) | Total Multilateral (excl. IMF) | 16,435 | ~64% |
| World Bank | 12,097 | ~47% | |
| AfDB (African Development Bank) | ~3,583 (est. based on 14%) | ~14% | |
| Other Multilateral | ~4,351 (est. based on 17%) | ~17% | |
| IMF Credit | IMF | 1,316 | ~5% (reported as 6% in figure) |
| Bilateral | Total Bilateral | 3,571 | ~14% |
| China | ~2,559 (est. based on ~10%; figure label may have OCR variance) | ~10% | |
| India | ~512 (est. based on 2%) | ~2% | |
| Korea, Rep. | ~512 (est. based on 2%) | ~2% | |
| France | ~256 (est. based on 1%) | ~1% | |
| Other Bilateral | ~1,538 (est. based on 6%) | ~6% | |
| Private Creditors | Total Private | 4,272 | ~17% |
| Bondholders | .. | 0% | |
| Commercial Banks and Others | 4,272 | ~17% (incl. other commercial ~4%) | |
| Total PPG (incl. IMF) | 25,593 | **100% |
The International Debt Report 2025 provides detailed external debt statistics for low- and middle-income countries, including East African nations. Below is a comparison focusing on Tanzania and other East African countries (Burundi, Democratic Republic of the Congo (DRC), Ethiopia, Kenya, Rwanda, Somalia, and Uganda). The data is drawn from the report's country tables and snapshots. Note that some values for Ethiopia and Burundi are missing in the report (indicated as ".."), and for Somalia, I supplemented with data from the World Bank's online IDS portal as the PDF extraction for that country was incomplete. Population for Uganda is estimated based on report context (not explicitly listed in the extracted data). All figures are in US$ million unless otherwise noted.
| Country | Total External Debt Stock (US$ million) | External Debt % of GNI | External Debt % of Exports | Debt Service % of GNI | Debt Service % of Exports | Net Debt Inflows (US$ million) | GNI (US$ million) | Population (million) |
| Tanzania | 36,343 | 47 | 222 | 3 | 12 | 3,056 | 76,808 | 69 |
| Burundi | 1,024 | 47 | .. | 2 | .. | 10 | 2,173 | 14 |
| DRC | 12,485 | 18 | 35 | 1 | 1 | 651 | 68,396 | 109 |
| Ethiopia | 36,548 | .. | 311 | .. | 12 | 2,817 | .. | 132 |
| Kenya | 42,886 | 35 | 206 | 5 | 27 | 1,006 | 122,557 | 56 |
| Rwanda | 13,050 | 94 | 242 | 3 | 8 | 1,900 | 13,901 | 14 |
| Somalia | 2,837 | .. | .. | .. | .. | .. | .. | 18 |
| Uganda | 20,534 | 39 | 184 | 2 | 14 | 676 | 52,361 | 50 |
By the end of 2024, Tanzania’s external debt landscape had reached a critical juncture, reflecting a decade of accelerated borrowing to finance infrastructure, energy, and social development priorities. According to the World Bank’s International Debt Report 2025, Tanzania’s total external debt stock stood at US$36.3 billion, more than four times higher than the US$8.9 billion recorded in 2010. Within this total, Public and Publicly Guaranteed (PPG) debt accounted for approximately US$25.6 billion, underscoring the central role of government-backed borrowing in shaping the country’s fiscal position.
The structure of Tanzania’s public debt financing in 2024 is heavily tilted toward multilateral institutions, a feature that distinguishes Tanzania from several of its East African peers and has important implications for sustainability. Multilateral creditors—including the World Bank, the African Development Bank (AfDB), and the International Monetary Fund (IMF)—collectively financed about 69% of Tanzania’s PPG external debt, equivalent to roughly US$17.8 billion. The World Bank alone accounted for US$12.1 billion, representing nearly half (47%) of total PPG debt, making it Tanzania’s single largest creditor. This reliance on concessional multilateral finance has helped Tanzania maintain relatively low debt-servicing pressures, with debt service consuming only 3% of Gross National Income (GNI) and 12% of export earnings in 2024—well below Kenya’s 5% of GNI and 27% of exports.
Bilateral creditors played a secondary but strategically significant role, financing approximately 14% of PPG debt, or US$3.6 billion. Within this category, China emerged as the dominant bilateral lender, holding an estimated US$2.6 billion, equivalent to around 10% of total PPG debt. These loans are largely associated with large-scale infrastructure projects, including transport and energy investments, which have long-term growth potential but also carry execution and revenue risks. Other bilateral partners—such as India, Korea, and France—collectively accounted for smaller shares (each around 1–2%), often targeting sector-specific development initiatives.
Private creditors represented a growing but more risk-sensitive component of Tanzania’s public debt portfolio. In 2024, private creditors—primarily commercial banks and other private lenders—held approximately US$4.3 billion, or 17% of PPG debt. Notably, Tanzania had no exposure to international bondholders, unlike regional peers such as Kenya. This absence of eurobond debt has shielded Tanzania from rollover and refinancing risks during a period of elevated global interest rates, reinforcing short-term debt sustainability. However, private loans typically carry higher interest rates and shorter maturities, meaning their rising share could increase fiscal pressure if not carefully managed.
From a sustainability perspective, Tanzania’s creditor composition offers both reassurance and caution. On the one hand, the dominance of concessional multilateral financing has kept debt servicing costs manageable and supported macroeconomic stability, even as net external debt inflows reached US$3.1 billion in 2024—the highest in East Africa. On the other hand, continued reliance on external borrowing, particularly in a context where external debt equals 47% of GNI and 222% of export earnings, exposes Tanzania to exchange rate shocks and export volatility.
Ultimately, who finances Tanzania’s public debt matters as much as how much is borrowed. In 2024, Tanzania’s public debt sustainability was underpinned by favorable creditor terms rather than low debt levels. Maintaining this position will require disciplined borrowing, stronger export growth, and ensuring that debt-financed investments generate sufficient economic returns to support repayment over the medium to long term. Read More of This Topic: External Debt Stock by Borrower
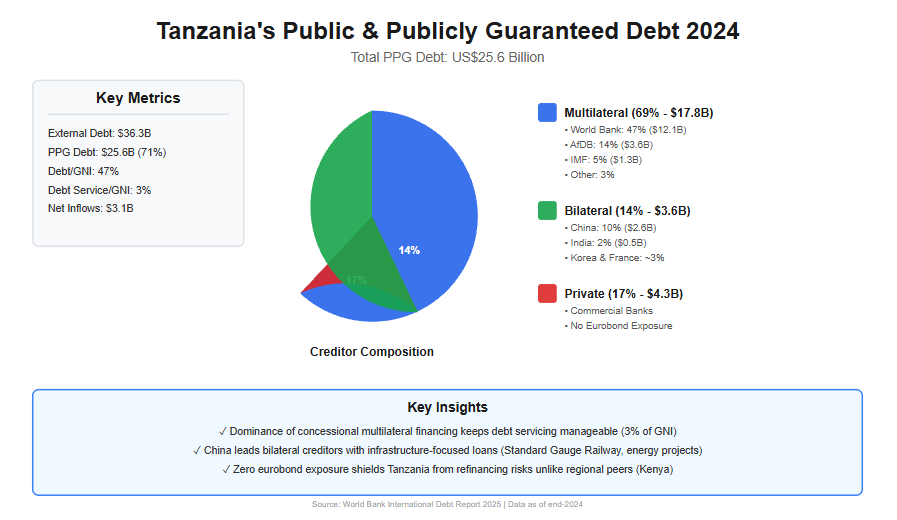
PPG debt includes loans to the public sector that are guaranteed by the government, encompassing borrowings from official creditors (multilateral and bilateral) and private sources. By the end of 2024, Tanzania's PPG debt (including IMF credit) stood at approximately US$25.6 billion, accounting for a significant portion of the country's long-term external debt. This figure reflects Tanzania's strategy of leveraging concessional financing to fund development priorities, but it also underscores vulnerabilities to global interest rate shifts and currency fluctuations.
The creditor composition reveals a heavy dependence on multilateral lenders, which provide favorable terms such as longer maturities and lower interest rates. This has helped keep debt servicing burdens manageable—at 3% of GNI and 12% of exports in 2024—compared to regional peers like Kenya (5% of GNI and 27% of exports). However, with net debt inflows reaching US$3.1 billion in 2024, the highest in East Africa, ongoing borrowing could strain future fiscal space if export growth falters.
The following table presents Tanzania's PPG debt in 2024, categorized by creditor type and key sub-creditors. Data is sourced from the International Debt Report 2025, with specific breakdowns estimated from the report's visual representations (e.g., pie charts in Figure 1). Amounts are in US$ million, and percentages are approximate, reflecting rounded values from the report. IMF credit is integrated under multilateral creditors, as per the report's methodology, contributing to the total PPG figure of US$25,593 million (derived from long-term PPG of US$24,277 million plus IMF credit of US$1,316 million).
| Creditor Type | Sub-Creditor/Creditor | Amount (US$ million) | % of Total PPG (incl. IMF) |
| Multilateral (excl. IMF) | Total Multilateral (excl. IMF) | 16,435 | ~64% |
| World Bank | 12,097 | ~47% | |
| AfDB (African Development Bank) | ~3,583 (est.) | ~14% | |
| Other Multilateral | ~4,351 (est.) | ~17% | |
| IMF Credit | IMF | 1,316 | ~5% (reported as 6% in figure) |
| Bilateral | Total Bilateral | 3,571 | ~14% |
| China | ~2,559 (est.) | ~10% | |
| India | ~512 (est.) | ~2% | |
| Korea, Rep. | ~512 (est.) | ~2% | |
| France | ~256 (est.) | ~1% | |
| Other Bilateral | ~1,538 (est.) | ~6% | |
| Private Creditors | Total Private | 4,272 | ~17% |
| Bondholders | .. | 0% | |
| Commercial Banks and Others | 4,272 | ~17% (incl. other commercial ~4%) | |
| Total PPG (incl. IMF) | 25,593 | 100% |
The dominance of multilateral creditors (around 69% including IMF) in Tanzania's PPG debt portfolio is a double-edged sword. On one hand, it ensures concessional terms that support debt sustainability; the World Bank and AfDB together account for over 60% of this category, financing projects aligned with Tanzania's National Development Vision 2025. IMF credit, at US$1,316 million, has provided balance-of-payments support, particularly post-COVID recovery.
Bilateral creditors, making up 14%, highlight strategic partnerships. China's ~10% share is notable, linked to major investments like the Standard Gauge Railway and power plants. Smaller contributions from India, Korea, and France often focus on sector-specific aid, such as agriculture and technology.
Private creditors' 17% share signals maturing financial markets but introduces risks, as these loans typically carry higher interest rates and shorter terms. With no bondholder debt reported, Tanzania has avoided eurobond exposures seen in peers like Kenya, reducing immediate refinancing pressures.
In the East African context, Tanzania's PPG composition favors stability compared to Rwanda (94% debt-to-GNI) or Ethiopia (311% debt-to-exports). However, as global conditions tighten, diversifying creditors and boosting exports (e.g., through mining and agriculture) will be crucial. The report emphasizes debt transparency and management reforms to mitigate risks.
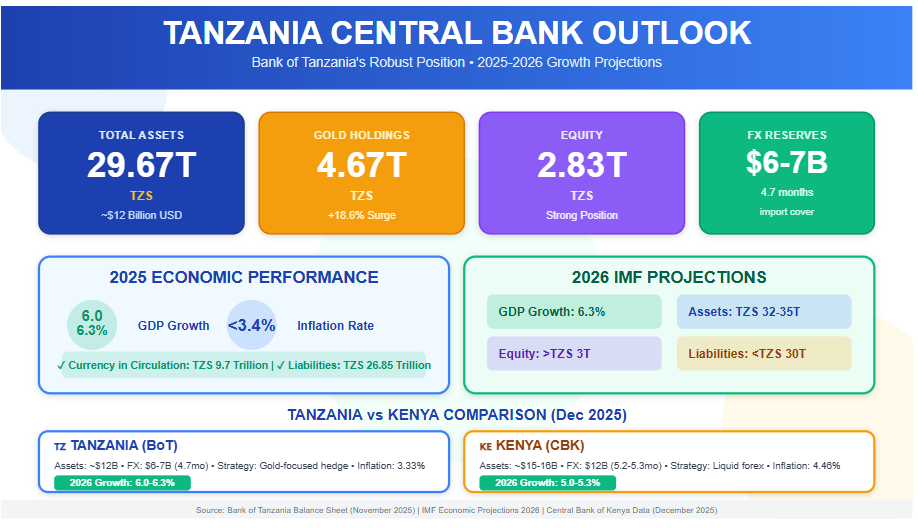
As of November 2025, the Bank of Tanzania (BoT) recorded total assets of TZS 29.67 trillion (approximately USD 12 billion), liabilities of TZS 26.85 trillion, and equity of TZS 2.83 trillion, featuring a remarkable increase in gold holdings (over TZS 4.67 trillion combined) and cash equivalents (TZS 4.45 trillion) driven by record gold sales and tourism revenue—this directly reflects Tanzania's strong economic performance in 2025, with GDP growth of 6.0–6.3%, inflation below 3.4%, and foreign exchange reserves of USD 6–7 billion (4.7 months of import cover). The BoT plays a critical role in managing the economy through monetary policies, such as purchasing domestic gold, controlling currency in circulation (TZS 9.7 trillion), and extending loans to the private sector to stimulate investment and sustainable development.
If this trend continues into 2026, in line with IMF projections (GDP growth of 6.3%), BoT assets are expected to reach TZS 32–35 trillion, liabilities to remain well-managed below TZS 30 trillion, and equity to strengthen above TZS 3 trillion—signaling a steadily growing and resilient economy. In comparison, the Central Bank of Kenya (CBK) holds total assets of approximately KES 2 trillion (USD 15–16 billion) with foreign reserves of around USD 12 billion (5.2–5.3 months of import cover) as of December 2025; while the CBK offers stronger liquid foreign reserves for greater protection against shocks, the BoT's gold-focused strategy provides a hedge against global price volatility, with both institutions contributing to their countries' growth (Kenya projected at 5.0–5.3% in 2026) through effective inflation control and credit stimulation. Read More: Central Bank Asset Dynamics and Tanzania’s Macroeconomic Performance in 2025–2026
In East Africa, the Bank of Tanzania (BoT) and the Central Bank of Kenya (CBK) stand as critical institutions steering their respective economies toward stability and expansion. As of December 2025, both nations exhibit resilient growth trajectories, with Tanzania's GDP expanding by 5.6% in FY2024/25 and projections for 6.0-6.3% in 2025-2026, while Kenya anticipates 5.3% growth in 2025 amid controlled inflation. These figures reflect the central banks' pivotal roles in fostering economic development through monetary policy, reserve management, and financial stability. However, Tanzania's post-election political turmoil in late 2025 introduces risks that could dampen its 2026 outlook, underscoring the interplay between governance and economic progress. This article examines the functions of BoT and CBK in driving growth, offers a comparative lens, and explores how Tanzania's political dynamics might influence its economic path forward.
The BoT, established under the Bank of Tanzania Act of 2006, serves as the guardian of monetary stability while actively supporting broader economic growth. Its primary mandate includes formulating and implementing monetary policy to maintain low inflation—currently at 3.33% in 2025—and ensuring financial system soundness. Beyond price stability, the BoT contributes to development by developing financial markets, promoting inclusive finance, and accumulating foreign reserves to buffer against external shocks. For instance, its November 2025 balance sheet reveals total assets of TZS 29.67 trillion (approximately USD 12 billion), bolstered by an 18.6% surge in gold holdings to TZS 4.67 trillion, reflecting strategic purchases from domestic miners to diversify reserves and support the mining sector—a key driver of Tanzania's export-led growth.
By managing currency in circulation (TZS 9.7 trillion as of November) and extending loans to the private sector (up 62% month-on-month to TZS 1.35 trillion), the BoT stimulates investment in agriculture, tourism, and manufacturing, which employ over 65% of the workforce. In January 2025's Monthly Economic Review, the BoT emphasized aligning monetary policy with growth objectives, such as sustaining reserves at USD 6.17 billion (4.7 months of import cover) to enhance investor confidence and facilitate infrastructure projects like LNG developments. These efforts have helped Tanzania achieve resilient GDP growth despite global headwinds, positioning the bank as a catalyst for long-term development through policies that encourage savings, credit access, and economic diversification.
Similarly, the CBK, mandated by Article 231 of Kenya's Constitution, prioritizes price stability while promoting economic growth and public interest. It formulates monetary policy, issues currency, and regulates the financial sector to foster a stable environment for investment. As of December 2025, the CBK lowered its Central Bank Rate (CBR) to 9.00% from previous levels, aiming to stimulate economic activity, support SMEs, and boost lending amid inflation of 4.46% in November—well within its 2.5-7.5% target. This proactive stance, as outlined in its bi-annual Monetary Policy Statements, regulates money supply growth in line with GDP targets, using tools like Open Market Operations and a Cash Reserve Ratio of 3.25% to manage liquidity.
The CBK's foreign exchange reserves stand at approximately USD 12 billion (5.2-5.3 months of import cover), providing a stronger buffer than Tanzania's and enabling interventions to stabilize the Kenyan Shilling. By encouraging long-term investments and maintaining deflation-free conditions, the bank supports key sectors like agriculture, services, and manufacturing, which have driven Kenya's consistent GDP expansion. For example, its role in currency issuance and management ensures efficient transactions, while financial inclusion initiatives have expanded access to credit, contributing to poverty reduction and job creation. Overall, the CBK acts as an economic enabler, balancing stability with growth to position Kenya as a regional hub.
While both central banks share core functions like inflation control and reserve management, their approaches reflect national economic structures. Tanzania's BoT emphasizes commodity diversification, with gold comprising a significant portion of reserves, aligning with its mining-dependent economy. In contrast, Kenya's CBK relies more on liquid foreign currency holdings, suiting its service-oriented market with higher external trade volumes.
| Aspect | Bank of Tanzania (BoT) | Central Bank of Kenya (CBK) |
| Total Assets (est. Dec 2025) | ~USD 12 billion (TZS 29.67 trillion, Nov data) | ~USD 15-16 billion (KES ~2 trillion est.) |
| FX Reserves | ~USD 6-7 billion (4.7 months import cover) | ~USD 12 billion (5.2-5.3 months cover) |
| Key Growth Focus | Gold purchases, private sector lending; supports mining/tourism | Rate cuts for SMEs; stabilizes services/manufacturing |
| Inflation (2025) | 3.33% | 4.46% (Nov) |
| Policy Tools | Domestic gold acquisition, monetary easing | CBR at 9%, Open Market Operations |
| GDP Contribution | Enables 6%+ growth via reserves buildup | Sustains 5%+ growth through liquidity |
This table highlights Kenya's edge in reserve depth for external resilience, while Tanzania's strategy hedges against volatility through gold. Both institutions have effectively contained inflation below 5%, fostering environments conducive to investment and poverty alleviation.
Tanzania's political stability, once a regional benchmark, has been shaken by the October 2025 general elections, marred by allegations of irregularities and resulting in widespread protests. President Samia Suluhu Hassan secured re-election, but opposition parties like Chadema have decried the process as fraudulent, calling for a UN-overseen transitional government. Post-election violence led to a lethal crackdown by security forces, with UN experts condemning systematic human rights violations, including killings and digital restrictions. By December 2025, the government imposed nationwide protest bans, tightened security, and urged the military to remain apolitical amid escalating tensions.
This unrest could jeopardize Tanzania's 2026 economic projections of 6.1-6.3% GDP growth. Prolonged instability might deter foreign investment, disrupt tourism (a key forex earner), and strain fiscal resources through heightened security spending. If protests escalate, supply chain disruptions could inflate food prices, pushing inflation above the 3-5% target and eroding purchasing power. Moreover, international scrutiny from bodies like the UN and African Union could lead to sanctions or reduced aid, impacting reserves and infrastructure projects. However, if the government addresses grievances through dialogue—as hinted in recent calls for military professionalism—stability could return, allowing the BoT's policies to sustain growth amid global trade tensions.
The BoT and CBK exemplify how central banks can drive economic development by balancing stability with proactive growth measures, from reserve diversification in Tanzania to rate adjustments in Kenya. Their efforts have positioned both nations for robust 2025-2026 performance, with low inflation and adequate buffers against external risks. Yet, Tanzania's political volatility post-2025 elections poses a wildcard, potentially hindering 2026 growth through investor flight and fiscal strain. For sustained progress, addressing governance issues will be as crucial as monetary policy, ensuring these East African powerhouses continue their upward trajectories.
Zanzibar’s economic performance in September 2025 reflects solid recovery momentum supported by easing inflation (down to 3.5% from 3.9%), strong revenue mobilization, and an expanded current account surplus rising to USD 836.6 million (+34.7%). The external sector continued to benefit from robust tourism activity, with travel receipts jumping by 36.4% amid increased arrivals (+28.2%). Development expenditure dominated the TZS 420.1 billion budget (60%), signaling strategic investment in infrastructure and social services, while strong domestic financing (78.4% coverage) reinforced fiscal sustainability. Exports grew significantly to USD 1,473.9 million (+27.3%), driven overwhelmingly by services, despite a sharp 76% fall in clove exports due to seasonal cycles. Imports also rose moderately (+18.9%) to USD 658.4 million, largely reflecting higher capital goods inflows (+84.7%), indicating continued investment activity. Overall, Zanzibar’s growth remains anchored in tourism, supported by stable price trends, improved fiscal discipline, and strong external sector performance—though diversification remains essential to reduce vulnerability to single-sector shocks.
Zanzibar’s economy showed moderate improvement supported mainly by:
Headline Inflation (Year ending September 2025)
| Indicator | Earlier (2024) | Sept 2025 | Trend |
| Headline inflation | 3.9% | 3.5% | ↓ continued easing |
| Food inflation | 4.2% | 4.1% | slightly lower |
| Non-food inflation | 3.7% | 2.9% | declined |
Source: Inflation table under Zanzibar section
Notes
Expenditure — September 2025
| Component | Amount (TZS Billion) | Share/Notes |
| Total expenditure | 420.1 | — |
| Recurrent expenditure | 170.0 | ~40% |
| Development expenditure | 250.1 | ~60% |
| Domestic financing contribution | 78.4% | strong domestic support |
| Deficit | 180.0 | financed via domestic borrowing |
Source: Government operations chart and narrative
Interpretation
Key Indicators
| Item | 2024 (USD million) | 2025 (USD million) | % Change |
| Current account surplus | 621.2 | 836.6 | +34.7% |
| Exports of goods & services | 1,157.7 | 1,473.9 | +27.3% |
| Imports of goods & services | 553.9 | 658.4 | +18.9% |
Drivers of Improvement
Higher tourism receipts (+36.4%)
Increased arrivals (885,385 visitors, +28.2%)
Stronger exports of services
Exports of Goods and Services (Year ending September 2025)
| Component | 2024 | 2025 | remarks |
| Total exports | USD 1,157.7m | USD 1,473.9m | Strong growth |
| Travel receipts | — | USD 1,503.9m | Key driver (tourism) |
| Clove exports | USD 26.3m* | USD 6.3m | Declined 76% |
* previous value referenced from narrative (crop cycle impact)
Tourism was the standout performer.
Imports of Goods and Services
| Component | 2024 | 2025 | % Change |
| Total imports | USD 553.9m | USD 658.4m | +18.9% |
| Capital goods | — | USD 73.6m | +84.7% |
| Consumer goods | — | increased | driven by non-industrial transport equipment |
| Indicator | 2024 | 2025 | Trend |
| Headline inflation | 3.9% | 3.5% | ↓ improving |
| Food inflation | 4.2% | 4.1% | stable |
| Non-food inflation | 3.7% | 2.9% | ↓ falling |
| Government expenditure | TZS 420.1 bn | — | sustained |
| Development expenditure | TZS 250.1 bn | — | dominant |
| Current account surplus | USD 621.2m | USD 836.6m | ↑ strong |
| Exports | USD 1,157.7m | USD 1,473.9m | ↑ strong |
| Imports | USD 553.9m | USD 658.4m | ↑ moderate |
| Tourism receipts | USD 1,503.9m | +36.4% | leading sector |
Zanzibar's economic indicators for September 2025, as outlined in Section 3.0 (Economic Performance in Zanzibar) of the Bank of Tanzania's (BOT) Monthly Economic Review (October 2025), depict a resilient semi-autonomous economy buoyed by tourism recovery and fiscal discipline. Headline inflation eased to 3.5% (from 3.9% in 2024), budgetary operations showed strong development focus (TZS 250.1 billion, 60% of total TZS 420.1 billion expenditure), and the external sector expanded with a USD 836.6 million current account (CA) surplus (+34.7% y/y), driven by travel receipts (USD 1,503.9 million, +36.4%). This performance mirrors mainland trends—6.3% Q2 GDP growth, 3.4% inflation—but highlights Zanzibar's tourism dependence amid clove export declines (-76%). Below, I analyze implications across core areas, drawing synergies with national dynamics like shilling appreciation (+9.4% y/y) and accommodative policy (CBR 5.75%).
1. Inflation Developments: Broad-Based Easing Supports Household Stability
2. Government Budgetary Operations: Development-Led Fiscal Expansion
3. External Sector Performance: Tourism-Fueled Surplus Amid Import Pressures
4. Interlinkages: Tourism as Growth Anchor with National Spillovers
5. Macroeconomic Context from the Review
| Indicator | 2024 Value | 2025 Value (Sep YE) | % Change | Economic Implication |
| Headline Inflation | 3.9% | 3.5% | ↓ 0.4 pp | Eases cost pressures; supports tourism spending. |
| Food Inflation | 4.2% | 4.1% | ↓ 0.1 pp | Supply improvements buffer imports; stable vs. mainland 7.0%. |
| Non-Food Inflation | 3.7% | 2.9% | ↓ 0.8 pp | Service declines aid affordability; ties to shilling strength. |
| Total Expenditure | — | TZS 420.1B | — | Capital focus (60%) drives infra; domestic financing 78.4%. |
| Development Exp | — | TZS 250.1B | — | Boosts growth enablers like tourism assets. |
| CA Surplus | USD 621.2M | USD 836.6M | +34.7% | FX buffer; finances deficit without external strain. |
| Exports | USD 1,157.7M | USD 1,473.9M | +27.3% | Tourism-led (+36.4%); offsets clove -76%. |
| Imports | USD 553.9M | USD 658.4M | +18.9% | Capital goods +84.7% signals investment; moderate risk to surplus. |
| Tourism Receipts | — | USD 1,503.9M | +36.4% | Core driver; +28.2% arrivals enhance resilience. |
In conclusion, September 2025's data imply a tourism-propelled Zanzibar economy with stabilizing prices and external strength, complementing national momentum for balanced union growth. While development spending and surplus signal sustainability, mitigating tourism/clove risks through diversification is vital for enduring resilience amid global headwinds.
Tanzania's National Consumer Price Index (NCPI) release for September 2025, issued by the National Bureau of Statistics on October 8, 2025, reveals a stable macroeconomic environment characterized by headline inflation holding steady at 3.4% year-over-year—the highest level since June 2023 but well within the Bank of Tanzania's (BoT) target range of 3-5%. This marks no change from August 2025, with the overall NCPI edging up slightly to 119.86 (2020=100) from 119.77, driven by modest price increases in select food and non-food items. Food and non-alcoholic beverages inflation eased to 7.0% from 7.7%, reflecting a -0.6% monthly dip in the index, while non-food inflation ticked up to 1.9% from 1.6%. Core inflation, excluding volatile items like unprocessed food and energy, rose modestly to 2.2% from 2.0%, signaling underlying price pressures remain contained.
This stability, amid robust GDP growth of 5.4% in Q1 2025, underscores Tanzania's resilient post-pandemic recovery and effective policy framework.
Tanzania Inflation Overview (September 2025)
| Indicator | August 2025 | September 2025 | Change | Notes |
| Headline Inflation Rate | 3.4% | 3.4% | — | Inflation remained unchanged month-to-month. |
| Overall NCPI (2020 = 100) | 119.77 | 119.86 | +0.09 | Slight increase in prices across key goods and services. |
| Food & Non-Alcoholic Beverages Inflation | 7.7% | 7.0% | ▼ -0.7 | Price growth for food items slowed down. |
| All Items Less Food & Non-Alcoholic Beverages | 1.6% | 1.9% | ▲ +0.3 | Non-food inflation slightly increased. |
| Core Inflation | 2.0% | 2.2% | ▲ +0.2 | Excludes volatile items (unprocessed food, energy, utilities). |
Inflation by Main Consumption Group (September 2025)
| Main Group | Weight (%) | Index (Sept 2024) | Index (Aug 2025) | Index (Sept 2025) | 1-Month % Change | 12-Month % Change |
| Food & Non-Alcoholic Beverages | 28.2 | 121.17 | 130.48 | 129.70 | -0.6 | 7.0 |
| Alcoholic Beverages & Tobacco | 1.9 | 109.62 | 112.90 | 113.60 | +0.6 | 3.6 |
| Clothing & Footwear | 10.8 | 112.96 | 114.77 | 115.09 | +0.3 | 1.9 |
| Housing, Water, Electricity, Gas & Other Fuels | 15.1 | 115.76 | 118.10 | 118.48 | +0.3 | 2.3 |
| Furnishings & Household Equipment | 7.9 | 113.77 | 116.32 | 116.99 | +0.6 | 2.8 |
| Health | 2.5 | 108.31 | 109.55 | 109.60 | 0.0 | 1.2 |
| Transport | 14.1 | 118.28 | 119.69 | 120.78 | +0.9 | 2.1 |
| Information & Communication | 5.4 | 106.09 | 106.32 | 106.31 | 0.0 | 0.2 |
| Recreation, Sport & Culture | 1.6 | 110.18 | 111.19 | 111.10 | -0.1 | 0.8 |
| Education Services | 2.0 | 108.81 | 111.99 | 111.99 | 0.0 | 2.9 |
| Restaurants & Accommodation | 6.6 | 116.27 | 117.29 | 117.39 | +0.1 | 1.0 |
| Insurance & Financial Services | 2.1 | 101.98 | 102.36 | 102.34 | 0.0 | 0.4 |
| Personal Care & Miscellaneous | 2.1 | 115.67 | 118.36 | 118.30 | 0.0 | 2.3 |
| Total (All Items Index) | 100.0 | 115.88 | 119.77 | 119.86 | +0.1 | 3.4 |
Key Monthly Drivers (Aug–Sept 2025)
Price increases were observed in:
Economic Implications of Tanzania's September 2025 Inflation Data
1. Monetary Policy and Macroeconomic Stability
2. Impact on Household Consumption and Poverty
| Category | Weight (%) | 12-Month Inflation (Sept 2025) | Implication for Households |
| Food & Non-Alcoholic Beverages | 28.2 | 7.0% | Easing trend aids affordability of staples, reducing food insecurity risks. |
| Housing, Water, Electricity, Gas & Fuels | 15.1 | 2.3% | Modest rises in fuels like kerosene signal ongoing utility vulnerabilities. |
| Transport | 14.1 | 2.1% | Stable growth supports commuting costs, benefiting informal workers. |
| All Items Less Food | 71.8 | 1.9% | Low non-food pressures preserve purchasing power for durables. |
3. Sectoral and Supply-Side Dynamics
4. Broader Growth and Investment Outlook
In summary, September 2025's inflation data signals a "soft landing" for Tanzania's economy—stable prices fostering inclusive growth without derailing expansion. This positions the country favorably in East Africa, where peers face higher volatility, and supports the BoT's projection of inflation averaging 3.4% for the year. Policymakers should prioritize agricultural diversification and energy security to sustain this momentum into 2026.
The Tanzania Shilling (TZS) remained broadly stable in July 2025 despite mild depreciation pressures. The currency averaged TZS 2,666.79 per USD, a 1.34% monthly decline from June, while annual depreciation slowed to 0.11%, reflecting resilience compared to 0.21% in June. Stability was supported by higher foreign exchange market activity, with IFEM turnover rising 33.7% to USD 162.5 million, boosted by export inflows, while the Bank of Tanzania intervened by selling USD 17.5 million. Importantly, reserves strengthened to USD 6,194.4 million, covering about 5 months of imports, well above EAC (4.5 months) and SADC (3 months) benchmarks, cushioning the currency against external shocks.
| Indicator | June 2025 | July 2025 | Annual Comparison |
| Exchange Rate (TZS per USD, average) | 2,631.56 | 2,666.79 | Depreciation 0.11% |
| Monthly Change (%) | — | -1.34% | — |
| IFEM Turnover (USD Million) | 121.5 | 162.5 | +33.7% |
| BOT Intervention (USD Million sold) | 6.3 | 17.5 | — |
| Gross Reserves (USD Million) | — | 6,194.4 | 5,292.2 (Jul 2024) |
| Import Cover (months) | — | 5.0 | >EAC: 4.5; >SADC: 3 |
1. Exchange Rate Movement
2. Market Liquidity & Central Bank Intervention
3. Reserves Buffer
The TZS's stability in July 2025 reflects a positive interplay of export strength, reserve adequacy, and policy vigilance, mitigating depreciation risks while supporting economic expansion. This fosters a conducive environment for private sector activity, with potential upsides in tourism and agriculture, though monitoring import pressures remains key to avoid imbalances. Compared to earlier depreciations (e.g., 6.1% in 2023), current trends indicate improved resilience, aligning with IMF and World Bank views on Tanzania's stable outlook.