Why TRA's Strong Performance Is Still Not Enough | TICGL Analysis
Why TRA's Strong Performance Is Still Not Enough
Despite record collections of TSh 18.77 trillion and 103.7% efficiency, Tanzania's revenue growth cannot match its development ambitions
18.77T
TSh Collected (H1 2025/26)
103.7%
Target Achievement
13.6%
Year-on-Year Growth
6-7T
TSh Budget Deficit
Record-Breaking Performance
The Tanzania Revenue Authority (TRA) has delivered one of its strongest revenue performances in recent history, consistently surpassing collection targets and recording solid year-on-year growth. In the first half of the 2025/26 fiscal year (July to December 2025), TRA collected TSh 18.77 trillion, exceeding its target of TSh 18.10 trillion and achieving an overall efficiency of 103.7%. This performance represents a 13.6% increase compared to the same period in 2024/25, when collections stood at TSh 16.52 trillion.
Historic Achievement: December 2025 set a new record with TSh 4.13 trillion collected in a single month, the highest monthly revenue ever recorded by the Authority. Monthly collections exceeded targets in all six months, with efficiency ranging between 100.4% and 110.0%.
Monthly Revenue Performance
Month
Collections 2024/25
Target 2025/26
Collections 2025/26
Efficiency
Growth
July
TSh 2.35T
TSh 2.57T
TSh 2.68T
104.1%
14.1%
August
TSh 2.42T
TSh 2.56T
TSh 2.82T
110.0%
16.3%
September
TSh 3.02T
TSh 3.31T
TSh 3.47T
105.0%
15.1%
October
TSh 2.65T
TSh 2.80T
TSh 2.81T
100.4%
6.0%
November
TSh 2.50T
TSh 2.85T
TSh 2.86T
100.4%
14.4%
December
TSh 3.58T
TSh 4.01T
TSh 4.13T
102.9%
15.5%
Total
TSh 16.52T
TSh 18.10T
TSh 18.77T
103.7%
13.6%
What's Driving the Success
This strong performance is not accidental. It reflects improved tax administration, aggressive debt recovery, and enhanced compliance measures. Key achievements include:
TSh 483 billion collected from tax arrears through enhanced debt recovery
Registered taxpayers increased by 7.3% to 7.68 million
2,094 new staff trained to strengthen institutional capacity
Over the medium term, the results are even more striking. Revenue collected in the first half of the fiscal year has more than doubled since 2020/21, rising from TSh 9.24 trillion to TSh 18.77 trillion, while TRA's operational efficiency improved from 77.48% to 85.71%.
The Fundamental Problem: Revenue vs. Expenditure Mismatch
Yet, despite these undeniable achievements, TRA's strong performance is still not enough to meet Tanzania's broader economic and development needs. The core challenge lies not in revenue administration, but in the mismatch between revenue growth and the scale of government expenditure requirements.
For 2025/26, the Government has set an ambitious annual revenue target of TSh 36.06 trillion, equivalent to 14.1% of GDP. However, total government expenditure is projected at TSh 42 to 44 trillion, leaving a financing gap of approximately TSh 6 to 7 trillion.
Persistent Budget Deficits
This structural gap has resulted in persistent budget deficits averaging 3 to 4% of GDP over the past decade, even in years of strong revenue performance. The consequences are significant:
Fiscal Year
Budget Deficit
Deficit as % of GDP
Key Funding Sources
2020/21
TSh 4.2T
3.5%
Domestic borrowing, concessional loans
2021/22
TSh 4.8T
3.2%
External aid, bonds
2022/23
TSh 5.1T
3.0%
IMF loans, domestic revenue shortfalls
2023/24
TSh 5.4T
3.1%
Increased borrowing amid inflation
2024/25
TSh 5.6T
3.1%
External debt, grants
2025/26 (Projected)
TSh 6.5T
3.2%
Ongoing borrowing
The Debt Burden
To bridge this gap, the Government continues to rely on domestic and external borrowing, pushing public debt to about 42% of GDP by 2025. The implications are severe:
Debt servicing alone now absorbs 20 to 25% of the national budget
Interest payments in 2024/25 estimated at TSh 4.2 trillion, comparable to an entire month of peak TRA collections
This growing debt burden directly reduces the fiscal space available for new development projects
Structural Economic Constraints
Tanzania's challenges extend beyond the immediate revenue-expenditure gap. Several structural factors limit the impact of even strong tax collection outcomes:
Low Revenue-to-GDP Ratio
At 14.1% of GDP, Tanzania's revenue ratio lags behind regional peers such as Kenya (16 to 18%) and Rwanda (15 to 17%). This limits the Government's ability to finance large-scale infrastructure and social investments without borrowing. Flagship projects under FYDP III and the national development agenda require over TSh 10 trillion annually in capital spending alone. Even with strong TRA performance, domestic revenues currently cover only 60 to 70% of total budgetary needs.
The Informal Economy Challenge
More than 50% of economic activity remains informal, constraining tax potential despite the growing number of registered taxpayers. This vast shadow economy represents billions in uncollected revenue, limiting the government's fiscal capacity.
Weak Production Base
Domestic production growth remains modest at 2.4%, signaling a narrow industrial base. Revenue growth is still highly exposed to external shocks such as inflation, global commodity prices, and import fluctuations. Without a stronger manufacturing and production sector, revenue sustainability remains vulnerable.
Demographic and Climate Pressures
Population growth now exceeds 69 million people, while climate-related pressures on agriculture (which contributes about 25% of GDP) continue to push public spending upward faster than revenues can sustainably grow. These pressures create an ever-expanding need for public services, infrastructure, and social protection.
Exploring Tanzania's Development Financing
How can Tanzania bridge the gap between revenue collection and development needs? What structural reforms are necessary for fiscal sustainability?
TRA's recent revenue performance clearly demonstrates that Tanzania has made meaningful progress in strengthening tax administration and improving compliance. Exceeding collection targets, achieving over 100% efficiency, and more than doubling first-half revenues since 2020/21 are major institutional achievements that should not be understated.
However, the evidence also makes it clear that strong revenue performance alone cannot resolve Tanzania's fiscal and development challenges. Despite collecting TSh 18.77 trillion in just six months and targeting TSh 36.06 trillion for the full year, the Government continues to face annual budget deficits of around 3 to 4% of GDP, driven by expenditure needs that significantly exceed domestic revenue capacity.
The central issue, therefore, is not whether TRA is performing well. It clearly is. The question is whether the structure of the economy and the fiscal framework allow revenue gains to translate into sustainable development financing. A low revenue-to-GDP ratio (14.1%), a large informal sector, modest growth in domestic production, and rising demographic and climate-related pressures all limit the impact of even strong tax collection outcomes.
The Path Forward
TRA's performance should be viewed as a foundation rather than a solution. To move from short-term fiscal resilience to long-term sustainability, Tanzania must complement strong revenue administration with broader economic and fiscal reforms:
Expanding the tax base beyond the current 7.68 million registered taxpayers
Accelerating formalization of the 50% informal economy
Strengthening productive sectors to move beyond 2.4% domestic production growth
Improving expenditure efficiency and prioritization of public spending
Reducing dependence on external borrowing to create sustainable fiscal space
Only through this integrated approach can Tanzania ensure that rising revenues not only meet targets, but also meaningfully support economic growth, reduce borrowing, and deliver lasting development outcomes. The challenge is not administrative; it is structural. And addressing it will require reforms that go far beyond what any revenue authority, no matter how efficient, can achieve alone.
Evidence from 2010–2025
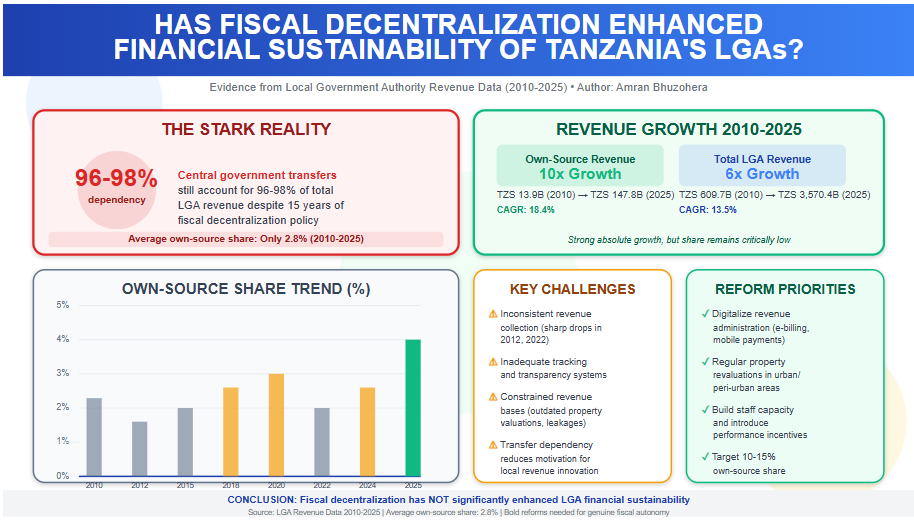
Fiscal decentralization in Tanzania, pursued through the policy of Decentralization by Devolution (D by D), aims to empower Local Government Authorities (LGAs) with greater financial autonomy to fund and manage local development effectively. A key measure of success is the extent to which LGAs can rely on own-source revenue—locally generated through property rates, fees, licenses, and service levies—rather than central government transfers. The core question is whether this policy has meaningfully improved the financial sustainability of LGAs, enabling them to independently finance the bulk of grassroots projects such as roads, schools, health centers, water supply, and sanitation.
Evidence from LGA revenue data spanning 2010 to 2025 indicates that fiscal decentralization has not significantly enhanced financial sustainability. While own-source revenue has grown substantially in absolute terms—from TZS 13.9 billion in 2010 to TZS 147.8 billion in 2025 (a more than tenfold increase)—this has failed to reduce heavy dependence on central transfers. The own-source share of total LGA revenue averaged only 2.8% over the period (excluding the anomalous 0.5% in 2016), ranging from a low of 1.9% in 2012 to a high of 4.1% in 2025. In recent years, despite own-source collections reaching TZS 121.9 billion in 2024 and TZS 147.8 billion in 2025, the share remained modest at 3–4%. This means central government transfers continued to account for 96–98% of total LGA revenue, which expanded from TZS 609.7 billion in 2010 to TZS 3,570.4 billion in 2025.
This persistently low own-source contribution highlights limited progress toward true fiscal autonomy. LGAs, despite implementing most development projects critical to national goals like the Five-Year Development Plans and Sustainable Development Goals, lack the financial independence needed for proactive, timely, and locally prioritized planning. Delays in project execution and resource inefficiencies often result from this dependency.
Several structural challenges explain the stagnation:
Inconsistent revenue collection: Sharp fluctuations—such as drops to TZS 17.2 billion in 2012 and TZS 69.1 billion in 2022—reveal weaknesses in administrative systems and enforcement.
Inadequate tracking and transparency: Incomplete data records, particularly pre-2010 and in certain years, signal systemic monitoring gaps that hinder accountability and mobilization.
Constrained revenue bases: Outdated property valuations, underutilized levies, and leakages from manual processes limit potential yields.
Disincentives from transfer reliance: Predetermined central allocations reduce motivation for local revenue innovation.
Recent trends offer cautious optimism, with own-source growth accelerating in 2023–2025 and the share reaching 4.1% in 2025—the highest in the period. However, this remains far below levels needed for genuine sustainability.
To achieve meaningful enhancement through fiscal decentralization, targeted reforms are required. Priorities include digitalizing revenue administration (e.g., electronic billing and mobile payments), conducting regular property revaluations, building staff capacity, and introducing incentives for high-performing LGAs, such as greater autonomy or matching grants. Linking revenue strategies to local economic drivers—like agriculture, tourism, and small industries—could further boost collections organically. A medium-term target of 10–15% own-source share would better align resources with community needs, foster decentralized development, and build resilience against fiscal shocks.
In summary, while absolute own-source revenue has risen impressively, the low and stagnant share over 2010–2025 demonstrates that fiscal decentralization has yet to deliver substantial financial sustainability for Tanzania’s LGAs. Sustained, bold reforms are essential to realize the full potential of devolution.
Note: The 2016 data point shows Own Sources as 0.0B (likely a recording error or missing data, as noted in the document's limitations). It is treated as anomalous in trend calculations. The "Non-Tax Revenue" column does not factor into the LGA Share % and appears unrelated to the core self-reliance metric (possibly national non-tax figures or a separate category). Read More:Local Government Revenue Collections in Tanzania
Data Table (in billions TZS)
Year
Own Sources (B TZS)
Total Revenue (B TZS)
LGA Share (%)
2010
13.9
609.7
2.3
2011
20.0
722.0
2.8
2012
17.2
909.4
1.9
2013
27.2
1,041.8
2.6
2014
23.3
1,112.9
2.1
2015
41.0
1,478.9
2.8
2016
0.0
1,394.8
0.5
2017
44.6
1,781.9
2.5
2018
58.9
1,817.5
3.2
2019
61.7
2,180.4
2.8
2020
86.1
2,354.8
3.7
2021
82.8
2,545.8
3.3
2022
69.1
3,085.7
2.2
2023
100.8
3,110.9
3.2
2024
121.9
3,877.4
3.1
2025
147.8
3,570.4
4.1
Key Trends and Insights
Absolute Growth in Own Sources — Own-source revenue grew strongly from 13.9B TZS in 2010 to 147.8B TZS in 2025 (over 10x increase). Compound Annual Growth Rate (CAGR, excluding 2016): 18.4%.
Growth in Total Revenue — Total LGA revenue (largely driven by central transfers) rose from 609.7B to 3,570.4B TZS (about 6x increase). CAGR: 13.5%.
LGA Share % (Self-Reliance Indicator):
Average (2010–2025, excluding 2016): 2.8%.
Range: Low of 1.9% (2012) to high of 4.1% (2025).
Trend: Mild upward linear trend (+0.08 percentage points per year), explaining about 43% of variation (moderate positive progress).
Recent years (2020–2025) show volatility but improvement: Peak at 3.7% (2020), dip to 2.2% (2022), then recovery to 4.1% (2025) — driven by strong own-source growth (+46% in 2023, +21% in 2024–2025) while total revenue slowed or declined in 2025.
Implications for LGA Economic Self-Reliance
The revenue data from 2010 to 2025 clearly illustrates that Tanzania's Local Government Authorities (LGAs) remain heavily dependent on central government transfers, which consistently account for 95–98% of total revenue. Even at the highest point in the period—4.1% own-source share in 2025 (TZS 147.8 billion out of TZS 3,570.4 billion total)—locally generated funds cover only a marginal fraction of budgetary needs. This structural dependency severely constrains fiscal autonomy at the local level, where the majority of development projects are executed, including critical infrastructure such as roads, schools, health centers, and water supply systems.
Positive Developments
Despite the overall low share, several encouraging trends emerge:
Own-source revenue has grown substantially faster than total revenue, increasing more than tenfold from TZS 13.9 billion in 2010 to TZS 147.8 billion in 2025, compared to total revenue rising approximately sixfold over the same period.
A notable acceleration in recent years (2023–2025), with own-source collections rising from TZS 100.8 billion (3.2% share) in 2023 to TZS 121.9 billion (3.1%) in 2024 and TZS 147.8 billion (4.1%) in 2025, marking the strongest upward momentum in the dataset.
These gains suggest that, with continued effort, higher levels of self-reliance are achievable.
Persistent Challenges
The data also exposes significant obstacles that hinder progress:
Volatility in collections: Sharp declines, such as own-source revenue falling to TZS 17.2 billion (1.9% share) in 2012 and TZS 69.1 billion (2.2%) in 2022, indicate inconsistent enforcement and administrative weaknesses.
Systemic deficiencies in tracking: As highlighted in the dataset limitations, incomplete records and poor monitoring mechanisms undermine accountability and effective revenue mobilization, creating a self-reinforcing barrier to improvement.
Pathways to Greater Economic Self-Reliance
To build on recent progress and reduce reliance on central transfers, LGAs must pursue targeted, sustained reforms that address both administrative and structural constraints:
Strengthen Revenue Collection Systems Invest in digital tools—such as electronic billing, mobile money integration, and automated tracking—and provide staff training to minimize leakages and enhance efficiency, directly tackling the poor tracking mechanisms noted in the data.
Broaden and Enforce Revenue Bases Prioritize high-yield sources including property rates, business licenses, service levies, and market fees. Implementing regular property revaluations, especially in rapidly growing urban and peri-urban areas, could support sustained annual growth of 15–20% in own-source revenue.
Enhance Capacity Building and Incentives Offer targeted technical and financial support to underperforming LGAs while introducing performance-based incentives—such as increased autonomy or matching grants—for those demonstrating strong collection improvements.
Link Revenue to Local Economic Growth Promote investments in sector-specific opportunities (e.g., agriculture processing, tourism, and small-scale industries) to organically expand the taxable base and generate higher local returns.
Establish Clear Policy Targets Set ambitious yet realistic medium-term goals, such as progressively raising the own-source share to 10–15%, to provide a measurable roadmap for shifting project financing toward locally determined priorities.
In conclusion, while absolute own-source revenue has shown impressive growth and recent trends are promising, true economic self-reliance demands accelerating the own-source share well beyond the current low single digits. Without comprehensive reforms to address volatility, administrative gaps, and narrow revenue bases, LGAs will continue to face limited fiscal space. The upward trajectory since 2020 demonstrates potential, but only deliberate policy action will close the gap and enable LGAs to finance local development more independently and effectively.
An Assessment Based on Revenue-Expenditure Trends (2000–2025)
Analysis of fiscal data from 2000 to 2025 reveals that Tanzania cannot yet fully self-finance its development agenda without external support. Despite significant improvements in domestic revenue mobilization, persistent structural deficits indicate continued dependence on donor financing and concessional loans to bridge the gap between revenues and expenditures.
Persistent Fiscal Deficits
Tanzania has recorded fiscal deficits in 24 out of 26 years between 2000 and 2025, demonstrating that domestic revenues have consistently fallen short of total government expenditure. In the early 2000s, revenues covered only 58–70% of expenditure, creating financing gaps of 30–40% that required external grants, concessional loans, and domestic borrowing. For instance, in 2000, the government collected TZS 859 billion against expenditure of TZS 1,283 billion, resulting in a deficit of TZS 424 billion.
Although revenue performance has improved substantially over the past two decades, the structural imbalance persists. By 2024, total revenue had increased to TZS 33.9 trillion, yet expenditure expanded even faster to TZS 39.9 trillion, producing a record deficit of TZS 6.1 trillion. In recent years, revenues have covered only 84–87% of expenditure on average, meaning that 13–16% of government spending remains unfunded by domestic resources.
The 2018 Anomaly
The only year in which Tanzania achieved full fiscal self-sufficiency was 2018, when a surplus of TZS 853 billion was recorded and revenue coverage reached 105%. However, this outcome proved temporary and non-recurring. Deficits re-emerged immediately afterward due to renewed spending pressures and external shocks, including the COVID-19 pandemic period, demonstrating that the surplus was not indicative of a sustainable structural shift.
2025 Outlook
Preliminary data for January–September 2025 reinforces the conclusion of continued fiscal dependence. Within nine months, the government recorded revenue of TZS 26.3 trillion against expenditure of TZS 31.3 trillion, generating a deficit of TZS 5.0 trillion. Annualized projections indicate that Tanzania will continue to rely on external financing and borrowing to sustain both development projects and recurrent obligations.
Based on current revenue and expenditure dynamics, Tanzania cannot yet fully operate and implement large-scale development projects without external donor support. While domestic revenues—largely driven by tax collections—have grown impressively and now finance the majority of government spending, they remain insufficient to close the fiscal gap consistently. Donor financing, concessional loans, and external support continue to play a critical complementary role, particularly in infrastructure, social services, and development financing.
Tanzania is moving toward greater fiscal self-reliance, but achieving full independence from donor funding will require further expansion of the tax base, improved revenue administration efficiency, tighter expenditure prioritization, and sustained economic growth. Until these structural reforms fully materialize, external support will remain an integral component of financing Tanzania's development agenda. Read More: Overview of Government Budgetary Operations (October 2025)
Historical Analysis of Tanzania's Government Budgetary Operations (2000–2025)
The attached document provides calendar-year data on Tanzania's central government finances (in billions TZS), with deficit/surplus calculated as Total Revenue minus Total Expenditure (before grants and financing). Note that the "Total Expenditure" column shows negative values, so actual expenditure is the absolute value (e.g., -17,037 in 2018 means expenditure of 17,037 billion TZS).
Key trends:
Persistent Budget Deficits: In 24 out of 26 years (2000–2025), revenues fell short of expenditures, resulting in deficits. The only surplus occurred in 2018 (+853 billion TZS). Deficits indicate reliance on external grants, domestic borrowing, or foreign loans to bridge the gap.
Revenue Coverage of Expenditure (Revenue as % of Expenditure): This measures how well revenues "closed the budget gap."
Early 2000s: Low coverage, often 60–70% (e.g., 2000: 66.9%; 2004: 58.1%).
Mid-2000s to early 2010s: Remained low, dipping to ~62% in 2010.
Improvement from mid-2010s: Rose to 80–90% range.
2017: 91.2%
2018: 105% (surplus)
2020: 91.7% (strong during early COVID period)
Recent years: Stabilized at ~84–87% (2021–2024 average ~85.7%)
Absolute Deficit Growth: Deficits widened over time due to expanding government spending on infrastructure, education, and social programs.
2000: -424 billion TZS
2010: -3,162 billion
2024 peak: -6,053 billion
2025 partial: -4,991 billion (likely higher if annualized)
Revenue Growth: Strong in many years (average ~18% in high-growth periods like 2006–2007), driven largely by tax revenue (typically 80–90% of total revenue). However, expenditure often grew faster, widening gaps.
Overall Insight: Revenues have progressively covered a larger share of expenditures (from ~60% average in 2000–2010 to ~85–90% in 2020–2024), reflecting improved tax collection and economic growth. However, full coverage remains elusive except in 2018, creating a structural fiscal gap of 10–40% historically (narrower recently).
This gap represents the unfunded portion of the budget, typically financed through debt, leading to rising public debt obligations over time.
Addressing the Budget Gap: Recommended Actions
The persistent deficit is a common challenge in developing economies like Tanzania, driven by ambitious development spending outpacing revenue growth. If left unaddressed, it risks higher debt servicing costs, inflation, or reduced fiscal space for emergencies.
Key recommendations to close the gap:
Boost Domestic Revenue Mobilization:
Strengthen tax administration (e.g., via Tanzania Revenue Authority digitalization, reducing evasion, and broadening the tax base).
Minimize tax exemptions and incentives that erode collections.
Introduce fair, progressive reforms (e.g., property taxes, digital economy taxation) without stifling growth.
Target: Raise tax-to-GDP ratio (historically ~11–13%) toward 15%+ as seen in peer economies.
Improve Expenditure Efficiency:
Prioritize high-impact development projects (infrastructure, education, health) over lower-priority recurrent spending.
Conduct regular audits to curb waste, corruption, and leakage.
Shift toward performance-based budgeting.
Promote Economic Growth and Diversification:
Attract private investment (FDI) in sectors like mining, tourism, manufacturing, and agriculture to expand the taxable base.
Support SME growth and formalization.
Prudent Debt Management:
Favor concessional borrowing and limit commercial debt.
Build fiscal buffers during good years.
Institutional Reforms:
Enhance transparency and public participation in budgeting.
Align with medium-term fiscal frameworks (as Tanzania has done in recent plans).
These steps, if implemented consistently, could achieve sustained surpluses or near-balance, as briefly seen in 2018.
Outlook for 2026 Amid Current Political Situation
Tanzania's fiscal year runs July–June, so calendar 2026 spans the second half of FY 2025/26 and the first half of FY 2026/27.
Aims to reduce fiscal deficit to ~3.0% of GDP (from 3.4% in 2024/25), with tax revenue rising to 13.3% of GDP.
Supported by projected 6%+ economic growth and macro stability (per IMF and government projections).
Positive Factors for 2026:
Continued infrastructure push and reforms could support revenue if growth holds.
IMF forecasts contained deficits (~2.8–3.0% of GDP) into 2026–2027.
However, the current political situation (as of December 2025) poses significant risks:
The October 2025 general election saw President Samia Suluhu Hassan (CCM) re-elected with ~97–98% of votes, but results were widely disputed.
Opposition candidates faced exclusions, leading to post-election protests and a severe government crackdown (reports of hundreds killed, widespread arrests).
Ongoing tensions include banned protests, heavy security deployments, internet restrictions, and international criticism (UN, Human Rights Watch, Amnesty, potential aid reviews by US/West).
This instability could:
Deter investors and tourism.
Disrupt economic activity.
Lead to aid/grant suspensions.
Increase security-related spending.
Cause revenue shortfalls if growth slows.
Expectation for 2026: Official targets suggest a continued narrowing of the deficit (toward 2–3% of GDP) if stability returns and reforms proceed. However, prolonged political turbulence risks higher deficits (potentially wider gaps), slower growth, and strained financing. Much depends on de-escalation and inclusive dialogue in early 2026. Monitoring sources like the Ministry of Finance, Bank of Tanzania, and IMF updates will be key.
Financial data from 2000 to 2025 (in billions TZS)
Year
Total Revenue
Tax Revenue
Total Expenditure
Deficit/Surplus
Revenue Growth
2000
859
734
-1,283
-424
N/A
2001
1,047
893
-1,286
-239
21.9%
2002
1,166
1,032
-1,598
-433
11.4%
2003
1,336
1,154
-2,068
-732
14.6%
2004
1,638
1,458
-2,818
-1,179
22.6%
2005
1,943
1,708
-2,976
-1,032
18.6%
2006
2,459
2,109
-3,599
-1,140
26.5%
2007
3,245
2,859
-4,376
-1,132
32.0%
2008
4,013
3,675
-5,747
-1,734
23.7%
2009
4,408
4,078
-7,190
-2,782
9.8%
2010
5,102
4,686
-8,264
-3,162
15.8%
2011
6,436
5,738
-9,732
-3,296
26.1%
2012
7,927
6,995
-11,190
-3,262
23.2%
2013
9,236
7,966
-12,318
-3,082
16.5%
2014
10,924
9,537
-13,881
-2,957
18.3%
2015
13,441
11,715
-17,245
-3,804
23.0%
2016
14,210
13,759
-17,343
-3,134
5.7%
2017
16,479
13,801
-18,071
-1,592
16.0%
2018
17,889
14,763
-17,037
853
8.6%
2019
18,961
16,326
-21,078
-2,117
6.0%
2020
20,275
17,279
-22,119
-1,844
6.9%
2021
23,313
19,074
-27,121
-3,808
15.0%
2022
27,921
22,725
-31,943
-4,022
19.8%
2023
28,454
23,750
-33,653
-5,199
1.9%
2024
33,888
28,077
-39,940
-6,053
19.1%
2025
26,332
22,028
-31,323
-4,991
-22.3%
Note: All values in billions TZS. 2025 data includes Jan-Sep only (9 months). Deficit/Surplus = Revenue - Expenditure (before grants and financing).
By Dr. Bravious Felix Kahyoza PhD, FMVA CP3P, Email: braviouskahyoza5@gmail.com
Just after sunrise, when the light begins to stretch across the roofs of Dar es Salaam, the city feels like it’s already negotiating with the day ahead. Shop owners pull up their shutters, daladala conductors start calling out routes, and the early hum of business begins long before the formal sector signs in.
It’s in these small morning rituals that you can sense how deeply the country depends on its entrepreneurs, formal and informal, to keep the economy alive. And yet, beneath this bustle sits a quiet tension: businesses trying to stay afloat in a tightening fiscal climate, and a government under pressure to raise more domestic revenue without crushing the very engine it needs for growth.
President Samia’s acknowledgment that Tanzania’s borrowing space has narrowed was received with a mix of relief and anxiety. Relief, because it was honest; anxiety, because it confirmed what many suspected.
The domestic debt stock has grown rapidly, averaging double-digit annual increases, and banks have been steering more credit toward government securities than private lending. Private sector credit is stuck around 16–17 percent of GDP, far below the levels seen in countries that have broken into upper-middle-income status.
When the government announced its plan to raise domestic revenue to 16.7 percent of GDP in 2025/26, many business owners wondered quietly how much of that burden would fall on them.
Yet the country can’t ignore the numbers. The CCM Manifesto’s first implementation phase carries a price tag of Sh 477 trillion, four times the previous cycle. Vision 2050, which imagines Tanzania as a trillion-dollar economy, isn’t built on slogans; it needs infrastructure, energy, modern agriculture, digital systems, and competitive industries.
All of that requires money, and with global financing tightening, domestic collection becomes the unavoidable frontier. But the challenge, and this is where the debate becomes human rather than technical, is figuring out how to raise that revenue without squeezing businesses until they break.
Spend a morning walking through Kariakoo or Samora Avenue and you’ll hear business owners talk about costs rising faster than sales. Electricity tariffs pinch their margins; new taxes, even when justified in theory, feel heavy when cash flow is thin; and bank loans remain out of reach for many.
The 10 percent tax on retained earnings, for instance, was meant to increase fairness and close loopholes, yet some firms quietly admit it makes them think twice about expanding or hiring. Small and medium enterprises, which make up more than 90 percent of Tanzania’s businesses, often feel these changes more sharply than anyone writing policy anticipates.
And yet, from the government’s side, the view is equally complicated. September 2025 revenue collection reached 87.2 percent of targets, not terrible, but not enough. Budget execution has hovered around 72 percent, especially for development spending, which limits how much progress can be made on the ground.
Exemptions have cost the country hundreds of billions in potential revenue over the years. The decision to remove the 10-year income tax holiday for Export Processing Zones selling locally wasn’t just political; it was a response to an imbalance that had tilted for too long.
The difficulty is that both sides, the state and the business community, are telling the truth from where they sit. The question becomes how to bridge these truths, not pit them against each other.
One place where this balancing act is beginning to show promise is through more targeted incentives rather than blanket holidays. For example, accelerated depreciation for machinery, or tax credits tied to reinvestment, can soften the impact of the retained-earnings tax without weakening the overall revenue base.
When firms reinvest in equipment or training, productivity rises, and the state benefits later through higher VAT, PAYE, and corporate tax. That kind of long-view thinking is what many economists argue Tanzania needs now.
Digital revenue systems are another area reshaping the landscape. The expansion of e-invoicing and real-time verification hasn’t been universally celebrated; some traders complain about the learning curve, but the long-term benefits are hard to dispute.
Faster processing times, fewer physical audits, and a reduction in arbitrary enforcement make it easier for businesses to plan. The TRA’s own data shows a noticeable bump in compliance when digital tools replace manual processes. And businesses, especially mid-sized ones, often say they’d rather deal with a predictable system than a maze of officers whose interpretations vary.
The third arena where the balance becomes clearer is in public-private partnerships. Tanzania’s infrastructure ambitions, ports, railways, power systems, and industrial parks are simply too large for the public purse alone. Private capital is not a luxury; it has become a necessity.
When a firm operates a toll road and pays concession fees, the government earns revenue without borrowing. When energy companies partner on transmission lines or gas processing, the state gains both revenue and technological expertise.
And when mining firms contribute through production-sharing arrangements or royalties, typically around 16 percent, the country receives a steady stream of income without assuming operational risk.
What often gets overlooked is how these partnerships filter back into daily life. A more reliable transmission line reduces power outages for factories; a port operating at global standards cuts shipping costs for traders; an upgraded rural water system frees families from hours spent collecting water, boosting productivity indirectly. These aren’t abstract gains; they ripple across multiple layers of the economy.
Still, none of this works without trust. And trust is built through fairness in enforcement. When the government focuses on chronic large-scale evaders rather than the small shop struggling to stay afloat, businesses notice.
When the state offers reasonable windows for compliance or structured settlement plans, firms are more willing to cooperate. SMEs, in particular, respond better to support than punishment. The idea of pairing enforcement with education, through business clinics, youth-focused tax training, or digital-literacy programs, creates compliance rooted in understanding rather than fear.
There’s also the emerging conversation around youth-led enterprises, which are growing quickly in tech, creative industries, and agri-processing. Offering them modest tax breaks or startup-friendly compliance tools is less about generosity and more about strategy. A vibrant young business sector widens the future tax base, distributes economic opportunity, and reduces dependence on a narrow set of large taxpayers.
All these shifts, digital reforms, strategic incentives, PPPs, and compliance education form a pathway through the country’s current fiscal crossroads. And while none offer a magic solution, together they shape a more balanced approach than relying solely on new taxes or sharp spending cuts.
You can sense the stakes in the way people talk in markets, factories, and offices. Business owners want to grow; they simply don’t want to feel punished for trying. Government officials want to fund development; they want businesses to meet them halfway.
Somewhere between those needs lies the possibility of a more mature economic relationship, one that sees the private sector not as a target but as a partner, and the government not as an adversary but as an enabler of long-term prosperity.
If Tanzania can deepen that relationship, the country stands a far better chance of turning today’s fiscal pressure into tomorrow’s growth story. The path won’t be tidy, and there will be missteps, but the direction matters.
And right now, the direction points toward collaboration rather than confrontation, toward shared responsibility rather than suspicion, and toward a future where business vitality and government revenue rise together rather than at each other’s expense.
Tanzania’s income tax revenue increased from TZS 6,725 billion in 2020 to a projected 10,600 billion in 2025, marking a 57% rise over five years. Its share of tax revenue strengthened from 39.7% (2020) to 45.6% (2025 YTD), and as a share of total revenue, it climbed from 30.8% to 34.9%, showing growing dependence on income tax for fiscal stability. Growth was uneven, with a 3.5% drop in 2021 due to COVID-19, followed by strong rebounds—17.6% (2022), 10.6% (2023), and 27.4% (2024). Monthly data shows predictable peaks in March, June, and December, which together generate about 40% of annual collections (e.g., 2024 peak months averaged TZS 1.27 trillion vs 896B monthly overall).
However, as of November 29, 2025, political unrest and market shutdowns have begun to disrupt tax flows. The 2026 baseline projection of TZS 12.5–13 trillion is now adjusted downward to 11.0–11.5 trillion, implying a 10–15% loss driven by business closures, lower PAYE from job cuts, enforcement challenges, and donor funding suspensions. Income tax’s share of total tax revenue could fall back to 43–45%, while its burden on total revenue may rise to 37–39% as grants shrink, intensifying fiscal pressure. Read More: Tanzania Government Revenue at 87.2% of Target, Spending at 71.9%
Key Data Breakdown
Annual Income Tax Revenue Totals (in Billions TZS)
Year
Income Tax Revenue
Total Tax Revenue
Total Revenue
Income Tax as % of Tax Revenue
Income Tax as % of Total Revenue
2020
6,725
16,960
21,828
39.7%
30.8%
2021
6,492
16,543
23,013
39.2%
28.2%
2022
7,636
20,401
27,921
37.4%
27.4%
2023
8,443
21,541
29,454
39.2%
28.7%
2024
10,758
24,258
32,492
44.4%
33.1%
2025 (Jan-Sep)
8,829
19,339
25,331
45.6%
34.9%
Trends: Collections dipped in 2021 amid COVID lockdowns but surged 27.4% in 2024, outpacing total revenue growth. 2025 YTD projects ~10.6T TZS annually (20.3% growth), with income tax now >45% of taxes—boosted by formal employment (e.g., services sector).
Year-on-Year Growth Analysis
Period
Income Tax Growth (%)
Total Tax Growth (%)
Total Revenue Growth (%)
2020-2021
-3.5%
-2.5%
+5.4%
2021-2022
+17.6%
+23.3%
+21.3%
2022-2023
+10.6%
+5.6%
+5.5%
2023-2024
+27.4%
+12.6%
+10.3%
2024-2025*
+20.3% (projected)
+18.0% (projected)
+12.5% (projected)
*2025: Annualized from Jan-Sep.
Details: Post-2021 recovery tied to e-filing (up 30% compliance) and mining royalties integration. 2024's spike reflects GDP rebound (~6%) and anti-evasion drives.
Monthly Income Tax Collection Patterns (Average by Year, in Billions TZS)
Month
2020
2021
2022
2023
2024
2025 (Jan-Sep Avg)
January
457
352
560
525
591
678
February
416
358
469
426
558
676
March
736
674
812
978
1,038
1,280
April
421
342
408
416
575
625
May
341
346
402
458
659
721
June
1,012
759
1,000
975
1,233
1,442
July
385
442
394
518
592
795
August
352
471
451
487
503
1,355
September
595
780
817
989
1,144
-
October
378
502
453
510
582
-
November
329
470
445
512
629
-
December
1,019
1,202
1,263
1,411
1,574
-
Average Monthly Collections by Year (in Billions TZS)
Year
Average Monthly
Key Peaks (March/June/Dec Avg)
2020
560
922
2021
541
878
2022
636
1,025
2023
704
1,121
2024
896
1,275
2025
981 (9m avg)
1,349 (Jan-Sep)
Seasonal Patterns: Consistent peaks in March (Q1 filings), June (fiscal year-end), and December (annual settlements), accounting for ~40% of yearly totals. Off-peaks (e.g., Jan-Feb) show 30-50% drops, highlighting cashflow risks.
What This Tells Us About Tanzania's Economic Development (2020-2025)
Income tax trends mirror a formalizing economy transitioning from aid-dependency to domestic resource mobilization, fueling Vision 2025 goals like industrialization and diversification.
COVID Shock and Dip (2020-2021): -3.5% decline in 2021 (despite +5.4% total revenue from grants) reflected job losses in formal sectors (tourism down 60%), but stable 28-31% revenue share preserved fiscal buffers for recovery spending.
Rebound and Formalization (2022-2024): 17-27% growth aligned with GDP surges (4-6%), driven by PAYE from ~1M new formal jobs (services/mining) and corporate taxes from gold exports (+20% YoY). Rising share (to 44.4% of taxes) signals broadening base—e.g., digital platforms taxing gig economy—supporting infrastructure (roads/ports) and poverty reduction (extreme poverty down to 18%).
2025 Momentum: 20% projected growth (YTD 45.6% of taxes) underscores resilience, with August's 1,355B TZS spike from mid-year audits. This has enabled debt service coverage (4.9x in 2024) while funding social nets.
Key Economic Development Takeaways:
Positive: Income tax's expansion (from 6.5T to ~10.6T TZS) reflects ~5% avg. GDP growth, enhancing sovereignty (taxes now 75% of revenue vs. 60% in 2020) and investments in human capital/energy.
Challenges: Seasonality amplifies volatility; over-reliance on peaks risks shortfalls if enforcement lapses, constraining capex amid 33% revenue share.
Impact of 2025 Political Challenges on Tanzania's Income Tax Revenue in 2026
The escalating post-election crisis in Tanzania—now in its second month since the October 29, 2025, polls—continues to erode the country's economic stability, with President Samia Suluhu Hassan's disputed victory (97.66%) fueling deadly protests, over 2,000 arrests, and international aid freezes. As of November 29, 2025, opposition calls for a December 9 "D9" nationwide protest signal potential further disruptions, including internet shutdowns and curfews, amid vows of a "national catastrophe." This volatility directly threatens income tax revenue, which rebounded to ~10.6T TZS in 2025 (projected, 45% of taxes) via formal sector growth but remains sensitive to business activity and compliance. Donors like the EU have suspended ~60B TZS in grants, indirectly pressuring tax mobilization, while unrest has already emptied markets and stalled trade. Below, I outline 2026 impacts, adjusting the document's 18-23% baseline growth for a 10-15% overall shortfall from disruptions.
Summary Table of Projected Impacts on Income Tax Revenue (in Billions TZS, Annual)
Aspect
2025 Actual (Annualized)
Baseline 2026 Projection (Pre-Unrest)
Adjusted 2026 Projection (Post-Unrest)
Key Impact Drivers
Total Income Tax Revenue
10,600
12,500-13,000 (+18-23%)
11,000-11,500 (-10-15% from baseline)
Business closures; investor flight
% of Total Tax Revenue
45-46%
46-47%
43-45% (decline in share)
Evasion rise; enforcement strains
% of Total Revenue
34-35%
35-36%
37-39% (higher burden)
Grant shortfalls; overall revenue dip
Annual Growth Rate
+20.3%
+18-23%
+8-12% (capped)
Formal job losses; compliance drops
Average Monthly Collection
981
1,040-1,080
920-960 (-8-10%)
Seasonal peaks disrupted
Notes: Baselines extrapolate document trends (e.g., 20% 2025 growth). Adjustments incorporate 5-10% GDP hit from unrest (e.g., tourism/mining slumps), per regional analyses projecting jeopardized 6% growth. Peaks (March/June/Dec) could fall 15-25%.
Detailed Impacts on Income Tax Revenue
Disruptions to Collection Patterns and Seasonality Income tax relies on quarterly/annual filings, with ~40% from peaks in March (Q1 reports), June (fiscal year-end), and December (settlements). Planned D9 protests on December 9 could trigger shutdowns and violence, slashing Q4 2025/early 2026 collections by 15-25% (~200-400B TZS in December alone), as seen in post-vote market shutdowns in Dar es Salaam. Off-peak months (Jan-Feb, Jul-Aug) may drop 10-15% due to ongoing curfews and transport halts, flattening averages to 920-960B TZS. Border disruptions (e.g., with Malawi/Kenya) already strand trucks, delaying corporate imports/taxes.
Formal Sector Erosion and Tax Base Shrinkage The 27.4% 2024 surge stemmed from PAYE (personal taxes from ~1M formal jobs) and corporate profits in mining/tourism/services. Unrest has fueled youth unemployment discontent, with protests emptying townships like Manzese and deterring FDI (down 15-20%). Tourism—key for high-income earners—faces UK/US advisories on cash/fuel shortages, potentially cutting 10-15% of PAYE base. Mining firms may defer expansions, reducing corporate taxes by 8-12%; overall, this caps growth at 8-12%, trimming totals to 11-11.5T TZS and dropping the tax revenue share to 43-45%.
Enforcement and Compliance Challenges Tanzania Revenue Authority (TRA) e-filing drove 2025 gains, but resource diversions to security (budget +10%) weaken audits, risking 5-10% evasion spikes amid economic despair. Opposition detentions (e.g., activists like Mika Chivala on treason charges) and media censorship stifle anti-corruption drives, while inflation (5.2%) from supply hits erodes real collections. The EU's November 28 aid freeze (~€150M) removes governance-linked grants (10% of revenue), forcing tax hikes that could backfire on compliance if perceived as unfair.
Regional and Broader Economic Spillovers Kenya reports "direct impacts" on East African trade, with investor confidence shaken—long-term, this could shave 0.5-1% off GDP, indirectly hitting taxable incomes. Remittances (target $1.5B by 2028) may dip 5-10% from diaspora fears, further pressuring the 35% revenue benchmark.
Broader Economic Development Implications for 2026
These revenue shortfalls (~1-1.5T TZS gap) exacerbate fiscal stress, projecting 3-4% GDP growth (vs. 5-6%) and straining debt service (20.6% of revenue in 2024). Formalization efforts stall, widening inequality and hindering Vision 2025 diversification. If D9 escalates into sustained unrest, Q1 2026 could see 20% quarterly drops, triggering austerity that crowds out infrastructure. Positively, President Hassan's November 14 probe vow and AU mediation could restore ~$500M in aid by mid-2026, boosting collections 5-7% if stability returns.
Mitigation Pathways: Enhance digital collections for resilience; offer amnesties to curb evasion; and prioritize dialogue to avert D9 violence—e.g., releasing prisoners like Jennifer Jovin. Without reforms, income tax's momentum reverses, risking a "lost year" for development.
The July 2025 government budgetary operations from the Bank of Tanzania's Monthly Economic Review (September 2025) reveal a robust fiscal start to the fiscal year, with revenues surpassing targets by 3% amid controlled expenditures. This performance—revenues at TZS 2,911.6 billion (103% of target) and expenditures at TZS 4,006.2 billion—results in a monthly deficit of approximately TZS 1,094.6 billion (about 38% of revenues), but aligns with the annual budget's emphasis on growth-oriented spending. In the broader context of the attached document, this supports Q3 2025 GDP growth estimates above 6%, low inflation (3.4%), and export-driven stability (e.g., gold and tourism inflows). As of October 2025, Tanzania's FY 2024/25 closed with 5.6% GDP growth and a narrowing current account deficit to 2.5% of GDP, per IMF assessments, positioning the country for 6% growth in FY 2025/26 through enhanced domestic revenue mobilization and public investments. These trends imply fiscal resilience, enabling infrastructure and social spending to drive inclusive development, though high recurrent costs (59% of outlays) highlight needs for efficiency to sustain debt sustainability (domestic debt at ~35% of GDP).
Drawing from recent analyses, such as the World Bank's emphasis on Vision 2050 for upper-middle-income status by 2050 and the African Development Bank's projection of 6% growth fueled by agriculture and tourism, the data signals a pro-growth fiscal stance. However, global risks like elevated fertilizer prices (Chart 1.5) could pressure import taxes if unmitigated.
1. Central Government Revenue
Total revenue (including LGAs):TZS 2,911.6 billion (103% of target).
Central government revenue:TZS 2,592.7 billion
Tax revenue:TZS 2,345.8 billion
Taxes on imports: TZS 958.8 billion
Income taxes: TZS 795.9 billion
VAT & excise on local goods/services: TZS 446.1 billion
Other taxes: TZS 347.3 billion
Non-tax revenue:TZS 246.8 billion
Local Government Authorities (LGA) own sources:TZS 133.9 billion
Other goods, services & transfers: TZS 607.7 billion
Development expenditure:TZS 1,634.4 billion
Domestically financed: TZS 1,261.2 billion
Foreign financed: TZS 373.2 billion.
Table: Central Government Revenue and Expenditure – July 2025 (TZS Billion)
Category
Amount (TZS Bn)
Revenue (including LGAs)
2,911.6
Central Government Revenue
2,592.7
– Tax Revenue
2,345.8
—— Taxes on Imports
958.8
—— Income Taxes
795.9
—— VAT & Excise (Local Goods/Services)
446.1
—— Other Taxes
347.3
– Non-tax Revenue
246.8
LGA Own Sources
133.9
Expenditure (Total)
4,006.2
Recurrent Expenditure
2,371.8
– Wages & Salaries
900.8
– Interest Payments
378.4
—— Domestic
277.7
—— Foreign
100.8
– Other Goods, Services & Transfers
607.7
Development Expenditure
1,634.4
– Domestic Financing
1,261.2
– Foreign Financing
373.2
Implications for Tanzania's Economic Development
1. Central Government Revenue: Strong Collections Signal Economic Momentum and Tax Efficiency
Key Observations Recap: Total revenues (including LGAs) reached TZS 2,911.6 billion (103% target), driven by tax revenue (TZS 2,345.8 billion, or 90% of central total), with imports (TZS 958.8 billion) and income taxes (TZS 795.9 billion) leading. Non-tax added TZS 246.8 billion, and LGA own sources TZS 133.9 billion.
Implications for Economic Development:
Boost to Fiscal Capacity and Growth Financing: Exceeding targets reflects vibrant trade activity, amplified by TZS appreciation (6.6% in August) and export surges (e.g., gold up 35.5% y-o-y to USD 4.32 billion). This provides buffers for the FY 2025/26 budget's TZS 51.1 trillion target, focusing on agriculture (30% of GDP) and industry to achieve 6% growth. The KPMG Budget Brief notes increased domestic revenue (aiming for 16.5% of GDP) will fund inclusive measures like low-income support, potentially lifting 1-2 million from poverty.
Enhanced Tax Base and Private Sector Vitality: High import and income taxes indicate formalization gains from 16.2% private credit growth (document), supporting MSMEs (36% of credit). IMF's 2025 Article IV praises this for narrowing deficits, fostering FDI in mining and services.
Risks: Reliance on imports (41% of tax revenue) exposes to global shocks; diversification via non-tax (e.g., tourism) is key, as per Deloitte's East Africa Outlook.
Reflects job creation in trade/agriculture, supporting 6% GDP target.
Total Tax Revenue
2,345.8
90%
Builds reserves (USD 6.2 bn), per AfDB, for infrastructure resilience.
2. Central Government Expenditure: Balanced Allocation Prioritizes Development Amid Recurrent Pressures
Key Observations Recap: Total outlays TZS 4,006.2 billion, with recurrent at TZS 2,371.8 billion (59%, including TZS 900.8 billion wages and TZS 378.4 billion interest) and development at TZS 1,634.4 billion (41%, 77% domestically financed).
Implications for Economic Development:
Investment-Led Growth Acceleration: Significant development spending (TZS 1,634.4 billion) aligns with the document's construction credit rise (14.8%), funding projects like hydropower and ports to sustain 6%+ expansion. Domestic financing dominance (TZS 1,261.2 billion) reduces external vulnerability, as highlighted in SECO's 2025 Economic Report, which credits public investments for 5.6% FY 2024/25 growth.
Social Stability and Debt Management: Recurrent focus on wages (23% of total) supports public sector employment (amid 5.5% unemployment), while interest payments (9.4%, 73% domestic) remain sustainable at ~20% of revenues. The Taylor & Francis study on fiscal policy notes this mix drives structural transformation, with transfers (TZS 607.7 billion) aiding vulnerable groups.
Risks: Recurrent dominance risks crowding out (e.g., vs. private credit), per World Bank; foreign financing (TZS 373.2 billion) ties to aid flows, vulnerable to global tightening.
Expenditure Category
July 2025 Amount (TZS Bn)
% of Total
Implication for Development
Wages & Salaries
900.8
22%
Bolsters consumption, contributing to 4.9% goods inflation stability.
Development (Domestic)
1,261.2
31%
Fuels infrastructure, targeting 6% growth per KPMG.
Interest Payments
378.4
9%
Sustainable at 35% GDP debt, enabling fiscal space for reforms.
Overall Summary and Forward Outlook
July's budgetary outcomes imply a fiscally prudent yet expansionary path for Tanzania's development: over-target revenues fund balanced spending, reinforcing 6% growth projections while anchoring inflation. This builds on FY 2024/25's 5.6% performance and supports Vision 2050 goals, with domestic focus mitigating external risks. Compared to EAC peers (e.g., Kenya's wider deficits), Tanzania's metrics highlight strength. Into Q4 2025, sustained export inflows could trim the annual deficit to 4% of GDP (IMF estimate), but reforms for recurrent efficiency—e.g., digital tax systems—will be crucial to unlock 7% medium-term potential.
Tanzania’s National Development Vision 2050 (Dira ya Taifa ya Maendeleo 2050) aims to transform the nation into a prosperous, equitable, and self-reliant middle-income economy by 2050, targeting a GDP of $1 trillion and a per capita income of $7,000 (Vision 2050). A cornerstone of this ambition is a fair, efficient, and predictable tax system to finance critical investments in infrastructure, health, and education. Despite progress, with the tax-to-GDP ratio rising from 10.8% in 2000 to 11.7% in 2020 (World Bank), challenges such as a large informal sector (40–50% of GDP), tax evasion, and over-reliance on indirect taxes persist. This analysis examines Tanzania’s tax system evolution, current state, future aspirations, and fiscal hurdles to achieving Vision 2050’s goals.
The Foundation: Understanding Tanzania's Tax Evolution
Historical Context: Where We Come From
Tanzania’s tax system has evolved significantly since independence in 1961. Key historical milestones include:
Post-Independence and Arusha Declaration (1967): The adoption of the Arusha Declaration emphasized socialism and self-reliance, leading to a tax system focused on mobilizing resources for public services and combating poverty, ignorance, and disease. The tax regime was heavily centralized, with limited private sector involvement, which constrained revenue generation due to a narrow tax base.
Economic Reforms (1980s–1990s): Structural adjustment programs introduced market-oriented reforms, including tax policy changes to encourage private investment. The reintroduction of a multi-party system in 1992 and subsequent governance reforms aimed to enhance transparency and accountability in tax administration.
Tax Revenue Trends (2000–2020): Between 2000 and 2020, Tanzania improved its tax-to-GDP ratio, though it remained below the Sub-Saharan Africa average. For instance, the tax-to-GDP ratio increased from approximately 10.8% in 2000 to 11.7% in 2020 (World Bank data). However, challenges such as tax evasion, a large informal sector, and inefficiencies in tax collection persisted.
Key Achievements: The establishment of the Tanzania Revenue Authority (TRA) in 1996 improved tax administration, leading to increased domestic revenue mobilization. By 2020, Tanzania achieved lower-middle-income status, partly due to improved fiscal policies, with per capita income rising from $453 in 2000 to $1,277 in 2023 (Vision 2050).
Current Status: Where We Are
As of 2025, Tanzania’s tax system has made notable strides but faces structural and operational challenges:
Tax-to-GDP Ratio: The tax-to-GDP ratio is approximately 11.7% (World Bank, 2020), significantly lower than the Sub-Saharan Africa average of 16.5% and far below the 15–20% target often recommended for sustainable development. This reflects a narrow tax base, with heavy reliance on indirect taxes like VAT (approximately 40% of total revenue) and limited contributions from personal and corporate income taxes.
Tax Administration Improvements: The TRA has implemented digital platforms, such as electronic tax filing and payment systems, improving compliance and reducing administrative costs. The Vision 2050 highlights efforts to create a predictable and transparent tax system to encourage compliance and simplify business registration.
Informal Sector Challenges: The informal sector, which accounts for about 40–50% of GDP (International Labour Organization estimates), remains largely untaxed, limiting revenue potential. Efforts to integrate the informal sector into the tax net, such as simplified tax regimes for small businesses, are ongoing but face resistance due to high compliance costs and low tax literacy.
Revenue Composition: In 2023/24, domestic revenue was approximately TZS 27.4 trillion ($10.2 billion), with taxes contributing 86% of this amount (Tanzania Budget Speech 2023/24). However, reliance on a few large taxpayers and volatile revenue sources, such as mining royalties, poses risks to fiscal stability.
Public Debt Management: The Vision 2050 notes that Tanzania’s national debt remains sustainable, as confirmed by international financial institutions. However, efficient debt management and equitable tax policies are critical to maintaining fiscal stability.
Vision 2050 Aspirations: Where We Are Headed
The Vision 2050 outlines ambitious goals for Tanzania’s tax system to support a strong, inclusive, and competitive economy by 2050.
Key objectives and expectations related to taxation include:
Fair and Efficient Tax System: The vision aims for a tax system that is equitable, efficient, and predictable, promoting voluntary compliance and fostering business growth. The goal is to increase the tax-to-GDP ratio to support a high-income economy with a GDP of $1 trillion and per capita income of $7,000 by 2050.
Revenue Mobilization: The vision emphasizes increasing the tax-to-GDP ratio through a broader tax base, improved tax administration, and reduced tax evasion. This will finance priority sectors such as infrastructure, energy, and social services.
Digital Tax Systems: By 2050, over 50% of government services are expected to be delivered digitally, with 70% of citizens possessing ICT skills. This includes digital tax platforms to enhance transparency, reduce compliance costs, and integrate the informal sector.
Support for Key Sectors: The vision identifies agriculture, tourism, manufacturing, construction, mining, and financial services as key sectors for economic transformation. Tax incentives and simplified regimes are proposed to stimulate investment and job creation in these sectors.
Sustainable Development Financing: The vision emphasizes mobilizing domestic resources to reduce reliance on external aid, aligning with the goal of a self-reliant nation. This includes leveraging carbon credit markets and climate finance to support environmental sustainability.
Fiscal Challenges in Achieving Vision 2050
Achieving the Vision 2050 goals for taxation will face several fiscal challenges, as outlined below:
a) Narrow Tax Base and Informal Sector
Challenge: The large informal sector (40–50% of GDP) limits revenue collection due to low tax compliance and high administrative costs. The Vision 2050 document highlights efforts to integrate informal workers into social protection and tax systems, but resistance persists due to low tax literacy and perceived high compliance costs.
Impact: A narrow tax base restricts revenue growth, with the tax-to-GDP ratio stagnating below 12%. This limits funding for critical investments in infrastructure, health, and education.
Mitigation: Simplify tax regimes for small and medium enterprises (SMEs), enhance tax education, and leverage digital platforms to register and tax informal businesses. For example, mobile money taxation has shown success in capturing informal transactions.
b) Tax Evasion and Illicit Financial Flows
Challenge: Tax evasion, particularly in the mining and trade sectors, and illicit financial flows cost Tanzania billions annually. The OECD estimates that illicit financial flows in Africa amount to $50–80 billion yearly, with Tanzania losing significant revenue due to transfer pricing and underreporting.
Impact: Revenue losses undermine fiscal sustainability and the ability to finance Vision 2050 goals, such as achieving a $1 trillion GDP.
Mitigation: Strengthen anti-evasion measures through international cooperation (e.g., OECD’s Base Erosion and Profit Shifting framework), improve tax audits, and enhance transparency in extractive industries via the Extractive Industries Transparency Initiative (EITI).
c) Over-Reliance on Indirect Taxes
Challenge: Heavy reliance on VAT and excise duties (over 60% of tax revenue) disproportionately burdens low-income households, exacerbating inequality. The Vision 2050 document calls for a fair tax system but does not specify reforms to reduce regressive taxation.
Impact: Regressive taxes hinder the vision’s goal of inclusive growth and poverty eradication.
Mitigation: Expand progressive taxes, such as personal and corporate income taxes, and introduce wealth or property taxes to ensure equitable revenue distribution.
d) Administrative and Technological Constraints
Challenge: Despite progress in digital tax systems, rural areas face limited internet access and low ICT literacy, hindering digital tax compliance. Additionally, the TRA faces capacity constraints in auditing and enforcement.
Impact: Inefficient tax administration reduces revenue collection efficiency and delays the goal of 50% digital government services by 2050.
Mitigation: Invest in rural digital infrastructure, train tax officials, and adopt emerging technologies like blockchain for transparent tax collection.
e) Economic Volatility and External Shocks
Challenge: Tanzania’s economy is vulnerable to external shocks, such as commodity price fluctuations (e.g., mining royalties) and climate change impacts, which affect agricultural productivity and tax revenue. The vision’s reliance on sectors like agriculture and tourism increases this vulnerability.
Impact: Revenue volatility threatens fiscal stability and the ability to fund long-term investments.
Mitigation: Diversify revenue sources by promoting manufacturing and financial services, and establish a stabilization fund to cushion against economic shocks.
f) Policy and Regulatory Inconsistencies
Challenge: Frequent policy changes and complex regulatory frameworks create uncertainty for businesses, discouraging investment and tax compliance. The vision aims for predictable policies but acknowledges past inconsistencies.
Impact: Unpredictable tax policies deter foreign direct investment (FDI), critical for achieving the $1 trillion GDP target.
Mitigation: Streamline tax regulations, reduce unnecessary levies, and establish a clear policy framework to enhance investor confidence.
g) High Public Debt and Expenditure Pressures
Challenge: While public debt is sustainable, increasing expenditure demands for infrastructure, health, and education could strain fiscal resources. The debt-to-GDP ratio was 41.7% in 2023 (IMF data), and rising debt servicing costs could limit development spending.
Impact: High debt servicing reduces fiscal space for Vision 2050 investments, risking delays in achieving goals like poverty eradication.
Mitigation: Optimize public expenditure, prioritize high-impact projects, and enhance domestic revenue mobilization to reduce borrowing needs.
Conclusion and Recommendations
Tanzania’s Vision 2050 provides a clear framework for transforming the tax system into a fair, efficient, and predictable mechanism to support a high-income, inclusive economy by 2050. While significant progress has been made since independence, challenges such as a narrow tax base, tax evasion, and administrative inefficiencies persist. To overcome these fiscal challenges and achieve the vision’s goals, the following recommendations are proposed:
Broaden the Tax Base: Implement simplified tax regimes for the informal sector and leverage digital platforms to enhance compliance, targeting a tax-to-GDP ratio of at least 20% by 2050.
Combat Tax Evasion: Strengthen TRA’s capacity through advanced auditing technologies and international cooperation to curb illicit financial flows.
Promote Progressive Taxation: Shift from regressive indirect taxes to progressive taxes, such as income and property taxes, to ensure equitable revenue distribution.
Enhance Digital Tax Systems: Invest in rural digital infrastructure and ICT training to achieve the 70% digital literacy target and streamline tax administration.
Diversify Revenue Sources: Reduce reliance on volatile sectors like mining by promoting manufacturing and financial services through tax incentives.
Ensure Policy Stability: Establish a consistent tax policy framework to boost investor confidence and support FDI inflows.
Strengthen Debt Management: Prioritize high-impact projects and enhance domestic revenue to reduce reliance on borrowing.
Below is a table summarizing key figures related to Tanzania’s tax system in the context of the National Development Vision 2050, highlighting historical, current, and projected data, as well as fiscal challenges.
Metric
Historical (2000)
Current (2020–2023)
Vision 2050 Target
Tax-to-GDP Ratio
10.8%
11.7% (2020)
~20% (implied)
Per Capita Income
$453
$1,277 (2023)
$7,000
GDP
-
~$75.7 billion (2023)
$1 trillion
Informal Sector Contribution to GDP
~40–50%
~40–50% (2023)
Reduced (implied)
Domestic Revenue
-
TZS 27.4 trillion ($10.2 billion, 2023/24)
Increased (implied)
Tax Contribution to Domestic Revenue
-
86% (2023/24)
Increased (implied)
VAT Contribution to Tax Revenue
-
~40% (2020)
Reduced reliance
Debt-to-GDP Ratio
-
41.7% (2023)
Sustainable level
ICT Literacy Rate
-
-
70% by 2050
Digital Government Services
-
-
>50% by 2050
Notes:
The tax-to-GDP ratio target of ~20% is inferred from the need to finance Vision 2050’s ambitious goals, such as infrastructure and social services, though not explicitly stated.
The informal sector’s contribution to GDP remains significant, posing a challenge to tax base expansion.
The Vision 2050 document emphasizes digital tax systems and reduced reliance on indirect taxes like VAT to achieve a fairer tax system.
External data from the World Bank, IMF, and ILO provide context for historical and current figures, while Vision 2050 targets.
In 2024/2025, Tanzania’s TZS 49.35 trillion budget achieved 5.5% real GDP growth, collecting TZS 45.07 trillion (89.6% of target) and spending TZS 15.75 trillion on development, including TZS 1.68 trillion for SGR and TZS 574.8 billion for rural electrification. Social investments like TZS 444.7 billion for fee-free education and TZS 708.6 billion in fertilizer subsidies supported low-income citizens, reducing costs and improving access.
The TZS 56.49 trillion 2025/2026 budget, an 11.6% increase, targets 6.0% growth by raising domestic revenue to TZS 38.9 trillion (16.7% of GDP) and allocating TZS 16.4 trillion for development, prioritizing agriculture, industry, and services. Continued subsidies, education, and healthcare investments aim to further reduce poverty (8.0% extreme poverty in 2018) and enhance livelihoods for low-income Tanzanians.
The 2024/2025 budget, themed “Realising Competitiveness and Industrialisation for Human Development,” aimed to achieve 5.4% real GDP growth while prioritizing infrastructure, social services, and economic inclusion. Key performance highlights by May 2025:
Real GDP Growth: Achieved 5.5%, surpassing the 5.4% target, driven by agriculture (26.5% of GDP), construction (13.2%), and mining (9.0%).
Revenue Collection: Collected TZS 45.07 trillion (89.6% of TZS 50.29 trillion target), with domestic revenue at TZS 29.83 trillion (15.0% of GDP, up from 13.7% in 2020/2021) due to Tanzania Revenue Authority (TRA) reforms and mining contributions.
Expenditure: Disbursed TZS 42.90 trillion (85.3% of TZS 50.29 trillion), including TZS 30.63 trillion for recurrent expenditure (90.8%) and TZS 15.75 trillion for development (95.1%), with notable allocations of TZS 1.68 trillion for Standard Gauge Railway (SGR), TZS 1.58 trillion for roads/bridges, and TZS 574.8 billion for rural electrification.
Inflation: Maintained at 3.1% (within 3.0–5.0% target), ensuring affordability for low-income households.
Trade Balance: Deficit narrowed to USD 5,157.2 million from USD 6,032.3 million in 2023, with exports at 20.3% of GDP, driven by tourism (1.4 million visitors) and gold.
Social Spending: Allocated TZS 444.7 billion for fee-free education, TZS 636.0 billion for student loans, TZS 414.7 billion for healthcare supplies, and TZS 378.7 billion for water projects, directly benefiting low-income citizens.
Debt: Public debt at TZS 107.70 trillion (40.3% of GDP, below 55% threshold), with external debt at USD 32.89 billion by September 2024, indicating fiscal sustainability.
Impact on Low-Income Citizens:
Subsidies: TZS 708.6 billion for fertilizer subsidies (2021/22–2023/24) reduced farming costs by 50% per bag, boosting agricultural productivity for low-income farmers.
Fuel Subsidies: TZS 100 billion monthly in 2022 stabilized transport and commodity prices.
Social Services: Fee-free education and healthcare investments improved access, while rural electrification (TZS 574.8 billion) and water projects (TZS 378.7 billion) enhanced livelihoods and small business opportunities.
The 2025/2026 budget, themed “Inclusive Economic Transformation through Domestic Resource Mobilization and Resilient Strategic Investment for Job Creation and Improved Livelihoods,” represents an 11.6% increase from TZS 49.35 trillion in 2024/2025. It aims to achieve 6.0% real GDP growth, with a budget deficit of 3.0% of GDP, and prioritizes agriculture, industry, services, and social inclusion.
Key Financial Structure:
Total Budget: TZS 56.49 trillion (USD 22.07 billion at TZS 2,560/USD, inferred from exchange rate context).
Revenue Projections:
Domestic revenue: TZS 38.9 trillion (16.7% of GDP, up from 15.8% in 2024/2025), with TRA targeting TZS 29.41 trillion (13.3% of GDP).
External sources: TZS 16.02 trillion, including TZS 1.02 trillion in aid, TZS 5.6 trillion in concessional loans, and TZS 9.4 trillion in commercial loans.
Expenditure:
Recurrent: TZS 38.6 trillion (68.3% of budget) for wages, debt servicing, and elections.
Development: TZS 16.4 trillion (29.0% of budget) for strategic projects (e.g., SGR, Julius Nyerere Hydropower Project [JNHPP]).
Sectoral Allocations (partial, from web sources):
Tourism: TZS 359.9 billion for promotion, infrastructure, and conservation ().
Energy: TZS 2.2 trillion for power generation, rural electrification, and oil/gas infrastructure.
Macroeconomic Targets (Budget Speech):
Real GDP growth: 6.0% in 2025, up from 5.5% in 2024.
Inflation: 3.0–5.0% to maintain affordability.
Domestic revenue: 16.7% of GDP to reduce borrowing reliance.
Foreign exchange reserves: ≥4 months of imports (4.4 months in 2024).
Sector-Specific Contributions to Economic Growth (2025/2026)
The 2025/2026 budget focuses on agriculture, industry, and services to drive 6.0% GDP growth, with specific measures to support low-income Tanzanians, building on 2024/2025 outcomes.
a. Agriculture
2024/2025 Performance:
Contributed 26.5% to GDP, employing ~65% of the workforce.
Construction (13.2% of GDP) and mining (9.0%) drove growth via TZS 1.68 trillion for SGR, TZS 1.58 trillion for roads, and TZS 574.8 billion for JNHPP/rural electrification.
Mining revenue rose due to reforms and global demand (e.g., gold).
Investment-to-GDP ratio at 37.1% supported industrial expansion.
2025/2026 Budget Priorities:
Completion of SGR and JNHPP (2,115 MW) to reduce logistics/energy costs.
TZS 2.2 trillion for energy projects, including rural electrification and gas infrastructure.
Support for National Development Corporation (NDC) and Small Industries Development Organization (SIDO) to expand manufacturing.
Projected Impact:
Industry could contribute 1.5–2.0 percentage points to GDP growth (assuming 7–8% sectoral growth, ~20% GDP share).
Cheaper energy (JNHPP) and import substitution reduce business costs, lowering prices for consumers.
c. Services (Tourism, Transport, Trade, ICT)
2024/2025 Performance:
Services contributed ~40–50% to GDP, with exports at 20.3% of GDP, led by tourism (USD 7.2 billion from 1.4 million visitors) and transport.
ICT grew at 12.5%, driven by digital infrastructure.
Current account deficit narrowed to -2.6% of GDP due to tourism receipts.
2025/2026 Budget Priorities:
TZS 359.9 billion for tourism promotion, infrastructure, and conservation.
Investments in Air Tanzania (ATCL), ports (TPA), and SGR to enhance trade and transport.
ICT expansion (13.5% growth projected by 2026) via digital services and mobile penetration.
Projected Impact:
Services could contribute 2.5–3.0 percentage points to GDP growth (assuming 6–7% sectoral growth).
Tourism and transport jobs (e.g., hospitality, logistics) are accessible to low-income workers.
Reduced transport costs (SGR) and digital access lower prices and improve livelihoods.
Support for Low-Income Tanzanians
The 2025/2026 budget emphasizes inclusive growth to address poverty (26.4% abject poverty, 8.0% extreme poverty in 2018):
Education: Sustained or increased funding for fee-free education (TZS 444.7 billion in 2024/2025) and student loans (TZS 636.0 billion) to enhance access and skills for low-income households.
Healthcare: Investments in universal health insurance, medicines (TZS 414.7 billion in 2024/2025), and facilities (TZS 47.2 billion) reduce healthcare costs.
Subsidies: Likely continuation of fertilizer (TZS 708.6 billion historically) and fuel subsidies to lower farming and transport costs.
Water and Energy: Expanded water projects (TZS 378.7 billion in 2024/2025) and rural electrification (TZS 2.2 trillion energy budget) support small businesses and living standards.
Social Safety Nets: Productive Social Safety Nets (PSSN) cash transfers reduce malnutrition and poverty, with plans for expansion.
Job Creation: Infrastructure (SGR, JNHPP) and SIDO programs create jobs and support entrepreneurship for low-income groups.
Projected Impact: These measures could reduce extreme poverty below 8.0% by improving incomes, access to services, and affordability, aligning with the Third Five-Year Development Plan (FYDP III) goal of 8 million jobs by 2026.
Fiscal and Macroeconomic Stability
Revenue: Domestic revenue target of TZS 38.9 trillion (16.7% of GDP) reduces reliance on external loans (TZS 16.02 trillion, 28.4% of budget).
Debt: Public debt at 46.5% of GDP (2024, projected to remain sustainable) and external debt at USD 34.1 billion (March 2025) support fiscal stability.
Inflation: Target of 3.0–5.0% protects low-income purchasing power, despite currency depreciation risks (TZS 2,585/USD in 2024).
Trade: Exports projected to grow by 6.0% in 2025 (minerals, agriculture, tourism), narrowing the trade deficit (USD 5,157.2 million in 2024) and stabilizing reserves (USD 5.7 billion).
Projected Performance of 2025/2026 Budget
The 2025/2026 budget is poised to achieve 6.0% GDP growth if:
Revenue Targets Are Met: Exceeding TZS 38.9 trillion (16.7% of GDP) enables robust development spending (TZS 16.4 trillion).
Strategic Projects Advance: Completion of SGR and JNHPP reduces costs, boosting productivity.
Global Conditions Support Exports: Stable commodity prices and tourism demand (TZS 359.9 billion allocation) drive growth.
Inclusive Policies Succeed: Subsidies, social spending, and job creation uplift low-income productivity.
Comparative Budget Performance:
2024/2025: TZS 49.35 trillion achieved 5.5% growth despite revenue shortfalls (89.6% of TZS 50.29 trillion), with strong social spending (e.g., TZS 444.7 billion for education) supporting low-income citizens.
2025/2026: TZS 56.49 trillion (11.6% increase) targets 6.0% growth with higher domestic revenue (16.7% vs. 15.0% of GDP) and development spending (TZS 16.4 trillion vs. TZS 15.75 trillion), enhancing inclusivity via sustained subsidies and services.
Challenges:
Revenue Risks: TRA’s 2024/2025 shortfall (89.6%) and ongoing tax administration issues may persist.
External Pressures: Currency depreciation (TZS 2,585/USD) and global shocks could raise import costs.
Implementation: Delays in projects (e.g., SGR) could limit growth impact.
Tanzania’s Budget and Economic Performance: Key Figures (2024–2026)
Indicator
2024/2025 Performance
2025/2026 Projection
Impact on Low-Income Citizens
Total Budget
TZS 49.35 trillion (USD 18.85 billion)
TZS 56.49 trillion (USD 22.07 billion)
Larger budget funds more social services, jobs.
Real GDP Growth
5.5% (target: 5.4%)
6.0% (targeted)
Higher growth creates employment opportunities.
Domestic Revenue
TZS 29.83 trillion (15.0% of GDP)
TZS 38.9 trillion (16.7% of GDP)
Increased revenue supports subsidies, education.
Revenue Collection
TZS 45.07 trillion (89.6% of TZS 50.29 trillion)
>TZS 50.29 trillion (targeted)
Funds development projects benefiting communities.