Comprehensive Analysis of Tanzania's TZS 61.9 Trillion Budget Framework
Tanzania's proposed TZS 61.9–61.93 trillion national budget for FY 2026/27 marks the largest fiscal framework in the country's history and represents a 9.6% increase from the TZS 56.49 trillion approved for FY 2025/26—effectively mirroring the government's stated objective of a "10% budget increase." This expansion, while substantial, is not unprecedented: it follows a 12.3% increase in 2025/26 and reflects Tanzania's consistent growth-oriented fiscal policy.
The expansion comes at a time when Tanzania's economic fundamentals show notable resilience. In 2025, Mainland GDP grew by 5.9%, exceeding earlier projections and supported by strong sectoral performance across mining (+19%), tourism (+21–22%), and construction. Inflation remained controlled at 3.5%, well within the Bank of Tanzania's 3–5% target band, while nominal GDP reached approximately USD 87.44 billion (TZS 235 trillion), reflecting robust nominal growth of 10.3% year-over-year.
A defining feature of the 2026/27 budget is its financing structure, which signals a strategic shift toward domestic resource mobilization rather than debt accumulation. Domestic revenue is projected to rise by 20% to TZS 46.69 trillion, increasing its share of total budget funding from 71.6% to 75.4%—the highest level in recent years. Meanwhile, borrowing levels remain stable at approximately TZS 15–15.5 trillion, representing only a marginal 1.6% increase from the previous year. This revenue-led growth is further supported by tax revenue expanding 26.5% to TZS 36.9 trillion, driven by improved tax administration and formalization efforts by the Tanzania Revenue Authority (TRA).
Debt sustainability indicators further reinforce the feasibility of the expansion. Tanzania's public debt-to-GDP ratio stands at 40.6%, well below the commonly used 55% risk threshold for developing economies and the 60% threshold for emerging markets. Moreover, this ratio is on a declining trajectory, aided by strong nominal GDP growth (10–12% annually) and a strategic prioritization of concessional borrowing over commercial debt—factors that help keep debt servicing costs manageable even as the budget expands.
Looking ahead, medium-term growth projections strengthen the case for sustainability. GDP growth is forecast to reach 6.3% in 2026 and average nearly 6.9% between 2026 and 2029, driven by large-scale infrastructure projects including the Julius Nyerere Hydropower Project (JNHP), Standard Gauge Railway (SGR) expansion, and accelerating LNG exploration. These investments, combined with sectoral diversification and a focus on industrialization under Tanzania's Fifth Development Plan (FYDP IV), position the economy for sustained expansion.
However, sustainability is not guaranteed and depends on effective risk management. Declining development partner grants (down 44.8% to TZS 563.1 billion), climate-related shocks affecting agriculture (which contributes 26% of GDP and employs 65% of the workforce), and post-election political tensions following the disputed 2025 elections pose potential headwinds. Global commodity price volatility and external economic conditions also add layers of uncertainty.
In sum, the proposed 10% budget expansion is occurring in a context of solid growth, rising domestic revenue capacity, controlled inflation, and manageable debt levels. The central issue, therefore, is not whether Tanzania can afford the expansion, but whether the government can maintain this growth trajectory while managing external risks and ensuring that fiscal resources are deployed efficiently toward productive investments that drive long-term economic transformation.
Tanzania has proposed a record TZS 61.9–61.93 trillion budget for FY 2026/27, representing a 9.6% increase from TZS 56.49 trillion in 2025/26—effectively matching the government's stated 10% expansion target. This analysis evaluates whether this budget increase is realistic, sustainable, and aligned with Tanzania's economic performance and medium-term fiscal capacity.
The proposed 2026/27 budget at TZS 61.9–61.93T is essentially a 10% increase, differing by only TZS 170-200 billion from the hypothetical TZS 62.14T target (10% above 2025/26's TZS 56.49T). This precision suggests the budget aligns closely with official fiscal guidelines.
| Fiscal Year | Budget (TZS Trillion) | % Change | GDP Growth | Key Notes |
|---|---|---|---|---|
| 2024/2025 | 50.29 | — | 5.5% | Baseline pre-election |
| 2025/2026 | 56.49 | +12.3% | 6.0–6.1% | Infrastructure focus, elections |
| 2026/2027 (Proposed) | 61.9–61.93 | +9.6% | 6.3% (Projected) | Record high, largest budget ever |
| 10% Increase Target | ~62.14 | +10.0% | — | Almost identical to proposal |
Three-year budget trajectory showing consistent expansion aligned with economic growth
Annual percentage changes demonstrating controlled fiscal expansion
The budget trajectory reflects Tanzania's commitment to maintaining an expansionary fiscal stance while adapting to economic realities. The 2025/26 budget saw a sharp 12.3% increase to accommodate election-related expenditures and accelerated infrastructure development. The 2026/27 proposal moderates this growth to 9.6%, a rate that is more sustainable and closely aligned with projected economic expansion.
This near-perfect alignment with the 10% target is not coincidental. It demonstrates the Ministry of Finance's adherence to medium-term fiscal planning frameworks that balance growth ambitions with macroeconomic stability. The consistency also signals predictability to investors and development partners, reducing uncertainty in Tanzania's fiscal policy direction.
Budget increase funded 78% by domestic revenue growth, 22% by stable borrowing. Domestic revenue share rose from 71.6% to 75.4%—highest in 4+ years, reducing dependence on external financing and strengthening fiscal sovereignty.
The 2026/27 budget marks a significant milestone in Tanzania's fiscal independence. Unlike previous years where external borrowing played a larger role, this budget expansion is predominantly financed through enhanced domestic revenue mobilization. Tax revenue collections are projected to surge by 26.5% to TZS 36.9 trillion, reflecting the Tanzania Revenue Authority's (TRA) success in expanding the tax base, improving compliance, and digitalizing revenue collection systems.
| Revenue Source | 2025/2026 | 2026/2027 | Change |
|---|---|---|---|
| Domestic Revenue | TZS 38.9T (71.6% share) | TZS 46.69T (75.4% share) | +20.0% |
| ↳ Tax Revenue (TRA) | TZS 29.17 trillion | TZS 36.9 trillion | +26.5% |
| ↳ Other Revenues | TZS 9.73 trillion | TZS 9.24 trillion | -5.0% |
| Grants from Partners | TZS 1.02 trillion | TZS 563.1 billion | -44.8% |
| Total Borrowing | TZS 15.0 trillion | TZS 15.24 trillion (24.6% share) | +1.6% |
| ↳ Development Projects | — | TZS 7.4 trillion | — |
| ↳ Debt Repayment | — | TZS 7.8 trillion | — |
Shift toward domestic revenue demonstrates enhanced fiscal sovereignty and reduced external dependency
Tax revenue expansion (+26.5%) drives overall domestic revenue growth, compensating for grant reductions
Rising to 75.4%, marking the highest domestic revenue contribution in recent fiscal history
This revenue-led growth strategy offers several advantages. First, it reduces vulnerability to external shocks such as changes in development partner priorities or global financial conditions. Second, it demonstrates Tanzania's growing economic maturity and capacity to finance its own development agenda. Third, it provides greater fiscal flexibility and policy autonomy, allowing the government to align spending with national priorities rather than donor conditionalities.
The 44.8% decline in development partner grants (from TZS 1.02 trillion to TZS 563.1 billion) is notable and may reflect international concerns over governance issues, particularly following the contested 2025 elections. However, the government's ability to compensate for this decline through enhanced domestic revenue collection demonstrates resilience and adaptability in fiscal planning.
Critically, borrowing levels remain essentially flat at TZS 15.24 trillion (up only 1.6%), representing just 24.6% of the total budget. This borrowing allocation is strategically divided between development projects (TZS 7.4 trillion) and debt repayment (TZS 7.8 trillion), ensuring that new borrowing does not lead to unsustainable debt accumulation while continuing to fund critical infrastructure investments.
Tanzania's economy demonstrated robust performance in 2025, with GDP growth of 5.9% exceeding projections, inflation controlled at 3.5%, and strong sectoral gains across mining (+19%), tourism (+21-22%), and construction. This solid foundation supports the 2026/27 budget expansion.
| Economic Indicator | 2025 Performance | Context/Notes |
|---|---|---|
| Real GDP Growth (Mainland) | 5.9% | Exceeded 5.5–6.0% target range |
| Nominal GDP | USD 87.44B (~TZS 235T) | +10.3% YoY nominal growth |
| Inflation Rate | 3.5% average | Within 3–5% target band |
| Mining Sector Growth | +19% | Driven by gold, graphite, gemstones |
| Tourism Sector Growth | +21–22% | 1.8M arrivals, USD 3.8B receipts |
| Forex Reserves | >USD 6.3 billion | 4.9 months of import cover |
| Private Credit Growth | +20.3% | Strong business expansion signal |
| Fiscal Balance (estimated) | Revenue TZS 25.8T (15.2% GDP) | Deficit 5.2% of GDP; sustainable |
Consistent growth trajectory with 2025 exceeding target projections
Broad-based economic expansion across multiple high-performing sectors
Inflation within target band and strong forex reserves demonstrate macroeconomic stability
Tanzania's 5.9% GDP growth in 2025 represents a significant achievement, particularly in a year marked by political uncertainty due to contested elections. The growth was broad-based, with multiple sectors contributing positively. The mining sector's 19% expansion was driven by increased gold production, graphite exports, and gemstone mining, benefiting from favorable global commodity prices and continued investment in exploration and processing.
The tourism sector's remarkable 21-22% growth, with 1.8 million international arrivals and USD 3.8 billion in receipts, demonstrates Tanzania's growing competitiveness as a premier safari and beach destination. This recovery and expansion beyond pre-pandemic levels reflects successful marketing campaigns, improved infrastructure (particularly in national parks), and increased flight connectivity.
Inflation control at 3.5% is particularly noteworthy given global inflationary pressures in 2024-2025. The Bank of Tanzania's prudent monetary policy, combined with good agricultural harvests and stable food prices, kept inflation within the 3-5% target band. This price stability supports purchasing power and creates a favorable environment for business planning and investment.
Foreign exchange reserves exceeding USD 6.3 billion (equivalent to 4.9 months of import cover) provide a substantial buffer against external shocks. This reserve position, well above the IMF's recommended minimum of 3 months, indicates that Tanzania has the capacity to manage balance of payments fluctuations and maintain exchange rate stability.
The 20.3% growth in private sector credit signals strong business confidence and expansion. This credit growth, significantly higher than nominal GDP growth, suggests that businesses are investing in capacity expansion, working capital, and new ventures—all positive indicators for sustained economic momentum in 2026 and beyond.
Nominal GDP growth (~10–12% including inflation) substantially exceeds the ~10% budget increase, ensuring fiscal sustainability. Budget-to-GDP ratio remains stable or improves, demonstrating that the fiscal expansion is well-aligned with economic capacity.
| Period/Year | GDP Growth Rate | Key Growth Drivers |
|---|---|---|
| 2025 (Actual) | 5.9% | Mining, tourism, construction, agriculture |
| 2026 (Projection) | 6.3% | LNG exploration, SGR expansion, JNHP impact |
| 2026–2029 Average | ~6.9% | LNG, industrialization, Vision 2050 alignment |
Accelerating growth trajectory driven by major infrastructure and industrial investments
Nominal GDP growth (10-12%) comfortably exceeds budget growth (~10%), ensuring fiscal sustainability
Stable or declining ratio demonstrates fiscal prudence despite budget expansion
Tanzania's medium-term growth outlook is anchored by several transformational mega-projects that are expected to significantly expand productive capacity and economic output. The Julius Nyerere Hydropower Project (JNHP), upon completion, will add 2,115 MW of electricity generation capacity—nearly doubling Tanzania's current installed capacity. This reliable and affordable power supply will unlock industrial expansion, reduce energy costs, and attract energy-intensive manufacturing investments.
The Standard Gauge Railway (SGR) expansion is progressively connecting Tanzania's economic centers with regional neighbors and ports, dramatically reducing transportation costs and transit times. Current phases link Dar es Salaam to Morogoro and are extending to Dodoma and beyond. Upon full completion, the SGR network will facilitate more efficient movement of goods (particularly agricultural products and minerals), reduce logistics costs by an estimated 40-60%, and integrate Tanzania more deeply into regional value chains.
Perhaps most transformational is Liquefied Natural Gas (LNG) development. Tanzania possesses over 57 trillion cubic feet of proven natural gas reserves, primarily offshore in the Indian Ocean. Major energy companies including Shell, Equinor, and ExxonMobil have exploration licenses and are advancing feasibility studies for LNG export facilities. If investments materialize as projected, LNG operations could begin generating substantial revenues by 2028-2029, fundamentally transforming Tanzania's fiscal landscape and export profile.
The government's Fifth Development Plan (FYDP IV), aligned with Vision 2050, emphasizes industrialization, value addition, and economic diversification. Targets include increasing manufacturing's share of GDP from ~7% to 15% by 2030, expanding agro-processing to reduce raw export dependency, and developing special economic zones (SEZs) focused on textiles, leather, pharmaceuticals, and electronics assembly. These initiatives, supported by improved infrastructure and business environment reforms, are designed to create higher-value economic activities and employment.
Critically, the 6.3% real GDP growth projection for 2026, rising to an average of 6.9% for 2026-2029, translates to approximately 10-12% nominal GDP growth when inflation (projected at 3-5%) is included. This nominal growth rate exceeds the 10% budget increase, meaning the budget-to-GDP ratio remains stable or even declines. This is the fundamental reason the fiscal expansion is sustainable: the economy is growing faster than government spending, preventing unsustainable fiscal imbalances.
JNHP adding 2,115 MW capacity
SGR expansion reducing logistics costs
57 TCF reserves, exports by 2028-29
Manufacturing target: 7% → 15% of GDP
Value addition to agricultural exports
EAC and AfCFTA market access
Tanzania's public debt-to-GDP ratio of 40.6% remains well below the 55% risk threshold for developing economies. Borrowing levels are stable at TZS 15–15.5 trillion annually, with a strategic focus on concessional financing that minimizes debt servicing costs.
Debt sustainability is a critical consideration when evaluating fiscal expansion. Tanzania's debt position reflects prudent management and strategic borrowing practices. The 40.6% debt-to-GDP ratio is not only below international risk thresholds but is also on a declining trajectory due to faster nominal GDP growth relative to debt accumulation. This provides Tanzania with significant fiscal space for continued infrastructure investment while maintaining macroeconomic stability.
| Debt Indicator | Current Status | Sustainability Assessment |
|---|---|---|
| Public Debt-to-GDP Ratio | 40.6% (2025) | ✓ Well below 55% threshold; declining |
| Annual Borrowing Level | TZS 15–15.5T (medium-term avg) | ✓ Stable; not escalating |
| Shift to Domestic Revenue | 71.6% → 75.4% of budget | ✓ Reduces external risk |
| Concessional Borrowing Focus | Prioritized in medium-term plan | ✓ Lower debt servicing costs |
| Deficit Target (recent years) | ~3% of GDP (targeted) | ✓ Fiscally prudent; manageable |
Tanzania's 40.6% debt-to-GDP ratio provides substantial buffer below risk thresholds
Declining trajectory demonstrates improving fiscal sustainability despite budget expansion
Stable borrowing at TZS 15-15.5T annually, split between development and debt repayment
The government's shift toward concessional borrowing from multilateral development banks (World Bank, African Development Bank) and bilateral partners offers significantly lower interest rates (typically 1-3%) and longer repayment periods (25-40 years) compared to commercial debt. This strategy reduces the debt service burden as a percentage of revenue, preserving fiscal resources for development expenditure rather than interest payments.
Moreover, the deficit target of approximately 3% of GDP aligns with international best practices for developing economies. This moderate deficit level allows for continued public investment in infrastructure and social services while ensuring that debt accumulation does not outpace economic growth. The 2026/27 budget maintains this disciplined approach, with the fiscal deficit projected to remain within manageable bounds.
While Tanzania's fiscal outlook is positive, sustainability depends on managing both upside opportunities and downside risks. This section evaluates key positive factors, risk factors, and mitigation strategies.
5.9% growth in 2025 provides strong foundation for 6.3% target in 2026, with flagship projects (LNG, SGR, Julius Nyerere Hydropower) driving medium-term expansion toward 6.9% average.
Tax-to-GDP ratio rising toward 18% target through Medium-Term Revenue Strategy, reducing reliance on borrowing. Domestic revenue now funds 75.4% of budget, up from 71.6%.
Mining (+19%), tourism (+21–22%), construction, finance, and electricity sectors all performing strongly, reducing dependence on any single sector.
Government targets 70% private sector funding for development projects, reducing pressure on public finances while accelerating industrialization.
The disputed 2025 elections and subsequent political instability could deter foreign investment, disrupt tourism/trade, and undermine business confidence—jeopardizing growth and revenue targets.
Development partner grants declined 44.8% (TZS 1.02T → TZS 563.1B), potentially signaling international concern over governance and increasing fiscal pressure.
Agriculture contributes 26% of GDP and employs 65% of workforce. Climate variability (droughts, floods) could disrupt food production, affecting growth and inflation.
Heavy reliance on gold exports exposes Tanzania to international price fluctuations. Tourism also vulnerable to global economic downturns and security perceptions.
Balanced view of positive factors (green) versus risk factors (orange) facing the 2026/27 budget
The government's emphasis on domestic financing (75.4% of budget) reduces external vulnerability. Stable borrowing levels (TZS 15–15.5T annually) with prioritization of concessional loans minimizes debt service burden. Focus on private-sector-led development (70% of FYDP IV) leverages external capital without adding to public debt. Medium-term fiscal consolidation targets (~3% deficit-to-GDP) ensure macroeconomic stability.
75.4% budget funding from domestic sources reduces aid dependency
70% FYDP IV funding from private capital reduces fiscal burden
~3% deficit target maintains macroeconomic stability
Prioritizing low-cost multilateral loans over commercial debt
Based on comprehensive analysis of economic performance, financing structure, debt sustainability, and risk factors, the proposed TZS 61.9–61.93 trillion budget for FY 2026/27 representing a ~10% increase is both realistic and prudent.
| Assessment Criteria | Verdict |
|---|---|
| Economic Alignment | ✓ REALISTIC: Nominal GDP growth (~10–12%) exceeds budget growth (~10%), ensuring sustainable fiscal ratios. |
| Financing Strategy | ✓ PRUDENT: Increase funded primarily through domestic revenue mobilization (TZS 46.69T, +20%), not higher borrowing (+1.6%). |
| Debt Sustainability | ✓ SUSTAINABLE: Debt-to-GDP ratio at 40.6%, well below 55% threshold, with declining trajectory. Borrowing stable at TZS 15–15.5T. |
| Economic Performance | ✓ GROWTH-SUPPORTIVE: Strong 2025 baseline (5.9% growth, 3.5% inflation) supports accelerated 6.3% target for 2026, averaging 6.9% through 2029. |
| Policy Framework | ✓ ALIGNED: Budget matches official medium-term framework (avg ~TZS 68T/year, 2026/27–2028/29) and Vision 2025/2050 goals. |
| Risk Outlook | ⚠ MONITORED: Political tensions, aid reductions, climate/commodity volatility require vigilance, but mitigation strategies in place. |
Comprehensive evaluation across six key criteria demonstrates strong feasibility with manageable risks
The proposed TZS 61.9–61.93 trillion budget for FY 2026/27—effectively a ~10% increase from TZS 56.49 trillion—is both realistic and prudent. It is financed primarily through enhanced domestic revenue mobilization rather than debt escalation, supported by strong economic performance (5.9% growth in 2025), and aligned with medium-term growth projections (6.3% for 2026, averaging 6.9% through 2029).
Key sustainability factors include:
While risks exist—particularly post-election political tensions, aid reductions, and climate/commodity volatility—the government's emphasis on domestic financing, fiscal consolidation, and private-sector partnership (70% of FYDP IV) provides robust mitigation. The budget positions Tanzania to continue its trajectory toward Vision 2025/2050 goals while maintaining macroeconomic stability.
This budget represents continuity in Tanzania's expansionary fiscal stance, matching official guidelines almost exactly, and is growth-supportive without compromising debt sustainability.
Report prepared: February 3, 2026
Sources: Tanzania Ministry of Finance, Bank of Tanzania, IMF, World Bank, Reuters, Official Budget Guidelines
For more in-depth analysis of Tanzania's economy, business intelligence, and investment opportunities, explore our comprehensive resources and join our research community.
Comprehensive Assessment of TZS 128.4 Trillion Debt Position
Tanzania's national debt stock reached approximately TZS 128.4 trillion by the end of November 2025, reflecting a strategic development financing approach heavily anchored on external resources. This comprehensive analysis reveals a debt structure characterized by external dominance at 69.7% of the total, with domestic debt providing a crucial 30.3% stabilizing buffer against foreign exchange volatility.
The debt composition demonstrates the government's continued role as the primary borrower, with the public sector accounting for TZS 103.5 trillion (80.5%) of total obligations, while private sector debt stood at TZS 24.9 trillion (19.5%). This distribution underscores the central government's strategic focus on financing critical infrastructure, social services, and transformative investments essential for Tanzania's development trajectory.
Critically, the monthly debt growth rate of 0.4% signals controlled and sustainable accumulation, a positive indicator for fiscal stability and macroeconomic management. Despite the external-heavy debt structure, sustainability risks remain well-managed through robust foreign exchange reserves covering approximately 4.9 months of imports, an expanding domestic debt market, and prudent fiscal policies maintained by the Bank of Tanzania and Ministry of Finance.
Tanzania's debt position remains manageable and sustainable under current fiscal frameworks, with moderate growth rates, adequate reserve buffers, and development-oriented borrowing strategies supporting long-term economic growth objectives.
| Debt Category | Amount (TZS Trillion) | USD Equivalent | Percentage Share |
|---|---|---|---|
| External Debt | 90.0 | USD 36.1 billion | 69.7% |
| Domestic Debt | 38.4 | USD 15.4 billion | 30.3% |
| Total National Debt | 128.4 | USD 51.5 billion | 100.0% |
Tanzania's debt architecture reveals significant reliance on external financing sources, with nearly 70% of total obligations denominated in foreign currencies. This structure reflects the country's development financing strategy, where concessional loans and development partner financing play pivotal roles in funding large-scale infrastructure projects, including transportation networks, energy facilities, and social infrastructure.
The domestic debt component, while smaller, serves as a critical stabilizing mechanism. It reduces overall foreign exchange exposure, provides diversification in funding sources, and supports the development of local capital markets. The 30.3% domestic share offers important insulation against currency depreciation risks that could otherwise amplify debt servicing costs.
| Indicator | Value | Implication |
|---|---|---|
| Monthly Debt Growth | 0.4% | Controlled, sustainable pace |
| Dominant Component | External (69.7%) | Development-focused financing |
| FX Reserve Cover | 4.9 months | Strong external buffer |
| Exchange Rate | ~2,490 TZS/USD | Stable currency environment |
| Sector | Amount (TZS Trillion) | Percentage Share | Primary Purpose |
|---|---|---|---|
| Public Sector | 103.5 | 80.5% | Infrastructure, social services, strategic investments |
| Private Sector | 24.9 | 19.5% | Business expansion, trade finance, investments |
| Total National Debt | 128.4 | 100.0% | Combined development financing |
The public sector's commanding 80.5% share of national debt reflects Tanzania's development model, where government-led investment drives economic transformation. This concentration is consistent with comparable emerging economies pursuing infrastructure-intensive growth strategies, where public sector borrowing finances critical projects with high social returns but long payback periods.
Private sector debt at 19.5% represents borrowing by businesses, financial institutions, and individuals for commercial purposes. While significantly smaller than public debt, private sector external borrowing supports trade finance, business expansion, and private investment in productive sectors, complementing public sector development efforts.
| Sustainability Indicator | Current Status | Assessment | Risk Level |
|---|---|---|---|
| Debt Composition | External-heavy (69.7%) | FX exposure present | Medium |
| Domestic Debt Buffer | 30.3% of total | Reduces currency risk | Low |
| Monthly Growth Rate | 0.4% | Moderate, controlled | Low |
| FX Reserve Coverage | 4.9 months imports | Strong buffer | Low |
| Debt Purpose | Development-oriented | Growth-enhancing | Low |
Growing Domestic Market: Expanding local debt market provides alternative financing and reduces FX dependency
Adequate Reserves: 4.9 months of import cover significantly exceeds the 3-month adequacy threshold
Productive Investment: Debt financing infrastructure and services with long-term growth potential
Moderate Pace: 0.4% monthly growth indicates disciplined borrowing and debt management
Exchange Rate Volatility: TZS depreciation increases local currency debt service burden on external obligations
Global Interest Rates: Rising international rates affect borrowing costs and refinancing terms
Revenue Performance: Debt sustainability depends on continued strong domestic revenue mobilization
Economic Growth: Maintaining robust GDP growth essential for manageable debt-to-GDP ratios
Tanzania's debt sustainability outlook remains positive under current macroeconomic conditions and fiscal policies. The combination of moderate debt accumulation, productive use of borrowed funds, adequate reserve buffers, and growing domestic financing capacity creates a resilient debt management framework. However, continued vigilance on exchange rate movements, global financial conditions, and revenue performance is essential.
Tanzania's debt management approach balances development financing needs with fiscal sustainability objectives. The government, through the Ministry of Finance and Bank of Tanzania, employs several strategic mechanisms to maintain debt sustainability while funding critical national priorities.
The growth of Tanzania's domestic debt market from 30.3% of total debt represents a strategic achievement with multiple benefits. A deeper local capital market reduces vulnerability to external shocks, provides more flexible financing options, and supports broader financial sector development. The increasing participation of pension funds, insurance companies, and retail investors signals growing confidence in government securities.
Future debt strategy aims to gradually increase the domestic share to 40-45% over the medium term, further reducing foreign exchange exposure while supporting local financial market deepening. This transition requires continued macroeconomic stability, competitive domestic interest rates, and sustained investor confidence.
Understanding Tanzania's debt position requires context of the broader economy. With GDP estimated at approximately TZS 200-210 trillion in 2025, the debt-to-GDP ratio stands around 61-64%, a level considered manageable for a developing economy pursuing infrastructure-intensive growth.
| Economic Metric | Value | Implication for Debt |
|---|---|---|
| Nominal GDP (est.) | ~TZS 205 trillion | Growing denominator improves ratios |
| Debt-to-GDP Ratio | ~62-63% | Within sustainable range |
| GDP Growth Rate | 6.0-6.5% | Outpacing debt growth |
| Revenue-to-GDP | ~15-16% | Supports debt service capacity |
Tanzania's GDP growth consistently exceeding 6% provides crucial debt sustainability support. When economic growth outpaces debt accumulation, debt-to-GDP ratios naturally stabilize or decline over time, even with continued borrowing for development purposes. This dynamic creates fiscal space for strategic investments while maintaining macroeconomic stability.
The 4.9 months of import cover provided by foreign exchange reserves represents a critical strength in Tanzania's debt sustainability framework. This substantial buffer significantly exceeds the 3-month international adequacy standard, providing protection against external shocks and confidence to international creditors.
| Reserve Metric | Value | Assessment |
|---|---|---|
| Import Cover | 4.9 months | Well above 3-month adequacy threshold |
| Reserve Trend | Stable to growing | Strengthening external position |
| External Debt Ratio | 69.7% of total | Reserves provide servicing buffer |
| Currency Stability | Relatively stable TZS | Supports debt servicing capacity |
Strong reserve levels perform multiple functions: they enable smooth debt servicing on external obligations, provide confidence to foreign investors and creditors, support currency stability, and offer protection against unexpected external shocks such as commodity price swings or global financial turbulence.
Looking ahead, Tanzania's debt management success will depend on maintaining the prudent approach evident in current data while adapting to evolving economic circumstances and opportunities. Several strategic priorities emerge from this analysis:
Controlled Growth: 0.4% monthly pace demonstrates disciplined borrowing
Strong Reserves: 4.9 months import cover provides substantial buffer
Productive Use: Infrastructure focus supports long-term growth
Growing Domestic Market: Reducing FX dependency over time
Robust GDP Growth: 6%+ growth outpacing debt accumulation
The combination of prudent debt management, strong economic growth, adequate reserves, and strategic investment focus positions Tanzania well for sustainable development financing. Continued attention to these fundamentals, alongside adaptive responses to global economic conditions, will be essential for maintaining this positive trajectory.
Tanzania's national debt stock of TZS 128.4 trillion as of end-November 2025 reflects a deliberate development financing strategy that balances growth imperatives with fiscal sustainability. The external-dominated structure (69.7%) enables access to large-scale, concessional financing for transformative infrastructure, while the growing domestic component (30.3%) provides critical currency risk mitigation.
Several factors support a positive sustainability assessment. The moderate 0.4% monthly growth rate indicates disciplined borrowing aligned with absorptive capacity. Foreign exchange reserves covering 4.9 months of imports provide a robust external buffer well above international adequacy standards. The productive, development-oriented use of borrowed funds supports future revenue generation and economic growth that outpaces debt accumulation.
The public sector's 80.5% share of total debt reflects government-led development strategy common in infrastructure-intensive growth phases. This concentration, while creating fiscal obligations, finances critical assets with long-term economic and social returns—transportation networks, energy systems, social infrastructure, and economic facilities that enhance productivity and competitiveness.
Risks exist and require ongoing attention. The external-heavy structure creates vulnerability to exchange rate fluctuations, with TZS depreciation increasing local currency debt service costs. Global interest rate trends affect borrowing conditions and refinancing costs. Revenue performance must keep pace with debt service obligations to maintain fiscal balance.
However, these risks are actively managed through strategic debt policies, reserve accumulation, domestic market development, and prudent fiscal management. The expanding domestic debt market, improving revenue mobilization, strong economic growth, and careful project selection all contribute to sustainable debt dynamics.
Looking forward, maintaining this positive trajectory requires continued policy discipline, strategic borrowing focused on high-return investments, ongoing domestic market development, and adaptive responses to global economic conditions. With these elements in place, Tanzania's debt position supports rather than constrains development ambitions, providing financing for transformative investments while preserving macroeconomic stability.
Comprehensive Breakdown by Borrower, Currency & Usage
As of November 2025, Tanzania's external debt profile reveals a development-oriented structure predominantly driven by government borrowing. With total external debt standing at USD 36.1 billion, the central government accounts for USD 28.5 billion (78.9%), underscoring the critical role of public financing in infrastructure and social development projects. The debt composition shows significant USD exposure (66.8%), making exchange rate stability essential for sustainable debt management.
The borrower structure reveals overwhelming concentration in the central government, placing primary responsibility for debt management and repayment on public finances.
| Borrower Category | Amount (USD Million) | Percentage Share |
|---|---|---|
| Central Government | 28,528.1 | 78.9% |
| Private Sector | 7,040.8 | 19.5% |
| Public Corporations | 558.9 | 1.5% |
| Total External Debt | 36,127.8 | 100% |
The allocation of external funds demonstrates government-led development financing, with significant resources directed toward infrastructure and social services.
| User of Funds | Amount (USD Million) | Percentage Share |
|---|---|---|
| General Government | 27,922.7 | 77.3% |
| Non-Financial Private Sector | 6,109.4 | 16.9% |
| Financial Institutions | 2,095.7 | 5.8% |
| Total Disbursed Debt | 36,127.8 | 100% |
Currency composition reveals significant USD exposure with partial diversification across major international currencies.
| Currency | Amount (USD Million) | Percentage Share |
|---|---|---|
| US Dollar (USD) | 24,127.7 | 66.8% |
| Euro (EUR) | 6,333.6 | 17.5% |
| Japanese Yen (JPY) | 3,219.0 | 8.9% |
| Chinese Yuan (CNY) | 1,334.5 | 3.7% |
| Other Currencies | 1,112.9 | 3.1% |
| Total | 36,127.8 | 100% |
This external debt profile complements Tanzania's overall debt position, with total national debt standing at approximately USD 51.87 billion, indicating that external debt represents roughly 70% of total obligations. Key contextual factors include:
Tanzania's external debt structure appears manageable and development-oriented, provided that key conditions are maintained:
Tanzania's external debt profile as of November 2025 demonstrates a strategic, development-focused borrowing approach with total obligations of USD 36.1 billion. The structure—predominantly government-borrowed, government-used, and USD-denominated—supports essential infrastructure and social development while creating specific vulnerabilities that require careful management.
The path forward requires balancing development financing needs with prudent debt management, maintaining exchange rate stability through robust export performance, and ensuring borrowed funds generate productive returns. With continued fiscal discipline and strategic economic management overseen by the Bank of Tanzania, the current debt structure remains sustainable and supportive of Tanzania's long-term development objectives.
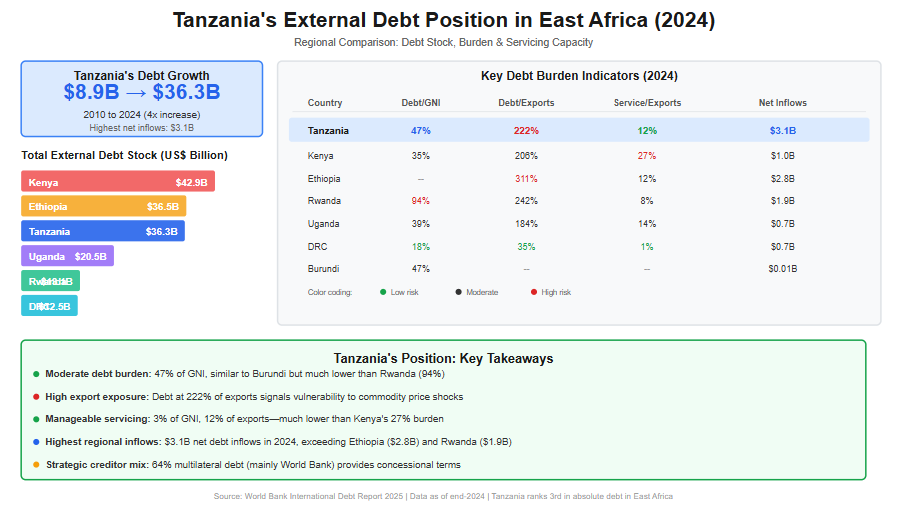
Over the past decade, Tanzania’s external debt has expanded rapidly, reflecting both the country’s ambitious development agenda and growing reliance on external financing to bridge fiscal and infrastructure gaps. According to the International Debt Report 2025, Tanzania’s total external debt stock increased more than fourfold—from US$8.9 billion in 2010 to US$36.3 billion by end-2024. This sharp rise underscores the scale of public investment undertaken during this period, particularly in transport infrastructure, energy, and social sectors, but it also raises important questions regarding debt sustainability and regional competitiveness.
In East Africa, Tanzania currently ranks among the top three most indebted countries in absolute terms, alongside Kenya and Ethiopia. By end-2024, Kenya recorded the highest external debt stock at US$42.9 billion, followed by Ethiopia (US$36.5 billion) and Tanzania (US$36.3 billion). While Tanzania’s debt level is lower than Kenya’s, it is significantly higher than that of Uganda (US$20.5 billion), Rwanda (US$13.1 billion), and the Democratic Republic of Congo (US$12.5 billion). This positioning places Tanzania as a major regional borrower, reflecting the relative size of its economy and its sustained access to concessional and semi-concessional financing.
From a debt burden perspective, Tanzania’s external debt stood at 47% of Gross National Income (GNI) in 2024—moderate by regional standards. This ratio is similar to Burundi (47%) but substantially lower than Rwanda’s 94%, indicating comparatively lower vulnerability than some peers. However, when measured against export earnings, Tanzania’s external debt reached 222% of exports, signaling a high exposure to external shocks, especially fluctuations in commodity prices and global demand. This ratio is higher than Uganda’s (184%) and Kenya’s (206%), though still below Ethiopia’s elevated level of 311%.
Debt servicing pressures in Tanzania remain relatively manageable compared to other East African economies. In 2024, debt service payments accounted for 3% of GNI and 12% of export earnings, significantly lower than Kenya, where debt service absorbed 27% of exports, and comparable to Rwanda’s levels. This reflects Tanzania’s continued reliance on multilateral creditors, which account for approximately 64% of public and publicly guaranteed (PPG) external debt, with the World Bank alone representing nearly half of total PPG debt. Such creditor composition has helped moderate repayment pressures through longer maturities and concessional terms.
Nevertheless, Tanzania recorded the highest net external debt inflows in East Africa in 2024, at US$3.1 billion, exceeding Ethiopia (US$2.8 billion) and Rwanda (US$1.9 billion). This trend highlights ongoing financing needs and signals that debt accumulation is likely to persist in the medium term. As regional peers increasingly face tightening global financial conditions, Tanzania’s future debt trajectory will depend heavily on export performance, fiscal discipline, and the productivity of debt-financed investments.
Overall, Tanzania’s external debt position reflects a delicate balance: stronger than highly indebted peers such as Rwanda and Kenya in terms of servicing capacity, yet more exposed than Uganda and DRC when viewed through export and inflow dynamics. This evolving landscape makes continuous debt monitoring, regional benchmarking, and strategic borrowing essential for safeguarding macroeconomic stability and sustaining long-term growth. Read More of This Topic: Who Is Financing Tanzania’s Public Debt in 2024—and What Does It Mean for Sustainability?
The following table summarizes Tanzania's external debt data across key years, as extracted from the International Debt Report 2025. All figures are in US$ million unless otherwise noted.
| Indicator | 2010 | 2020 | 2021 | 2022 | 2023 | 2024 |
| Total external debt stocks | 8,940 | 25,772 | 28,818 | 30,444 | 34,585 | 36,343 |
| Long-term external debt stocks | 6,904 | 22,055 | 23,589 | 24,533 | 28,271 | 30,898 |
| Public and publicly guaranteed debt from: | ||||||
| Official creditors | 5,546 | 15,355 | 15,502 | 16,308 | 18,296 | 20,005 |
| Multilateral | 4,391 | 11,243 | 11,526 | 12,615 | 14,655 | 16,435 |
| of which: World Bank | 3,248 | 8,148 | 8,290 | 9,228 | 10,989 | 12,097 |
| Bilateral | 1,155 | 4,112 | 3,975 | 3,693 | 3,641 | 3,571 |
| Private creditors | 135 | 2,209 | 3,436 | 3,244 | 4,090 | 4,272 |
| Bondholders | .. | .. | .. | .. | .. | .. |
| Commercial banks and others | 135 | 2,209 | 3,436 | 3,244 | 4,090 | 4,272 |
| Private nonguaranteed debt from: | 1,224 | 4,491 | 4,651 | 4,981 | 5,886 | 6,621 |
| Bondholders | .. | .. | .. | .. | .. | .. |
| Commercial banks and others | 1,224 | 4,491 | 4,651 | 4,981 | 5,886 | 6,621 |
| Use of IMF credit and SDR allocations | 647 | 274 | 1,357 | 1,444 | 1,760 | 2,062 |
| IMF credit | 354 | 0 | 557 | 683 | 993 | 1,316 |
| SDR allocations | 293 | 274 | 800 | 761 | 767 | 746 |
| Short-term external debt stocks | 1,389 | 3,442 | 3,872 | 4,467 | 4,554 | 3,383 |
| Disbursements, long-term | 1,361 | 1,459 | 3,049 | 3,104 | 5,200 | 4,112 |
| Public and publicly guaranteed sector | 1,145 | 1,181 | 2,865 | 2,421 | 4,030 | 3,500 |
| Private sector not guaranteed | 216 | 279 | 184 | 683 | 1,171 | 612 |
| Principal repayments, long-term | 134 | 984 | 1,142 | 1,533 | 1,547 | 1,204 |
| Public and publicly guaranteed sector | 55 | 968 | 1,118 | 1,179 | 1,282 | 1,126 |
| Private sector not guaranteed | 79 | 15 | 25 | 353 | 266 | 78 |
| Interest payments, long-term | 51 | 365 | 319 | 429 | 603 | 725 |
| Public and publicly guaranteed sector | 34 | 363 | 315 | 377 | 547 | 691 |
| Private sector not guaranteed | 17 | 2 | 4 | 52 | 56 | 34 |
The table below focuses on PPG debt in 2024, broken down by creditor type and key creditors where specified. Note that IMF credit is reported separately in the raw data but is included here as part of overall PPG (under multilateral creditors) per the report's figure, which explicitly incorporates it. The total PPG debt (including IMF credit) is approximately $25,593 million (long-term PPG $24,277 + IMF credit $1,316). Specific creditor breakdowns (e.g., China, AfDB) are derived from the report's Figure 1, which provides a visual pie chart; percentages are approximate and may reflect rounded values.
| Creditor Type | Sub-Creditor/Creditor | Amount (US$ million) | % of Total PPG (incl. IMF) |
| Multilateral (excl. IMF) | Total Multilateral (excl. IMF) | 16,435 | ~64% |
| World Bank | 12,097 | ~47% | |
| AfDB (African Development Bank) | ~3,583 (est. based on 14%) | ~14% | |
| Other Multilateral | ~4,351 (est. based on 17%) | ~17% | |
| IMF Credit | IMF | 1,316 | ~5% (reported as 6% in figure) |
| Bilateral | Total Bilateral | 3,571 | ~14% |
| China | ~2,559 (est. based on ~10%; figure label may have OCR variance) | ~10% | |
| India | ~512 (est. based on 2%) | ~2% | |
| Korea, Rep. | ~512 (est. based on 2%) | ~2% | |
| France | ~256 (est. based on 1%) | ~1% | |
| Other Bilateral | ~1,538 (est. based on 6%) | ~6% | |
| Private Creditors | Total Private | 4,272 | ~17% |
| Bondholders | .. | 0% | |
| Commercial Banks and Others | 4,272 | ~17% (incl. other commercial ~4%) | |
| Total PPG (incl. IMF) | 25,593 | **100% |
The International Debt Report 2025 provides detailed external debt statistics for low- and middle-income countries, including East African nations. Below is a comparison focusing on Tanzania and other East African countries (Burundi, Democratic Republic of the Congo (DRC), Ethiopia, Kenya, Rwanda, Somalia, and Uganda). The data is drawn from the report's country tables and snapshots. Note that some values for Ethiopia and Burundi are missing in the report (indicated as ".."), and for Somalia, I supplemented with data from the World Bank's online IDS portal as the PDF extraction for that country was incomplete. Population for Uganda is estimated based on report context (not explicitly listed in the extracted data). All figures are in US$ million unless otherwise noted.
| Country | Total External Debt Stock (US$ million) | External Debt % of GNI | External Debt % of Exports | Debt Service % of GNI | Debt Service % of Exports | Net Debt Inflows (US$ million) | GNI (US$ million) | Population (million) |
| Tanzania | 36,343 | 47 | 222 | 3 | 12 | 3,056 | 76,808 | 69 |
| Burundi | 1,024 | 47 | .. | 2 | .. | 10 | 2,173 | 14 |
| DRC | 12,485 | 18 | 35 | 1 | 1 | 651 | 68,396 | 109 |
| Ethiopia | 36,548 | .. | 311 | .. | 12 | 2,817 | .. | 132 |
| Kenya | 42,886 | 35 | 206 | 5 | 27 | 1,006 | 122,557 | 56 |
| Rwanda | 13,050 | 94 | 242 | 3 | 8 | 1,900 | 13,901 | 14 |
| Somalia | 2,837 | .. | .. | .. | .. | .. | .. | 18 |
| Uganda | 20,534 | 39 | 184 | 2 | 14 | 676 | 52,361 | 50 |
By the end of 2024, Tanzania’s external debt landscape had reached a critical juncture, reflecting a decade of accelerated borrowing to finance infrastructure, energy, and social development priorities. According to the World Bank’s International Debt Report 2025, Tanzania’s total external debt stock stood at US$36.3 billion, more than four times higher than the US$8.9 billion recorded in 2010. Within this total, Public and Publicly Guaranteed (PPG) debt accounted for approximately US$25.6 billion, underscoring the central role of government-backed borrowing in shaping the country’s fiscal position.
The structure of Tanzania’s public debt financing in 2024 is heavily tilted toward multilateral institutions, a feature that distinguishes Tanzania from several of its East African peers and has important implications for sustainability. Multilateral creditors—including the World Bank, the African Development Bank (AfDB), and the International Monetary Fund (IMF)—collectively financed about 69% of Tanzania’s PPG external debt, equivalent to roughly US$17.8 billion. The World Bank alone accounted for US$12.1 billion, representing nearly half (47%) of total PPG debt, making it Tanzania’s single largest creditor. This reliance on concessional multilateral finance has helped Tanzania maintain relatively low debt-servicing pressures, with debt service consuming only 3% of Gross National Income (GNI) and 12% of export earnings in 2024—well below Kenya’s 5% of GNI and 27% of exports.
Bilateral creditors played a secondary but strategically significant role, financing approximately 14% of PPG debt, or US$3.6 billion. Within this category, China emerged as the dominant bilateral lender, holding an estimated US$2.6 billion, equivalent to around 10% of total PPG debt. These loans are largely associated with large-scale infrastructure projects, including transport and energy investments, which have long-term growth potential but also carry execution and revenue risks. Other bilateral partners—such as India, Korea, and France—collectively accounted for smaller shares (each around 1–2%), often targeting sector-specific development initiatives.
Private creditors represented a growing but more risk-sensitive component of Tanzania’s public debt portfolio. In 2024, private creditors—primarily commercial banks and other private lenders—held approximately US$4.3 billion, or 17% of PPG debt. Notably, Tanzania had no exposure to international bondholders, unlike regional peers such as Kenya. This absence of eurobond debt has shielded Tanzania from rollover and refinancing risks during a period of elevated global interest rates, reinforcing short-term debt sustainability. However, private loans typically carry higher interest rates and shorter maturities, meaning their rising share could increase fiscal pressure if not carefully managed.
From a sustainability perspective, Tanzania’s creditor composition offers both reassurance and caution. On the one hand, the dominance of concessional multilateral financing has kept debt servicing costs manageable and supported macroeconomic stability, even as net external debt inflows reached US$3.1 billion in 2024—the highest in East Africa. On the other hand, continued reliance on external borrowing, particularly in a context where external debt equals 47% of GNI and 222% of export earnings, exposes Tanzania to exchange rate shocks and export volatility.
Ultimately, who finances Tanzania’s public debt matters as much as how much is borrowed. In 2024, Tanzania’s public debt sustainability was underpinned by favorable creditor terms rather than low debt levels. Maintaining this position will require disciplined borrowing, stronger export growth, and ensuring that debt-financed investments generate sufficient economic returns to support repayment over the medium to long term. Read More of This Topic: External Debt Stock by Borrower
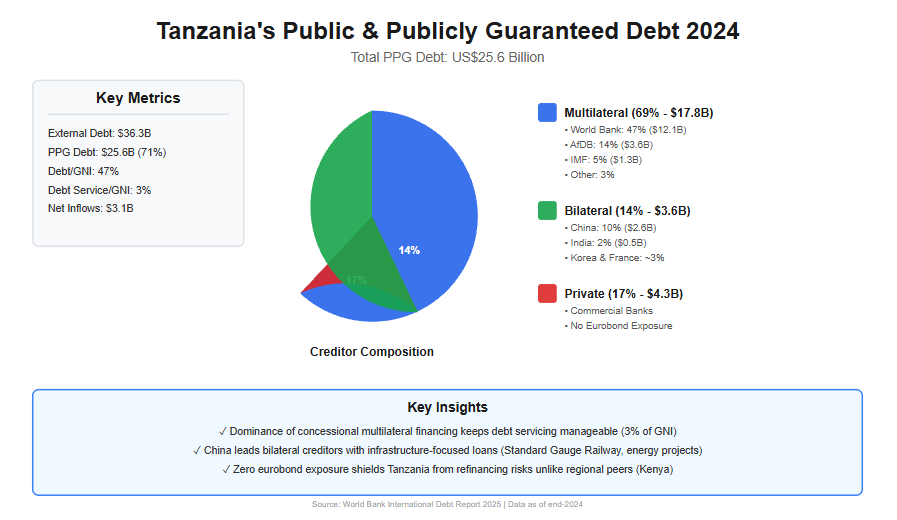
PPG debt includes loans to the public sector that are guaranteed by the government, encompassing borrowings from official creditors (multilateral and bilateral) and private sources. By the end of 2024, Tanzania's PPG debt (including IMF credit) stood at approximately US$25.6 billion, accounting for a significant portion of the country's long-term external debt. This figure reflects Tanzania's strategy of leveraging concessional financing to fund development priorities, but it also underscores vulnerabilities to global interest rate shifts and currency fluctuations.
The creditor composition reveals a heavy dependence on multilateral lenders, which provide favorable terms such as longer maturities and lower interest rates. This has helped keep debt servicing burdens manageable—at 3% of GNI and 12% of exports in 2024—compared to regional peers like Kenya (5% of GNI and 27% of exports). However, with net debt inflows reaching US$3.1 billion in 2024, the highest in East Africa, ongoing borrowing could strain future fiscal space if export growth falters.
The following table presents Tanzania's PPG debt in 2024, categorized by creditor type and key sub-creditors. Data is sourced from the International Debt Report 2025, with specific breakdowns estimated from the report's visual representations (e.g., pie charts in Figure 1). Amounts are in US$ million, and percentages are approximate, reflecting rounded values from the report. IMF credit is integrated under multilateral creditors, as per the report's methodology, contributing to the total PPG figure of US$25,593 million (derived from long-term PPG of US$24,277 million plus IMF credit of US$1,316 million).
| Creditor Type | Sub-Creditor/Creditor | Amount (US$ million) | % of Total PPG (incl. IMF) |
| Multilateral (excl. IMF) | Total Multilateral (excl. IMF) | 16,435 | ~64% |
| World Bank | 12,097 | ~47% | |
| AfDB (African Development Bank) | ~3,583 (est.) | ~14% | |
| Other Multilateral | ~4,351 (est.) | ~17% | |
| IMF Credit | IMF | 1,316 | ~5% (reported as 6% in figure) |
| Bilateral | Total Bilateral | 3,571 | ~14% |
| China | ~2,559 (est.) | ~10% | |
| India | ~512 (est.) | ~2% | |
| Korea, Rep. | ~512 (est.) | ~2% | |
| France | ~256 (est.) | ~1% | |
| Other Bilateral | ~1,538 (est.) | ~6% | |
| Private Creditors | Total Private | 4,272 | ~17% |
| Bondholders | .. | 0% | |
| Commercial Banks and Others | 4,272 | ~17% (incl. other commercial ~4%) | |
| Total PPG (incl. IMF) | 25,593 | 100% |
The dominance of multilateral creditors (around 69% including IMF) in Tanzania's PPG debt portfolio is a double-edged sword. On one hand, it ensures concessional terms that support debt sustainability; the World Bank and AfDB together account for over 60% of this category, financing projects aligned with Tanzania's National Development Vision 2025. IMF credit, at US$1,316 million, has provided balance-of-payments support, particularly post-COVID recovery.
Bilateral creditors, making up 14%, highlight strategic partnerships. China's ~10% share is notable, linked to major investments like the Standard Gauge Railway and power plants. Smaller contributions from India, Korea, and France often focus on sector-specific aid, such as agriculture and technology.
Private creditors' 17% share signals maturing financial markets but introduces risks, as these loans typically carry higher interest rates and shorter terms. With no bondholder debt reported, Tanzania has avoided eurobond exposures seen in peers like Kenya, reducing immediate refinancing pressures.
In the East African context, Tanzania's PPG composition favors stability compared to Rwanda (94% debt-to-GNI) or Ethiopia (311% debt-to-exports). However, as global conditions tighten, diversifying creditors and boosting exports (e.g., through mining and agriculture) will be crucial. The report emphasizes debt transparency and management reforms to mitigate risks.
Zanzibar's economy in 2025 has demonstrated robust resilience and growth, contributing significantly to Tanzania's overall economic development. As a semi-autonomous region within the United Republic of Tanzania, Zanzibar accounts for approximately 3-4% of the national GDP but plays a pivotal role in foreign exchange earnings through tourism and agriculture. According to the Bank of Tanzania's (BoT) Monthly Economic Review for November 2025, Zanzibar's GDP grew by 6.4% in the first quarter of 2025 (matching the previous year), with projections for full-year growth reaching 7.3%, driven by tourism, construction, and agriculture. This outperforms the mainland's 5.4% Q1 growth and aligns with Tanzania's national target of over 6% GDP expansion. Key enablers include stable inflation, fiscal discipline, and a surging external sector, bolstered by global tourism recovery and domestic reforms. However, challenges like cyclical commodity declines (e.g., cloves) and import pressures highlight the need for diversification. Below, we expand on the provided outline with detailed data from the BoT report, supplemented by contextual insights from recent analyses (e.g., IMF and World Bank projections for Tanzania-Zanzibar integration). Read More: Zanzibar Economy Strengthens
Zanzibar experienced significant easing of inflation in 2025, aligning with the Bank of Tanzania's 3-5% target and regional benchmarks under the East African Community (EAC) and Southern African Development Community (SADC). This stability supports household purchasing power, consumer spending, and broader economic confidence, contributing to Tanzania's anchored national inflation at 3.5% in October 2025. The decline reflects prudent monetary policy transmission from the mainland, adequate food supplies via inter-regional trade, and falling global energy prices, which reduced imported inflation.
Headline inflation moderated steadily through 2025, falling from 5.8% in October 2024 to 3.4% in October 2025—a cumulative easing of 41% year-over-year. Monthly inflation remained subdued at 0.1% in October 2025, unchanged from the prior year, indicating low near-term pressures.
| Indicator | Oct 2024 | Sep 2025 | Oct 2025 |
| Headline inflation (%) | 5.8 | 3.5 | 3.4 |
Main drivers of the decline:
The table below details year-on-year (YoY) and month-on-month changes, based on the July 2022=100 CPI basket. Food remains volatile but downward-trending, while energy-related categories (e.g., housing, transport) show sharp disinflation.
| Group | Weight (%) | Month-on-Month (Oct 2025) | YoY Oct 2024 (%) | YoY Oct 2025 (%) |
| Food & non-alcoholic beverages | 41.9 | 0.7 | 8.0 | 7.1 |
| Housing, electricity, gas & fuels | 25.8 | -1.0 | 7.3 | -3.3 |
| Transport | 9.1 | -0.3 | 1.2 | 2.4 |
| Recreation & culture | 1.1 | -0.5 | 3.8 | 5.7 |
| All items (Headline) | 100.0 | 0.1 | 5.8 | 3.4 |
| Selected Subgroups | ||||
| Food (core food excl. beverages) | 40.5 | 0.6 | 8.2 | 6.4 |
| Non-food | 59.5 | -0.4 | 4.1 | 1.0 |
Source: Office of the Chief Government Statistician (Zanzibar), BoT computations. Insights: Negative monthly shifts in housing (-1.0%) and recreation (-0.5%) underscore energy and seasonal demand relief. YoY food inflation's persistence (7.1%) ties to Zanzibar's import reliance (70% of staples from mainland), but overall trends support 2025's low-risk outlook per IMF's 2025 Article IV consultation.
Chart Description (Annual Inflation Rates): A line chart tracks headline (blue, declining to 3.4%), food (red, easing to 6.4%), and non-food (green, dropping to 1.0%) from Oct 2024 to Oct 2025, highlighting the post-July 2025 disinflation phase amid harvest peaks.
Zanzibar's fiscal operations in 2025 emphasize growth-oriented spending, with a Sh6.98 trillion annual budget (up 34.7% YoY) targeting infrastructure and social sectors. October 2025 data shows a deficit but strong domestic mobilization, reducing aid dependency and aligning with Tanzania's national fiscal consolidation (deficit at 3.5% of GDP). This supports Vision 2050 goals by channeling 65% of the budget to development, up from 24% five years ago.
Total resources reached 84.8% of target, driven by tax buoyancy from tourism levies and trade. Non-tax underperformance reflects seasonal delays in fees/dividends.
| Category | Actual (TZS Billion) | % of Target |
| Total Resources (Revenue + Grants) | 170.8 | 84.8% |
| – Domestic revenue | 165.0 | — |
| – Grants | 5.8 | — |
| Tax revenue | 151.8 | 88.5% |
| Non-tax revenue | 13.2 | 63.8% |
Key insight: Tax collection is strong and remains the backbone of Zanzibar’s revenue (89% share), fueled by VAT/excise (TZS 44.7B), income tax (TZS 44.7B), and import duties (TZS 25.9B). Non-tax lags due to delayed port/airport fees. Annual domestic revenue has surged 278% over five years to Sh2.9T, per President Mwinyi's October 2025 remarks, enabling self-financed operations.
Chart Description (Chart 3.2.1: Government Resources): Bar chart compares 2024-2025 actuals: Tax on imports (25.9B), VAT/excise (44.7B), income tax (44.7B), other taxes (31.4B), non-tax (13.9B), grants (28.3B)—showing tax dominance.
Expenditure prioritized development (52% share), financing key projects like education reforms (Sh864B allocation for 2025/26) and tourism infrastructure.
| Category | Amount (TZS Billion) |
| Total Expenditure | 262.1 |
| – Recurrent Spending | 125.1 |
| – Development Expenditure | 137.0 |
Interpretation:
Chart Description (Government Expenditure): Stacked bars for 2024-2025: Wages/salaries (64.3B), other recurrent (99.1B), development (92.6B)—highlighting development surge.
Zanzibar continues to record a strong current account surplus, bolstering Tanzania's national reserves (up 14.1% YoY to USD 15.7B). The surplus widened amid tourism boom, offsetting mainland deficits and funding imports/investments.
The surplus expanded 42.8%, driven by services (36.6% growth), with tourism contributing 80% of receipts.
| Indicator | Year Ending Oct 2024 (USD Million) | Year Ending Oct 2025 (USD Million) | Change (%) |
| Current Account Balance | 649.9 | 928.2 | +42.8 |
Why the surplus increased:
Exports surged, with tourism overtaking goods as the top earner (55% of services exports).
| Indicator | Oct 2024 (USD M) | Oct 2025 (USD M) | Change (%) |
| Exports of goods & services | 126.6 | 151.8 | +20.0 |
Annual: +30.4% to USD 1,564.3M.
Tourism generated USD 3.92B nationally (year ending May 2025), with Zanzibar capturing ~30% of GDP contribution.
| Indicator | 2024 | 2025 (YTD Oct) | Change (%) |
| Tourist Arrivals | ~705,000 | 902,265 | +27.9 |
Tourism remains the dominant foreign exchange earner: Europeans (60% arrivals) and domestic travel up 20%; receipts USD 1.27B (year ending Aug 2025, +30.6%).
| Indicator | Oct 2024 | Oct 2025 | % Change |
| Value of Clove Exports (USD Million) | 22.1 | 10.9 | -50.7 |
Reason: Cyclical production decline (low harvest cycle); annual exports down 45.4% to USD 32.3M total goods, but offset by non-traditionals like spices/souvenirs.
Imports increased moderately, reflecting investment needs but contained by surplus.
| Indicator | Oct 2024 (USD M) | Oct 2025 (USD M) | Change (%) |
| Imports | 63.1 | 48.4 | -23.3 |
Annual: +17.0% to USD 656.4M.
Drivers:
| Category | Indicator | 2025 Value (Oct YTD) |
| Inflation | Headline inflation | 3.4% |
| Food inflation | 6.4% | |
| Non-food inflation | 1.0% | |
| Revenue | Total resources | TZS 170.8B |
| Tax revenue | TZS 151.8B | |
| Non-tax revenue | TZS 13.2B | |
| Expenditure | Total expenditure | TZS 262.1B |
| Development expenditure | TZS 137B | |
| External Sector | Current account | USD 928.2M surplus |
| Exports of goods & services | USD 1,564.3M | |
| Tourist arrivals | 902,265 | |
| Clove exports | USD 10.9M |
Overall Outlook: Zanzibar's 2025 performance enhances Tanzania's inclusive growth, per World Bank's FY2025-2029 CPF, by boosting FX (24% of national exports) and employment (1 in 5 jobs tourism-linked). Risks include commodity volatility, but 7.3% GDP projection signals sustained momentum.
From 2020–2025, Tanzania consistently relied on external sources to fund development, with foreign borrowing rising from 40% of total in 2020 to over 70% in 2025. Total annual borrowing nearly doubled in 2021 (+97%), mainly due to post-COVID recovery needs, while 2023 recorded the highest borrowing (TZS 12.03T), reflecting aggressive infrastructure financing. However, debt service increased from 12.5% of revenue (2020) to 20.6% (2024), tightening fiscal space. The growing share of non-concessional loans (up to 33.5% in 2025) has pushed interest costs higher. With 2025 political instability and EU aid suspension, projections show foreign borrowing could fall by 10–15% in 2026, especially program loans (-25–30%), while commercial borrowing could rise by 20–30%, worsening debt risks. Read More: Tanzania External Debt at USD 35.44 Billion
| Year | Foreign Borrowing | Domestic Borrowing | Total Borrowing | Foreign % | Domestic % |
| 2020 | 2,221 | 3,305 | 5,526 | 40.2% | 59.8% |
| 2021 | 7,574 | 3,331 | 10,905 | 69.4% | 30.6% |
| 2022 | 5,315 | 3,721 | 9,036 | 58.8% | 41.2% |
| 2023 | 8,268 | 3,766 | 12,034 | 68.7% | 31.3% |
| 2024 | 6,688 | 4,009 | 10,697 | 62.5% | 37.5% |
| 2025 (Jan-Sep) | 5,835 | 2,339 | 8,174 | 71.4% | 28.6% |
Trends: Total borrowing peaked at 12,034B TZS in 2023, driven by foreign loans. 2025 shows a slowdown, with foreign sources dominating (71.4% YTD).
| Year | Net Foreign Financing | Net Domestic Financing | Total Net Financing |
| 2020 | -252 | 3,057 | 2,805 |
| 2021 | 4,950 | 2,358 | 7,308 |
| 2022 | 2,455 | 2,935 | 5,390 |
| 2023 | 4,520 | 2,726 | 7,246 |
| 2024 | 2,486 | 1,533 | 4,019 |
| 2025 (Jan-Sep) | 3,396 | 2,434 | 5,830 |
Insight: Net financing stayed positive throughout, meaning new borrowing outpaced repayments, providing fiscal space for spending. However, foreign net inflows fluctuated with amortization spikes.
| Category | 2020 | 2021 | 2022 | 2023 | 2024 | 2025* |
| Program Loans | 277 | 1,358 | 1,499 | 2,015 | 1,777 | 2,114 |
| Development Project Loans | 1,944 | 6,216 | 3,816 | 6,253 | 4,911 | 3,721 |
| Non-Concessional Loans | 0 | 4,503 | 979 | 3,222 | 2,113 | 1,956 |
Domestic Borrowing Composition (Primarily Bank Borrowing; Non-Bank = 0 Across Years)
| Category | 2020 | 2021 | 2022 | 2023 | 2024 | 2025* |
| Bank Borrowing | 3,305 | 3,331 | 3,721 | 3,766 | 4,009 | 2,339 |
*2025: Jan-Sep; domestic figures are new borrowing only.
Details: Foreign loans emphasize development projects (63.8-87.5% of mix), funding infrastructure like roads, energy, and ports. Program loans (budget support) rose to 36.2% in 2025. Non-concessional (commercial) loans surged post-2021, indicating diversification from traditional donors.
| Year | Foreign Amortization | Domestic Amortization | Total Debt Service | As % of Revenue |
| 2020 | 2,473 | 248 | 2,721 | 12.5% |
| 2021 | 2,624 | 973 | 3,597 | 15.6% |
| 2022 | 2,860 | 786 | 3,646 | 13.1% |
| 2023 | 3,748 | 1,040 | 4,788 | 16.3% |
| 2024 | 4,202 | 2,476 | 6,678 | 20.6% |
| 2025 (Jan-Sep) | 2,439 | -95 | 2,344 | 9.3% |
| Year | Total Revenue (B TZS) | Total Borrowing (B TZS) | Borrowing/Revenue Ratio |
| 2020 | 21,828 | 5,526 | 25.3% |
| 2021 | 23,013 | 10,905 | 47.4% |
| 2022 | 27,921 | 9,036 | 32.4% |
| 2023 | 29,454 | 12,034 | 40.9% |
| 2024 | 32,492 | 10,697 | 32.9% |
| 2025 (9m) | 25,331 | 8,174 | 32.3% |
| Year | Total Revenue (B TZS) | Debt Service (B TZS) | Coverage Ratio | Status |
| 2020 | 21,828 | 2,721 | 8.0x | ✓ Strong |
| 2021 | 23,013 | 3,597 | 6.4x | ✓ Good |
| 2022 | 27,921 | 3,646 | 7.7x | ✓ Strong |
| 2023 | 29,454 | 4,788 | 6.2x | ✓ Good |
| 2024 | 32,492 | 6,678 | 4.9x | ⚠ Moderate |
| 2025 (9m) | 25,331 | 2,344 | 10.8x | ✓ Strong |
Year-on-Year Growth (from Document): Total borrowing grew 97.4% in 2021 (COVID spike), then fluctuated (-17.1% in 2022, +33.2% in 2023). 2024-2025 projected at -2.0%, signaling moderation.
| Type | 2020 | 2021 | 2022 | 2023 | 2024 | 2025* |
| Program Loans | 12.5 | 17.9 | 28.2 | 24.4 | 26.6 | 36.2 |
| Development Projects | 87.5 | 82.1 | 71.8 | 75.6 | 73.4 | 63.8 |
| Non-Concessional | 0.0 | 59.5 | 18.4 | 39.0 | 31.6 | 33.5 |
The data paints a picture of resilient but strained economic growth, with borrowing as a key enabler of development amid external shocks like COVID-19 and global inflation.
Key Economic Development Takeaways:
The political turmoil following Tanzania's October 29, 2025, general elections—marked by opposition allegations of fraud, violent crackdowns, internet shutdowns, and reports of hundreds of deaths—has significantly damaged the country's international reputation. President Samia Suluhu Hassan publicly acknowledged on November 18, 2025, that the unrest could hinder access to external funding, as Tanzania relies heavily on foreign loans (60-70% of total borrowing, per the document). This comes amid actions like the EU's suspension of aid on November 28, 2025, due to human rights concerns, and warnings from analysts about broader donor pullback.
For 2026 (fiscal year 2025/26, July-June), Tanzania's planned external borrowing of 8.7 trillion TZS (~$3.6 billion) is now at risk, potentially leading to a 15-25% shortfall in concessional flows. This could force a pivot to costlier options, exacerbating the fiscal stress seen in 2024 (debt service at 20.6% of revenue). Below, I break down the projected impacts on the three key foreign borrowing categories from the document: Program Loans, Development Project Loans, and Non-Concessional Loans. Projections are based on 2025 trends (e.g., Program Loans at 36.2% of foreign mix) adjusted for political fallout, assuming moderate unrest resolution by mid-2026.
Summary Table of Projected Impacts (in Billions TZS, Annualized for 2026)
| Category | 2025 Actual (Jan-Sep) | Projected 2026 Baseline (Pre-Unrest) | Adjusted 2026 Projection (Post-Unrest) | Key Impact Drivers |
| Program Loans | 2,114 | 2,800-3,000 | 2,000-2,300 (-25-30%) | Donor suspensions; governance conditions |
| Development Project Loans | 3,721 | 4,500-5,000 | 4,000-4,500 (-10-15%) | Project delays; bilateral caution |
| Non-Concessional Loans | 1,956 | 2,200-2,500 | 2,800-3,200 (+20-30%) | Shift from concessional; higher commercial demand |
| Total Foreign Borrowing | 5,835 (YTD) | 7,500-8,000 | 6,800-7,000 (-10-15%) | Overall aid tap-shut; image damage |
Notes: Baselines extrapolate 2025 YTD at 80% Q4 pace (per document). Adjustments factor in 15-25% concessional cuts from sources like EU/IMF. Total could rise if domestic borrowing fills gaps, but at higher rates.
Detailed Impacts by Category
Broader 2026 Outlook and Recommendations
Overall, the unrest could trim total foreign borrowing by 10-15% (~700-1,000B TZS shortfall), flipping net financing from positive (5.8T TZS in 2025 YTD) to neutral or negative if unaddressed. This threatens Tanzania's middle-income trajectory, with growth dipping to 3-4% amid investor caution. Politically, unresolved tensions (e.g., opposition bans) may prolong the crisis, but dialogue could unlock ~$1B in frozen aid by mid-year.
To navigate: Prioritize transparency for donor trust, diversify to resilient partners like India, and boost revenue (e.g., via mining taxes) to cut borrowing needs by 5-10%.
As of September 2025, Tanzania’s total public debt stood at TZS 127,474.5 billion, with external debt accounting for 70.6% (TZS 90,015.4 billion) and domestic debt contributing 29.4% (TZS 37,459.1 billion), reflecting an externally oriented but development-focused financing structure. The external portfolio—converted from USD 35.4 billion using the average rate of TZS 2,471.69/USD—is primarily held by the central government (77.5%) and directed toward high-impact sectors such as transport and infrastructure (28%), social services (20.4%), and energy/minerals (14.3%). Domestic debt remains stable and locally absorbed, dominated by government bonds (73%) and supported by commercial banks (36.4%) and pension funds (23.9%), indicating a deep and liquid local market. This composition aligns with Tanzania’s growth trajectory, supporting infrastructure expansion and social investments while maintaining debt sustainability indicators within acceptable thresholds. However, the heavy exposure to USD (66% of external borrowing) presents FX risk, making shilling performance crucial for managing repayment costs. Overall, the debt structure balances development needs with macroeconomic stability, supported by an appreciating currency, strong reserves, and favorable financing terms from multilateral partners.
Tanzania’s total public debt consists of external debt and domestic debt.
Summary Table — National Debt (TZS)
| Debt Category | Amount (TZS Billion) | Notes |
| External debt stock | 90,015.4 billion | Converted from USD 35.4bn using average rate TZS 2,471.69/USD 2025110720064684 |
| Domestic debt stock | 37,459.1 billion | From BoT monthly review 2025110720064684 |
| Total public debt | 127,474.5 billion | Combination of external + domestic |
The external debt is originally reported in USD.
The report’s exchange rate is:
Domestic debt is already in TZS in the document:
3.1 External Debt Stock by Borrower
| Borrower Category | Amount (USD Million) | Amount (TZS Billion) | % Share |
| Central Government | 27,461.3 | 67,854.5 | 77.5% |
| Private Sector | 5,357.0 | 13,231.0 | 15.1% |
| Government Guaranteed | 2,619.9 | 6,466.0 | 7.4% |
| Total | 35,438.2 | 90,015.4 | 100% |
(All USD values from document summary)
| Sector / Use of Funds | Amount (USD Million) | Amount (TZS Billion) | % Share |
| Transport & Infrastructure | 9,910.4 | 24,508.1 | 28.0% |
| Social services (Education & Health) | 7,238.1 | 17,895.8 | 20.4% |
| Energy & Minerals | 5,058.7 | 12,506.2 | 14.3% |
| Agriculture & Water | 4,964.3 | 12,280.9 | 14.0% |
| Finance & Insurance | 1,794.7 | 4,436.6 | 5.1% |
| Industry & Trade | 1,494.9 | 3,691.7 | 4.2% |
| Others | 4,977.1 | 12,703.7 | 14.0% |
| Total | 35,438.2 | 90,015.4 | 100% |
✔ Converted using TZS 2,471.69/USD.
4.1 Domestic Debt Structure by Creditor Category
| Creditor Category | Share (%) | Amount (TZS Billion) |
| Commercial Banks | 36.4% | 13,626.1 |
| Pension Funds | 23.9% | 8,946.7 |
| Other Financial Institutions | 39.7% | 14,886.3 |
| Total Domestic Debt | 100% | 37,459.1 |
| Instrument Type | Share (%) | Amount (TZS Billion) |
| Government Bonds | 73% | 27,349.1 |
| Treasury Bills | 27% | 10,110.0 |
| Total | 100% | 37,459.1 |
| Component | Amount (TZS Billion) | % of Total |
| External Debt | 90,015.4 | 70.6% |
| Domestic Debt | 37,459.1 | 29.4% |
| Total Debt | 127,474.5 | 100% |
| Item | External Debt (TZS bn) | Domestic Debt (TZS bn) | Total (TZS bn) |
| Debt Stock | 90,015.4 | 37,459.1 | 127,474.5 |
| Share of Total | 70.6% | 29.4% | 100% |
| Main Creditors | Multilaterals, Bilaterals | Banks, Pension Funds | — |
| Primary Risks | FX risk (USD) | Refinancing risk | — |
The breakdown of Tanzania's national debt as of September 2025, detailed in Section 2.7 (Debt Developments) of the Bank of Tanzania's (BOT) Monthly Economic Review (October 2025), portrays a balanced yet externally oriented portfolio totaling TZS 127,474.5 billion (equivalent to ~USD 51.6 billion at TZS 2,471.69/USD). External debt dominates at 70.6% (TZS 90,015.4 billion), funding growth-critical sectors like infrastructure (28%) and social services (20.4%), while domestic debt (29.4%, TZS 37,459.1 billion) relies on stable local institutions (e.g., banks 36.4%, pensions 23.9%). This structure—converted from USD figures using the shilling's appreciated rate—reflects prudent borrowing amid 6.3% Q2 GDP growth, low 3.4% inflation, and a TZS 618.5 billion fiscal deficit (partly debt-financed). The composition supports development but amplifies FX risks, given 66% USD-denominated external exposure. Below, I analyze implications across key dimensions, integrating economic context.
1. Debt Composition: External Dominance for Growth Financing
2. Sustainability and Servicing Dynamics
3. Fiscal and Macroeconomic Linkages
4. Policy Context from the Review
| Component | Amount (TZS Billion) | % of Total | Key Implication |
| External Debt | 90,015.4 | 70.6% | Funds infra/social growth; FX risk from USD (66%). |
| └ Central Govt | 67,854.5 | 77.5% (of external) | Sovereign focus; concessional (57% multilateral). |
| └ Infra/Transport | 24,508.1 | 28% (of external) | Boosts GDP via construction/mining. |
| Domestic Debt | 37,459.1 | 29.4% | Stable local absorption; bonds (73%) for duration. |
| └ Commercial Banks | 13,626.1 | 36.4% (of domestic) | Liquidity tie to IBCM surge (+37.4%; Section 2.5). |
| Total Debt | 127,474.5 | 100% | Sustainable at 40.1% GDP; supports 6% growth projection. |
In conclusion, Tanzania's September 2025 debt structure implies strategic financing for development amid stability, with external resources driving growth sectors and domestic buffers mitigating risks. The 70.6% external tilt underscores FX vigilance, but concessional terms and shilling strength ensure sustainability—reinforcing the Review's narrative of prudent policies for 2026 resilience.
When President Dr. Samia Suluhu Hassan addressed newly sworn-in ministers on November 18, 2025, her message conveyed a rare and urgent frankness. Tanzania, she warned, has entered one of the most fragile economic moments in its recent history. A wave of political unrest following the October general elections has not only shaken domestic confidence but also tarnished the country’s international reputation, so much so that securing external loans or grants has become “extremely difficult.”
The warning would be serious under normal circumstances. However, it occurs at a time when Tanzania is beginning the first five-year phase of implementing Development Vision 2050, a plan whose initial commitments alone will cost nearly TZS 477 trillion, more than four times the investment amount of the previous period. The contradiction is clear: the country is pursuing its most ambitious development program in decades while traditional funding sources are shrinking significantly.
Yet, despite the storm clouds gathering over international credit markets, President Samia framed the challenge with an unexpected confidence, almost a sense of defiant optimism. The Sixth-Phase Government, she noted, has overseen one of the most stable economic recoveries on the continent. GDP growth, which had wavered during the pandemic at 4.5 per cent, rebounded steadily to 5.9 per cent in 2024 and is projected to surpass 6 per cent in 2025.
Inflation has held below 5 per cent for consecutive years, private-sector credit has ticked upward (even if still modest by global standards at around 16–17 per cent of GDP), and the expansion of power generation, particularly through the Julius Nyerere Hydropower Project, has meaningfully altered the country’s industrial landscape.
Those successes, however, rested heavily on the cushion of political calm that Tanzania enjoyed before 2025. And this is where the President’s message sharpened: the country's borrowing space is narrowing just as the cost of development is ballooning.
Public debt now stands between TZS 107 trillion and TZS 115 trillion, roughly 40–48 per cent of GDP. Pushing domestic borrowing higher, she warned, would choke private-sector growth as banks redirect liquidity toward government securities. Raising taxes, in a politically tense climate, risks further instability. As she put it, this is a moment that demands “smart economic thinkers.”
Among the strategies the President foregrounded, one stood out unmistakably: Public-Private Partnerships. Unlike traditional borrowing, PPPs distribute risks between the state and investors, and they bring the discipline, efficiency, and innovation of the private sector into the heart of the national development agenda. In the current environment, PPPs are no longer one option among many; they are the most viable route to sustain economic progress without sinking deeper into debt.
Her argument reflected both pragmatism and urgency. If Tanzania is to finance the mega-projects envisioned in Vision 2050, from expressways to energy corridors, ports to industrial parks, it must attract capital that is neither fiscally suffocating nor politically explosive. PPPs offer precisely that escape hatch: a way to maintain the development trajectory while shielding the national balance sheet.
Moreover, PPPs align perfectly with the commitments already embedded in the CCM Manifesto and Vision 2050, which designate them as a central “enabler” of long-term growth. The difference, today, is that what was once framed as an enabler has become a necessity.
President Samia did not shy away from the political dimension of economic recovery. For years, Tanzanian policy debates toggled between the question of whether political reform must precede economic reform or vice versa. The President dismissed the dichotomy entirely. In a global environment where risk perception shapes the movement of billions of dollars, democratic credibility and economic diplomacy are inseparable.
A country seeking to reclaim its investment-grade rating cannot afford democratic backsliding or a hostile media environment. Investors, lenders, and multilateral institutions increasingly read political signals as economic indicators.
Restoring Tanzania’s image as a predictable and stable state is therefore not simply a matter of governance; it is a prerequisite for capital inflows, concessional lending, and long-term partnerships. This context gives deeper meaning to her call for simultaneous reforms. It is not about political ideology. It is about economic survival.
Against this backdrop, the proposal to establish a National Economic and Social Council (NESC) under the Office of the President emerges as a strategically timely idea. Tanzania’s policy landscape has grown too complex, and its economic stakes too high, to operate without a permanent, high-level institution dedicated to consensus building, deep research, and cross-sector coordination.
Such a council would allow the government to craft development strategies grounded in rigorous analysis rather than reactive decision-making. It would bring together economists, business leaders, civil society voices, and international development experts to identify emerging risks, mediate competing interests, and shape policies aligned with Tanzania’s long-term objectives.
Just as importantly, NESC would function as a national think tank tasked with aligning performance metrics, KPIs, OKRs, and broader development indicators, so that mega-projects, whether financed through PPPs or other mechanisms, remain accountable, measurable, and coherent.
Countries that have navigated rapid development successfully, South Korea, Malaysia, and Singapore, have built similar institutions during their transformational decades. Tanzania now faces its equivalent moment.
For Vision 2050’s first implementation phase to succeed, Tanzania must adopt a coherent strategy that binds together PPP financing, diplomatic rebuilding, and political reform. A national PPP commission placed at the heart of government could streamline project selection, reduce preparation times, and attract global partners more effectively. Tightening domestic borrowing, while expanding private-sector credit toward at least 25 per cent of GDP, would create the liquidity needed for entrepreneurship and industrial expansion.
Simultaneously, medium-term actions, including an Economic Diplomacy Task Force, could help restore at least USD 1.5 billion in annual grants and concessional financing by 2028, while priority projects such as the Dar es Salaam–Chalinze–Morogoro expressway, Bagamoyo Port Phase I, the sixth phase of the Standard Gauge Railway, and major hydropower initiatives could serve as proof-of-concept models for large-scale PPP execution.
A revitalized political environment, supported by reforms to electoral laws, civic freedoms, and institutional oversight, would complement these efforts by re-establishing Tanzania as a trusted partner for investors and lenders alike.
President Samia’s message was not one of despair, but of awakening. Tanzania stands at an economic crossroads where yesterday’s tools will not solve tomorrow’s challenges. The country’s demographic strength, mineral wealth, agricultural potential, and expanding energy capacity give it the raw ingredients to achieve the Vision 2050 target of becoming a trillion-dollar economy with a per-capita income of USD 7,000.
But unlocking these future demands requires institutions that can think ahead, reforms that can restore trust, and partnerships that can mobilize capital without destabilizing the economy. Public-Private Partnerships will be the bridge.
Political and economic reforms will be the foundation. And a National Economic and Social Council can become the strategic brain of the national development project. The path forward is difficult, but it is navigable. And if Tanzania manages this moment with clarity and coordination, Vision 2050 will cease to be an aspiration and become a living reality.
A Quantitative Analysis for Equitable Allocation
TICGL’s Economic Research Centre has published a discussion paper authored by Dr. Bravious Felix Kahyoza PhD, FMVA, CP3P (braviouskahyoza5@gmail.com) and David Kafulila (davidkafulila0@gmail.com), presenting groundbreaking quantitative research on risk allocation in Tanzania’s Public-Private Partnership (PPP) infrastructure projects. The study highlights how inequitable risk distribution adversely affects project performance and long-term sustainability, while proposing data-driven strategies to strengthen infrastructure delivery and fiscal efficiency in alignment with Tanzania’s Vision 2025.
With his expertise in financial modeling, valuation, and PPP management, Dr. Kahyoza provides a rigorous analytical framework to guide policymakers and investors toward balanced risk-sharing mechanisms, fostering resilient and performance-driven PPP implementation across Tanzania’s infrastructure sector.
Dr. Bravious Felix Kahyoza, a certified expert in Financial Modeling & Valuation Analyst (FMVA) and Certified PPP Professional (CP3P). leverages his expertise in project feasibility, risk management, and investment performance to provide actionable insights for improving Tanzania’s PPP frameworks and advancing national development goals.
With an estimated USD 15 billion annual infrastructure gap and only 20 active PPP projects as of 2024, Tanzania faces a critical juncture in infrastructure development. The paper argues that systematic risk-sharing imbalances—where the public sector bears 60-70% of total risks versus the optimal 40-50% benchmark—are causing 70% project delays, 20-50% cost overruns, and high-profile failures like the USD 10 billion Bagamoyo Port project, threatening the nation's economic transformation goals.
Key Findings and Insights
Structural Challenges and Root Causes
The research identifies multiple interconnected factors driving risk allocation imbalances in Tanzania's PPP ecosystem:
Institutional Capacity Gaps:
Regulatory and Legal Weaknesses:
Financial Constraints:
Information Asymmetries:
Case Study Evidence:
Data-Driven Recommendations for Equitable Risk Allocation
To transform Tanzania's PPP framework from its current state of systemic imbalance to a model of sustainable, equitable partnership, the paper proposes comprehensive, evidence-based reforms:
1. Legislative and Regulatory Reforms:
2. Institutional Capacity Building:
3. Financial Mechanism Innovations:
4. Enhanced Project Preparation:
5. Transparency and Monitoring Systems:
6. Sector-Specific Strategies:
Conclusion
Tanzania's PPP infrastructure program stands at a critical inflection point. The quantitative evidence presented in this study—drawn from rigorous statistical analysis of 200 stakeholders and 18 major projects—unequivocally demonstrates that current risk allocation patterns are unsustainable and systematically disadvantage the public sector while deterring private investment.
The authors emphasize that risk-sharing is not a zero-sum game but rather a strategic optimization challenge. The study's findings—particularly the 0.65 correlation between equitable sharing and performance and the 0.42 standardized regression coefficient—provide compelling evidence that properly balanced risk allocation can simultaneously:
The research makes three vital contributions to PPP scholarship and practice:
Theoretical Advancement: By integrating Transaction Cost Theory with the World Bank Risk Allocation Framework and adding Tanzanian-specific moderators (institutional capacity, regulatory stability), the study extends global PPP theory into underrepresented African contexts—where only 12% of global PPP literature focuses despite disproportionate infrastructure needs.
Practical Tools: The study delivers actionable instruments including validated risk matrices, equitable sharing indices (0-100 scale), and performance prediction models that PPP practitioners can immediately deploy in project preparation and contract negotiation.
Policy Blueprint: The evidence-based recommendations provide a comprehensive reform roadmap for the Tanzanian government, addressing legislative gaps, capacity constraints, and financial mechanisms required to unlock the USD 15 billion annual infrastructure investment needed for middle-income country status.
By 2030, if these reforms are implemented, Tanzania could transform its PPP portfolio from 20 struggling projects to a robust pipeline of 50+ high-performing partnerships, positioning the nation as an East African leader in infrastructure finance and demonstrating that equitable risk-sharing is the foundation for sustainable public-private collaboration.
The study concludes with an urgent call to action: risk allocation reform is not optional—it is imperative for realizing Tanzania's development aspirations. Through data-driven policy, institutional strengthening, and transparent governance, Tanzania can turn PPP challenges into opportunities, converting its infrastructure gap into a catalyst for inclusive economic transformation.
📘 Read the Full Research Paper:
"Exploring the Dynamics of Risk Sharing in Tanzania's PPP Infrastructure Projects"
Authored by Dr. Bravious Felix Kahyoza (PhD, FMVA) and David Kafulila
Published by TICGL | Tanzania Investment and Consultant Group Ltd
🌐 www.ticgl.com