Tanzania CPI April 2026: Inflation Rises to 4.0% | TICGL Economic Intelligence
Official Data — NBS Tanzania · Released 8 May 2026
Tanzania Inflation Rises to 4.0% in April 2026
The National Consumer Price Index (NCPI) for April 2026 signals rising inflationary pressure, driven by a sharp surge in transport costs, accelerating food prices, and a spike in fuel and energy. TICGL presents the full data with interactive charts and expert context.
📅 Reference period: April 2026🏛️ Source: National Bureau of Statistics (NBS)🇹🇿 Coverage: All 26 Mainland Regions📊 Base Year: 2020 = 100
Headline Inflation
4.0%
▲ from 3.2% (Mar 2026)
Food Inflation
5.7%
▲ from 5.5% (Mar 2026)
Core Inflation
3.1%
▲ from 2.2% (Mar 2026)
Transport (YoY)
9.2%
▲ Highest category
Section 1
About the National Consumer Price Index (NCPI)
The NCPI, published by Tanzania's National Bureau of Statistics (NBS), is the country's official measure of consumer price inflation. It tracks how the cost of a fixed basket of goods and services changes over time for a representative sample of Tanzanian households.
383
Total goods & services in basket
132
Food & non-alcoholic beverage items
251
Non-food items tracked
📍 Geographic Coverage
Price data is collected from all 26 regional headquarters on the Tanzanian mainland, ensuring nationwide representativeness across both urban and rural areas.
⚖️ Weights & Reference
Weights are derived from the 2017/18 Household Budget Survey, covering urban and rural households. The base price reference period is Jan–Dec 2020; index reference year is 2020.
🗂️ Classification Standard
The NCPI follows the UN COICOP 2018 classification, disseminated across 13 expenditure divisions. Supplementary indices include the Core Index, Energy Index, Services Index, and Goods Index.
📐 Index Formula
Elementary aggregates use the geometric mean of price relatives. Higher-level aggregates use the Lowe Index formula (a type of Laspeyres index), ensuring methodological alignment with international standards.
💡
Why it matters for investors: The NCPI is the primary instrument used by the Bank of Tanzania to calibrate monetary policy. Rising inflation—especially in food and transport—directly affects consumer purchasing power, wage demands, and the operating costs of businesses across all sectors.
Section 2
Annual Headline Inflation: 4.0% in April 2026
Tanzania's annual Headline Inflation Rate for April 2026 jumped to 4.0 percent, a significant increase from the 3.2 percent recorded in March 2026. The overall NCPI index rose from 119.78 in April 2025 to 124.61 in April 2026, reflecting broad-based price pressures across the economy — with transport being the most acute pressure point.
⚠️
Significant acceleration: The jump from 3.2% to 4.0% in a single month is notable. This 0.8 percentage point increase is largely driven by a 29.3% surge in diesel prices and a 29.6% rise in petrol between March and April 2026 — suggesting fuel cost pass-through into transport fares and general goods.
Chart 1: NCPI Index Value & Annual Inflation Rate — Apr 2025 to Apr 2026
Base year 2020 = 100 | Source: National Bureau of Statistics (NBS), Tanzania
Source: NBS Tanzania, May 2026
The chart above illustrates a broadly stable period from April 2025 through mid-2025, followed by a gradual upward trend beginning in late 2025 and accelerating into 2026. The inflation rate, which hovered between 3.2% and 3.5% for most of the year, broke above this band sharply in April 2026.
Section 3
NCPI by Expenditure Group — Full Breakdown
The table below presents the complete NCPI data for all 13 COICOP expenditure divisions, plus selected supplementary indices. Figures compare April 2025, March 2026, and April 2026 index values, along with 1-month and 12-month percentage changes.
Chart 2: 12-Month Inflation Rate by Expenditure Group — April 2026
Annual percentage change, base 2020 = 100
Source: NBS Tanzania, May 2026
#
Expenditure Group
Weight (%)
Apr 2025
Mar 2026
Apr 2026
1-Month Δ
12-Month Δ
1
Food & Non-Alcoholic Beverages
28.2
130.62
136.88
138.12
+0.9%
+5.7%
2
Alcoholic Beverages & Tobacco
1.9
112.14
114.41
114.74
+0.3%
+2.3%
3
Clothing & Footwear
10.8
114.51
115.99
116.35
+0.3%
+1.6%
4
Housing, Water, Electricity, Gas & Other Fuels
15.1
118.90
119.82
120.93
+0.9%
+1.7%
5
Furnishings, Household Equipment & Maintenance
7.9
115.35
117.82
118.35
+0.4%
+2.6%
6
Health
2.5
109.31
110.35
111.03
+0.6%
+1.6%
7
Transport ⚡ Highest inflation
14.1
119.73
124.22
130.68
+5.2%
+9.2%
8
Information & Communication
5.4
106.17
107.20
107.18
0.0%
+1.0%
9
Recreation, Sport & Culture
1.6
111.13
111.65
111.93
+0.3%
+0.7%
10
Education Services
2.0
112.16
113.22
115.03
+1.6%
+2.6%
11
Restaurants & Accommodation Services
6.6
117.08
119.07
119.13
+0.1%
+1.8%
12
Insurance & Financial Services
2.1
102.46
102.57
102.59
0.0%
+0.1%
13
Personal Care, Social Protection & Misc.
2.1
118.05
121.88
122.15
+0.2%
+3.5%
TOTAL – ALL ITEMS INDEX
100.0
119.78
123.04
124.61
+1.3%
+4.0%
Supplementary Index Aggregations
Supplementary Index
Weight (%)
Apr 2025
Mar 2026
Apr 2026
1-Month Δ
12-Month Δ
Core Index
73.9
115.66
117.96
119.29
+1.1%
+3.1%
Non-Core Index
26.1
131.47
137.45
139.73
+1.7%
+6.3%
Energy, Fuel & Utilities Index ⚡
5.7
134.05
134.36
141.15
+5.1%
+5.3%
Services Index
37.2
112.54
114.99
117.07
+1.8%
+4.0%
Goods Index
62.8
124.07
127.80
129.09
+1.0%
+4.0%
Education Services & Products Index
4.1
114.37
115.22
116.02
+0.7%
+1.4%
All Items Less Food & Non-Alcoholic Beverages
71.8
115.53
117.60
119.31
+1.5%
+3.3%
Source: NBS Tanzania — NCPI Press Release, 8 May 2026
Section 4
Food & Non-Alcoholic Beverages Inflation: 5.7%
Food inflation rose to 5.7% year-on-year in April 2026, up from 5.5% in March 2026. With a basket weight of 28.2%, food is the single largest expenditure category and a critical driver of headline inflation. The 1-month increase of 0.9% suggests continued upward momentum. Non-food inflation (all items excluding food & non-alcoholic beverages) rose sharply to 3.3% from 2.1% in March, reflecting the pass-through of fuel costs into the broader economy.
The Core Index — which excludes volatile unprocessed food, energy, and utilities (with the exception of maize flour) — rose to 3.1% in April 2026, up markedly from 2.2% in March 2026. Covering 297 items representing 73.9% of the total NCPI weight, core inflation is widely regarded as a better indicator of underlying structural price trends.
The acceleration in core inflation is particularly significant from a policy standpoint: it signals that inflationary pressure is no longer confined to volatile categories like food and fuel, but is becoming more entrenched across the broader economy. This is the metric the Bank of Tanzania watches most closely.
Chart 4: Core vs Non-Core vs Headline Inflation — April 2026
12-month percentage change | 2020 = 100
Source: NBS Tanzania, May 2026
🏦
Monetary policy signal: With core inflation rising from 2.2% to 3.1% in one month, the Bank of Tanzania may face growing pressure to tighten monetary conditions. Investors and businesses should monitor the next Monetary Policy Committee statement for guidance on the interest rate outlook.
Section 6
Monthly Change: March to April 2026
The overall NCPI increased by 1.3% between March and April 2026 (from 123.04 to 124.61). This monthly jump — larger than any single-month movement in the preceding 12 months — is primarily attributable to the dramatic fuel price increases. The non-food sectors most affected are listed below.
Chart 5: Key Non-Food Price Increases — March to April 2026 (Monthly % Change)
Tanzania CPI March 2026: Inflation Holds at 3.2% | TICGL Economic Intelligence
TICGL Economic Intelligence · Official NBS Data
Tanzania Inflation Holds Steady at 3.2% in March 2026
📅 Published: 8 April 2026📊 Source: National Bureau of Statistics (NBS), Tanzania🗂️ Reference: NCPI (2020 = 100)
Headline Inflation
3.2%
Year-on-year, March 2026
Unchanged vs Feb 2026
Food Inflation
5.5%
Food & Non-Alcoholic Beverages
↓ from 5.7% in Feb 2026
Core Inflation
2.2%
Excludes volatile items
↑ from 2.1% in Feb 2026
Overall NCPI
123.04
Index value (2020 = 100)
↑ from 119.27 (Mar 2025)
Monthly Change
+0.8%
Feb 2026 → Mar 2026
↑ from 122.01
Section 1
About the National Consumer Price Index (NCPI)
The NCPI is Tanzania's official measure of consumer price changes, compiled by the National Bureau of Statistics (NBS) and released monthly.
🛒 Basket Composition
383 goods and services in total — comprising 132 food and non-alcoholic beverage items and 251 non-food items. Prices are collected from all 26 regional headquarters on the Tanzanian mainland.
⚖️ Weights & Reference Period
Weights are derived from the 2017/18 Household Budget Survey, covering both urban and rural households across all 26 mainland regions. The base price reference period is January–December 2020 (index = 100).
🗂️ Classification
The NCPI follows the UN COICOP 2018 framework, disseminated across 13 divisions. Supplementary indices include: Core, Non-Core, Energy/Fuel/Utilities, Services, Goods, Education, and All Items Less Food.
📐 Compilation Method
Elementary aggregates use the geometric mean of price relatives. Higher-level aggregates use the Lowe Index formula (a type of Laspeyres index), providing a consistent and internationally comparable measure.
Section 2
Annual Headline Inflation: March 2026 at 3.2%
The headline rate remained unchanged from February 2026, indicating stable overall price conditions. The overall NCPI climbed from 119.27 in March 2025 to 123.04 in March 2026.
Key Finding: Tanzania's headline inflation rate has remained remarkably stable, fluctuating within a narrow band of 3.2% to 3.6% over the 12 months from March 2025 to March 2026. This stability reflects disciplined monetary conditions even as food prices remain elevated.
NCPI Index Value & Annual Inflation Rate — Mar 2025 to Mar 2026
12-Month Inflation by Category (%)
Annual percentage change, March 2026 vs March 2025
Monthly Change by Category (%)
February 2026 to March 2026
Section 3
NCPI by Division — Full Table (2020 = 100)
Detailed index values and inflation rates for all 13 COICOP divisions and supplementary indices as of March 2026.
#
Division / Category
Weight (%)
Mar 2025
Feb 2026
Mar 2026
1-Month %
12-Month %
Weight Share
Source: National Bureau of Statistics (NBS), Tanzania — NCPI Press Release, 8 April 2026.
Section 4
Supplementary Price Indices
The NBS also publishes several supplementary aggregations that provide deeper insight into price dynamics across different segments of the economy.
Core vs Non-Core Inflation
12-month rate, March 2026
Goods vs Services Inflation
12-month rate, March 2026
Supplementary Indices — Full Detail
Index
Weight (%)
Mar 2025
Feb 2026
Mar 2026
1-Month %
12-Month %
Core Inflation (2.2%) excludes unprocessed food, energy, and utilities (except maize flour) — covering 297 items representing 73.9% of the basket. Its slight uptick from 2.1% in February signals modest underlying price pressure. Meanwhile, Non-Core Inflation (5.6%) — driven largely by food and energy — continues to be the dominant force behind overall price increases.
Section 5
Monthly Price Drivers: Feb → Mar 2026
The NCPI rose from 122.01 to 123.04 (+0.84%) between February and March 2026. The increase was driven by both food and non-food items.
🌾 Food Items — Price Increases
🏠 Non-Food Items — Price Increases
Top Food Price Movers — Monthly Change (%)
Section 6
Upcoming NCPI Release Schedule
The NBS publishes monthly CPI data. Analysts and investors can plan around the following confirmed release dates.
April 2026
8 May 2026
Scheduled release date for April 2026 NCPI data
May 2026
8 June 2026
Scheduled release date for May 2026 NCPI data
June 2026
8 July 2026
Scheduled release date for June 2026 NCPI data
Related TICGL Economic Resources
Explore more research, data, and analysis on Tanzania's economy from TICGL.
A closer look at each of the 13 COICOP divisions — how each category has moved over the past month and year, with weight significance and trend signals.
High Inflation (>3.5%)Moderate Inflation (1.5–3.5%)Low Inflation (<1.5%)
Section 8
Inflation Trend Analysis — 13-Month Review
Breaking down the evolution of Tanzania's price environment from March 2025 to March 2026 across the three key inflation measures: Headline, Core, and Food.
Headline vs Core vs Food Inflation — Monthly Trend (%)
Inflation Rate Distribution
How frequently each inflation band occurred (Mar 2025–Mar 2026)
Monthly Index Movement
Month-on-month NCPI change (absolute points)
Phase 1 — Stability (Mar–Oct 2025): The NCPI hovered between 119.27 and 120.18 for 8 consecutive months — an unusually tight range reflecting subdued demand-side pressures, stable exchange rates, and contained import costs. Headline inflation drifted between 3.2% and 3.5%.
Phase 2 — Acceleration (Nov 2025–Mar 2026): The index shifted upward from 120.01 to 123.04 — a gain of 3.03 index points in just 5 months. Food and energy prices, particularly cassava, potatoes, diesel, and charcoal, became the dominant drivers of this acceleration.
Energy prices exerted significant upward pressure in March 2026, with several fuel types posting sharp monthly gains. This matters greatly for transport costs, manufacturing, and household welfare.
Energy & Fuel Index: +2.1% Monthly | +2.1% Annually
The Energy, Fuel and Utilities Index rose sharply from 131.61 in February to 134.36 in March 2026 — a monthly jump of 2.1 points. On an annual basis, it also recorded 2.1% growth from 131.58 in March 2025.
Energy Index Mar 2026
134.36
Base 2020 = 100
Monthly Change
+2.1%
Feb → Mar 2026
Annual Change
+2.1%
Mar 2025 → Mar 2026
Index Weight
5.7%
Share of total NCPI
Monthly Price Change — Key Energy & Fuel Items
Percentage change, February to March 2026
Energy Index Trend — Mar 2025 to Mar 2026
Index value (2020 = 100), estimated monthly path
Diesel (+4.7%) and charcoal (+4.1%) were the largest energy price movers in March 2026. Diesel prices directly affect freight costs, public transport fares, and agricultural input delivery — meaning the impact radiates across virtually all sectors. Charcoal's increase hits lower-income urban households hardest, as it remains the dominant cooking fuel for millions of Tanzanians.
Section 10
Food & Nutrition Security — Price Signals
At 5.5% annual inflation, food prices remain the primary driver of household cost-of-living pressure in Tanzania. Here we examine which staples are under pressure and what this means for food security.
Staple Food Price Changes — Monthly (%)
Core staple grains and roots, Feb → Mar 2026
Protein Sources — Monthly Price Change (%)
Meat, fish, dairy, and legumes, Feb → Mar 2026
Food Inflation by Sub-Category — Severity Matrix
Food Sub-Category
Key Items Rising
Monthly Change Range
Severity
Household Impact
Roots & Tubers
Fresh cassava, Irish potatoes, sweet potatoes
+4.5% to +8.2%
🔴 High
Critical — key calorie sources for rural & urban poor
Fish & Seafood
Dried sardines, fresh fish
+2.4% to +4.3%
🟠 Elevated
High — protein affordability under pressure
Fresh Produce
Fruits, vegetables
+3.8%
🟠 Elevated
Moderate-high — seasonal variability expected
Cereals & Grains
Rice, sorghum, maize, finger millet
+1.3% to +2.6%
🟡 Moderate
Moderate — basis of most Tanzanian meals
Flours & Processed Grains
Cassava flour, sorghum flour, maize flour
+1.0% to +2.5%
🟡 Moderate
Moderate — processed forms lag raw grain prices
Legumes
Dried beans, lentils, peas
+0.3% to +1.9%
🟢 Low-Moderate
Low — important affordable protein alternative
Bread & Bakery
Bread, bakery products
+1.3%
🟢 Low-Moderate
Low — urban consumption staple
Dairy
Raw milk of cattle
+0.6%
🟢 Low
Low — relatively stable price environment
Section 11
Investment & Business Implications
What does Tanzania's March 2026 inflation data mean for businesses, investors, and policy analysts? TICGL breaks down the key signals by sector.
✅ Stable Signal
🏦
Monetary & Macro Stability
Headline inflation at 3.2% — unchanged for two consecutive months — signals that the Bank of Tanzania's monetary stance is broadly effective. The narrow 3.2%–3.6% range over 13 months indicates a well-anchored inflation environment, reducing the probability of emergency rate hikes and providing a stable backdrop for long-term investment planning.
⚠️ Monitor Closely
🌾
Agri-Food Sector
Food inflation at 5.5% and rising prices for cassava (+8.2%), potatoes (+5.1%), and sardines (+4.3%) point to supply-side constraints. Investors in food processing, cold chain logistics, and agricultural inputs should expect continued cost pressure on raw materials. Margins may narrow unless hedging strategies or local sourcing arrangements are in place.
⚠️ Risk Flag
⛽
Transport & Logistics
Transport inflation stands at 4.2% year-on-year with diesel surging +4.7% in March alone. Companies relying on road freight, last-mile delivery, or fuel-intensive operations face direct margin compression. Fuel cost clauses in contracts and fuel efficiency investments become more critical in this environment.
💡 Opportunity
🏘️
Real Estate & Housing
Housing, water, electricity and gas inflation at just 1.6% annually is among the lowest of all categories. Combined with core inflation at 2.2%, this suggests the real cost of property holding remains relatively stable — creating a potentially favourable window for real estate acquisition and development finance.
👁️ Watch
📡
ICT & Digital Economy
Information and communication recorded just 1.0% annual inflation and 0.0% monthly change — the most price-stable sector in the entire NCPI basket. This reflects competitive telecoms markets and declining hardware costs. For digital-first businesses operating in Tanzania, input cost inflation is minimal.
💡 Opportunity
🍽️
Food Service & Hospitality
Restaurants and accommodation services posted 2.1% annual inflation and a modest +0.4% monthly rise. While food input costs are rising, the relatively contained service-side inflation suggests businesses have not yet passed through full cost increases to consumers — creating a potential price adjustment window for operators.
✅ Positive
💳
Financial Services
Insurance and financial services posted just 0.3% annual inflation — the lowest of any NCPI division. This ultra-stable pricing environment, combined with moderate headline inflation, suggests real returns on financial instruments remain positive and the sector is not under inflationary distortion.
👁️ Watch
👗
Retail & Consumer Goods
Clothing and footwear at 1.3% annual inflation, furnishings at 2.3%, and personal care at 3.3% — the goods sector overall at 3.6% — indicate moderate retail price pressure. Importers face currency and freight pass-through risks, while domestic producers benefit from the relatively stable core goods environment.
📊 Tanzania Inflation Sector Scorecard — March 2026
🏆 Most Price-Stable SectorInformation & Communication — 1.0% (annual)
⚡ Sharpest Monthly MoverNon-Core Index — +2.3% (Feb→Mar)
🔒 Most Stable MonthlyInformation & Communication — 0.0%
⚖️ Core Inflation Trend2.2% — Slightly Rising (+0.1pp vs Feb)
🧮 Goods vs Services GapGoods 3.6% vs Services 2.4% — 1.2pp spread
🌍 Headline Inflation Verdict3.2% — Stable, Low by Regional Standards
TICGL Assessment: Tanzania's March 2026 inflation profile reflects a broadly manageable price environment with localised stress in food and energy. The 13-month stability of headline inflation between 3.2%–3.6% is a positive signal for the investment climate. However, the sustained 5.5% food inflation and sharp monthly moves in cassava (+8.2%), diesel (+4.7%), and charcoal (+4.1%) warrant monitoring — particularly for businesses and households most exposed to these categories. Core inflation ticking up to 2.2% from 2.1% deserves attention in coming months.
Section 12
Frequently Asked Questions — Tanzania CPI March 2026
Key questions from analysts, investors, and policy researchers about Tanzania's inflation data.
What does 3.2% headline inflation mean for Tanzania in regional context?
+
Tanzania's 3.2% headline inflation rate is considered moderate and relatively low by Sub-Saharan African standards. Many regional peers — including Kenya, Uganda, Zambia, and Zimbabwe — have experienced significantly higher inflation in recent years driven by currency depreciation, fuel cost pass-through, and post-COVID supply disruptions. Tanzania's relatively contained inflation reflects a combination of managed exchange rate policy, subdued domestic demand growth, and the structure of the NCPI basket, which assigns a relatively modest weight (28.2%) to food compared to some other African CPI baskets. For foreign investors, 3.2% headline inflation — held stable for two consecutive months — is a positive signal for the predictability of the operating environment.
Why is food inflation so much higher than the headline rate?
+
Food and non-alcoholic beverages inflation at 5.5% is 2.3 percentage points above the headline rate of 3.2%. This divergence reflects several forces: (1) Seasonal supply disruptions affecting roots and tubers such as cassava (+8.2%) and Irish potatoes (+5.1%); (2) Climate-related variability affecting both yield and transport costs for perishables like fruits and vegetables (+3.8%); (3) Higher fuel costs (diesel +4.7%) increasing the cost of transporting food from production areas to urban markets; (4) Fish supply constraints leading to dried sardines rising 4.3% in a single month. Because food represents a larger share of spending for lower-income households than the NCPI weight of 28.2% suggests, the effective experienced inflation for many Tanzanian households — particularly the poor — is likely closer to the food inflation rate than the headline figure.
What is the difference between Core and Non-Core inflation?
+
Core inflation (2.2%) excludes items with volatile prices — specifically unprocessed food, energy, and utilities (with the exception of maize flour). It covers 297 items representing 73.9% of the total NCPI weight. Core inflation is the measure that central banks and policymakers typically focus on because it strips out temporary supply-side shocks and provides a clearer picture of underlying demand-driven price trends. Non-Core inflation (5.6%) includes precisely those volatile categories — food and energy — and therefore tends to move more sharply from month to month. The 3.4 percentage point gap between Non-Core (5.6%) and Core (2.2%) in March 2026 tells us that virtually all of Tanzania's inflation pressure is coming from supply-side food and energy shocks rather than from broad-based demand overheating. This is an important distinction for monetary policy: demand-driven inflation requires interest rate increases to cool; supply-side inflation is better addressed through supply chain, agricultural, and energy policy interventions.
How should businesses adjust their pricing strategies given these inflation figures?
+
Businesses should differentiate their response based on their sector's inflation exposure. (1) Food sector businesses face genuine raw material cost increases and should review their hedging and local sourcing arrangements — delay in adjusting sale prices may compress margins significantly, particularly with cassava, potato, and fish inputs. (2) Transport-dependent businesses must account for the 4.7% monthly diesel increase in their cost models immediately. (3) Businesses in the ICT, financial services, and recreation sectors are in a benign environment with low inflation exposure — competitive pricing strategies can be maintained without significant cost pressure. (4) General consumer-facing businesses should note that real purchasing power for Tanzanian households is being eroded by food prices — this may affect discretionary spending. Overall, businesses with supply chains most exposed to food staples and fuel should act swiftly, while those in stable-inflation sectors have more flexibility.
When will the next Tanzania CPI data be released?
+
The National Bureau of Statistics (NBS) of Tanzania releases NCPI data monthly on the 8th of the following month (or the nearest working day). The confirmed upcoming release schedule is: April 2026 data on 8 May 2026; May 2026 data on 8 June 2026; June 2026 data on 8 July 2026. Data is published on the NBS website at www.nbs.go.tz and TICGL provides in-depth analysis of each release on its economic intelligence platform at ticgl.com. Sign up to the TICGL Researcher Program to receive alerts when new releases are analysed.
What is the NCPI base year and why does it matter?
+
The NCPI uses 2020 as its reference year (index = 100). This means that the March 2026 index value of 123.04 indicates that the cost of the representative basket of goods and services has increased by approximately 23% since the average price level of 2020. The choice of base year matters because it anchors all comparisons. The weights used in the NCPI are derived from the 2017/18 Household Budget Survey — this is worth noting because consumer spending patterns may have shifted since then. A rebasing exercise (updating both the weights and the reference year) would provide a more accurate reflection of current Tanzanian household consumption patterns. The NBS is aware of this and periodically conducts such exercises. Users of the NCPI should bear in mind that the basket composition and weights reflect a 2017/18 consumption pattern, which may underweight certain modern expenditure categories such as mobile data, digital services, or changed food preferences.
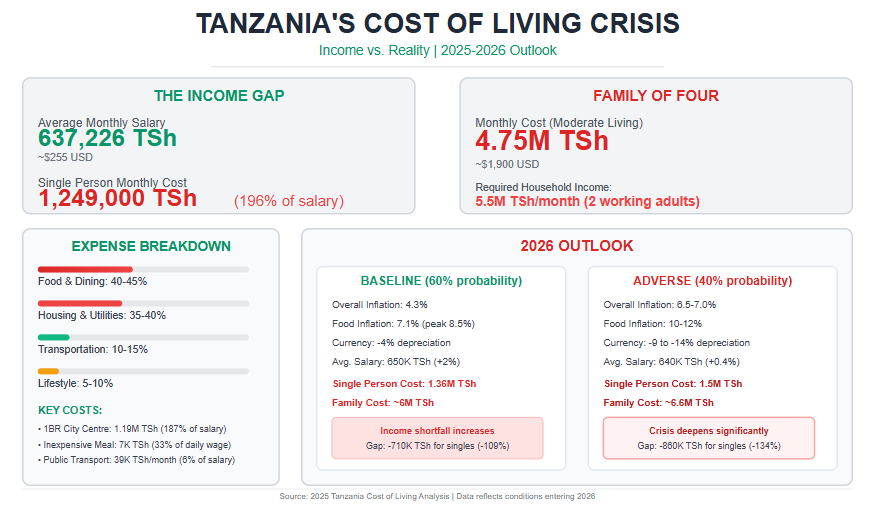
The cost of living has become one of the most pressing economic realities shaping everyday life in Tanzania. While the country continues to post relatively strong macroeconomic indicators—such as GDP growth of 5.6% in 2025—these headline figures mask a growing disconnect between household incomes and the actual cost of meeting basic needs. For millions of Tanzanians, especially salaried workers, small entrepreneurs, and urban households, affordability is no longer just a concern—it is a structural challenge.
According to the 2025 Cost of Living Analysis, Tanzania remains 61.2% cheaper overall than the United States, with rent costs approximately 78.3% lower. However, this international comparison obscures a more critical domestic reality: local wages have not kept pace with the rising cost of housing, food, utilities, and essential services.
In 2025, the average monthly salary is estimated at 637,226 Tanzanian Shillings (TSh). Against this income, the estimated monthly cost of living for a single person—excluding rent—stands at 1,152,096 TSh, while a family of four requires approximately 4.1 million TSh per month to meet basic needs.
This means that even before accounting for rent, the average worker earns less than half of what is required to sustain a modest standard of living.
Where the Pressure Is Coming From
Food and dining account for the largest share of household expenditure, consuming 40–45% of monthly income. A simple inexpensive meal costs around 7,000 TSh, equivalent to 33% of an average daily wage, while a mid-range meal for two can exceed 50,000 TSh, or more than two full days of income for many workers.
Even staple grocery items—though relatively affordable individually—accumulate into a significant monthly burden, especially for families.
Housing costs present an even deeper structural challenge. Renting a one-bedroom apartment in a city centre costs approximately 1.19 million TSh per month, representing 187% of the average monthly salary. Even outside city centres, rent for a modest one-bedroom unit consumes over 70% of average income, while three-bedroom family housing exceeds total earnings entirely.
Utilities and internet add a further 300,000 TSh per month, reinforcing the affordability gap.
Transportation remains relatively affordable—public transport costs around 39,000 TSh per month, or about 6% of salary—but private vehicle ownership is increasingly out of reach, with the cost of a new compact car equivalent to nearly 70 months of income.
The Bigger Picture: Living Costs vs. Earnings
When all expenses are combined, a budget-conscious single person requires approximately 1.25 million TSh per month, nearly double the average salary. For a family of four, sustainable living requires a household income of 4.8–5.5 million TSh per month, typically achievable only with two high-earning adults or external income sources.
This growing income–cost gap explains rising household debt, reduced savings, informal coping strategies, and increasing vulnerability among urban populations. It also places pressure on businesses, as workers demand higher wages while firms face higher operating costs.
Looking Ahead to 2026: What to Expect
The outlook for 2026 presents both risk and uncertainty. Under the baseline scenario—where political and economic conditions stabilize—overall inflation is projected to rise to 4.3%, with food inflation averaging 7.1% and peaking as high as 8.5% mid-year. The Tanzanian Shilling is expected to depreciate by about 4%, pushing up the cost of imported goods, fuel, and agricultural inputs.
In this scenario, average monthly salaries are projected to rise marginally to around 650,000 TSh, while the monthly cost of living for a single person climbs to 1.36 million TSh—deepening the affordability gap rather than closing it. Families would require close to 6 million TSh per month to maintain a moderate standard of living.
Under an adverse scenario, characterized by prolonged political or economic disruptions, inflation could rise to 6.5–7.0%, food prices could increase by 10–12%, and the currency could depreciate by up to 14%. This would push the monthly cost of living for a single person to 1.5 million TSh, while families could face costs exceeding 5.7 million TSh, further increasing poverty and inequality.
Why This Matters
The data sends a clear message: Tanzania’s cost-of-living challenge is no longer about prices alone—it is about income adequacy, economic structure, and policy choices. Without deliberate action on wages, housing supply, food systems, and productivity, economic growth risks becoming disconnected from lived reality. As the country looks toward 2026 and beyond, addressing the cost of living is not just an economic necessity—it is a social and political imperative.
Tanzania offers a significantly lower cost of living compared to the United States, making it an affordable destination for both residents and expatriates. The data shows Tanzania is 61.2% cheaper overall than the US, with rent being 78.3% lower. More on This Topic:Will Tanzania's Robust Central Bank Position Ensure Continued Growth Through 2026?
Monthly Budget Overview
Household Type
Monthly Cost (Excluding Rent)
USD Equivalent*
Family of Four
4,110,219 TSh
~$1,644
Single Person
1,152,096 TSh
~$461
*Based on approximate exchange rate of 2,500 TSh = 1 USD
Detailed Cost Breakdown by Category
1. Food & Dining (40-45% of monthly expenses)
Restaurant Dining
Item
Average Cost
Price Range
% of Daily Wage**
Inexpensive Meal
7,000 TSh
3,000-15,000
33%
Mid-Range Meal (2 people)
50,000 TSh
30,000-120,000
235%
Fast Food Combo
20,000 TSh
15,000-25,000
94%
Cappuccino
5,149 TSh
2,000-7,500
24%
Local Beer (0.5L)
2,500 TSh
2,000-5,000
12%
**Based on average daily wage of ~21,241 TSh (637,226/30 days)
Market/Grocery Costs
Category
Item
Cost
Budget Impact
Staples
White Rice (1kg)
2,711 TSh
Low
Fresh Bread (500g)
1,986 TSh
Low
Eggs (12)
5,291 TSh
Low
Protein
Chicken (1kg)
12,346 TSh
Medium
Beef (1kg)
10,500 TSh
Medium
Local Cheese (1kg)
22,125 TSh
High
Produce
Bananas (1kg)
2,527 TSh
Low
Tomatoes (1kg)
2,406 TSh
Low
Apples (1kg)
6,167 TSh
Medium
Weekly grocery budget for single person: ~60,000-80,000 TSh (26-35% of monthly food costs)
2. Housing & Utilities (35-40% of monthly expenses)
Rental Costs
Type
Location
Monthly Rent
Annual Cost
% of Avg Salary
1-Bedroom
City Centre
1,194,740 TSh
14,336,880
187%
1-Bedroom
Outside Centre
452,967 TSh
5,435,604
71%
3-Bedroom
City Centre
2,060,000 TSh
24,720,000
323%
3-Bedroom
Outside Centre
822,208 TSh
9,866,496
129%
Key Insight: Living outside the city centre saves approximately 62% on rent for 1-bedroom apartments and 60% for 3-bedroom apartments.
Monthly Utilities (85m² Apartment)
Service
Average Cost
Range
% of Rent (1BR Outside)
Electricity, Water, Gas, Garbage
181,593 TSh
120,000-300,000
40%
Internet (60+ Mbps)
99,923 TSh
50,000-150,000
22%
Mobile Phone (10GB+)
28,294 TSh
10,000-50,000
6%
Total Utilities
309,810 TSh
-
68%
3. Transportation (10-15% of monthly expenses)
Transport Type
Cost
Monthly Impact
Public Transport
One-way ticket: 650 TSh
Monthly pass: 39,000 TSh
6% of salary
Private Transport
Gasoline (1L): 2,979 TSh
New Compact Car: 44,297,674 TSh
69.5 months salary
Taxi Services
Start fare: 4,000 TSh
Per km: 4,000 TSh
Budget Recommendation: Public transport is highly affordable at 39,000 TSh/month. For car owners, factor in ~50,000-80,000 TSh monthly for fuel (based on average commuting).
4. Lifestyle & Recreation (5-10% of monthly expenses)
Category
Item
Cost
Affordability
Fitness
Gym Membership
145,556 TSh
23% of salary
Entertainment
Cinema Ticket
12,000 TSh
2% of salary
Tennis Court (1hr)
16,250 TSh
3% of salary
Clothing
Jeans (Levi's)
39,375 TSh
6% of salary
Running Shoes
83,571 TSh
13% of salary
5. Childcare & Education (Variable, can be 30-50% for families)
Service
Annual Cost
Monthly Equivalent
% of Annual Salary
Preschool/Kindergarten
18,617,766 TSh
1,551,480 TSh
243%
International Primary School
31,434,444 TSh
2,619,537 TSh
411%
Critical Note: International schooling is extremely expensive relative to local salaries, typically requiring expatriate-level income or significant family savings.
Monthly Budget Examples
Single Person (Budget-Conscious)
Expense Category
Monthly Cost
% of Total
Rent (1BR outside centre)
450,000 TSh
36%
Utilities
310,000 TSh
25%
Food (groceries + occasional dining)
280,000 TSh
22%
Transportation (public)
39,000 TSh
3%
Mobile/Internet
50,000 TSh
4%
Entertainment/Misc
120,000 TSh
10%
TOTAL
1,249,000 TSh
100%
Budget vs Average Salary: 196% (requires income above average)
Family of Four (Moderate Lifestyle)
Expense Category
Monthly Cost
% of Total
Rent (3BR outside centre)
850,000 TSh
18%
Utilities
350,000 TSh
7%
Food (groceries + dining)
1,200,000 TSh
25%
Transportation (car + fuel)
200,000 TSh
4%
Education (2 children, local school)
500,000 TSh
11%
Healthcare/Insurance
300,000 TSh
6%
Entertainment/Misc
350,000 TSh
7%
Savings
1,000,000 TSh
21%
TOTAL
4,750,000 TSh
100%
Household Income Needed: ~4,800,000-5,500,000 TSh/month (2 working adults)
Projected Economic Impact on Cost of Living (2026)
Assumption: Unrest continues into mid-2026, broader sanctions imposed
Economic Indicator
2026 Adverse Projection
Change from Baseline
GDP Growth
4.0%
-1.8%
Overall Inflation
6.5-7.0%
+2.2-2.7%
Food Inflation
10-12%
+2.9-4.9%
Currency (TSh/USD)
2,950-3,100
-9-14% depreciation
FDI Inflows
50% reduction
-$1.5B
Poverty Rate
26% (from 25%)
+1%
Income vs. Cost Gap Analysis (2026)
Current Reality Check
Category
2025
2026 Baseline
2026 Adverse
Average Monthly Salary
637,226 TSh
650,000 TSh (+2%)
640,000 TSh (+0.4%)
Single Person Monthly Costs
1,249,000 TSh
1,360,000 TSh
1,500,000 TSh
Income Shortfall (Single)
-611,774 TSh (-96%)
-710,000 TSh (-109%)
-860,000 TSh (-134%)
Family of Four Costs
4,750,000 TSh
5,175,000 TSh
5,700,000 TSh
Required Household Income
~5,500,000 TSh
~6,000,000 TSh
~6,600,000 TSh
Critical Finding: The average salary falls significantly below estimated costs, with shortfalls ranging from 546,679 TSh for single persons to over 3.6 million TSh for families with one earner.
National Consumer Price Index (NCPI) - Food & Non-Alcoholic Beverages
Report Period: 2021-2025 (Historical) | 2026 (Forecast) Base Year: 2020 = 100 Weight in Consumer Basket: 28.2% Date Prepared: December 2025
Lead Analyst: Amran Bhuzohera
Tanzania’s food inflation landscape has undergone significant fluctuations over the past five years, shaped by global shocks, domestic supply constraints, and structural market inefficiencies. Between 2021 and 2025, food inflation averaged 5.2%, but the trend reveals pronounced volatility—rising from 3.7% in 2021 to a crisis peak of 7.3% in 2022, driven largely by fuel cost surges (energy inflation averaged 9.1% in 2022) and supply chain disruptions. Although 2024 marked a period of exceptional stability with food inflation dropping to 2.1%, households have since faced renewed pressure in 2025 as inflation accelerated sharply to an average of 6.0%. This rise reflects persistent cost-push factors, including elevated transport index levels that climbed from 103.34 (2021) to 121.50 (2025)—a cumulative increase of 17.6%, directly increasing food distribution expenses.
By November 2025, food inflation reached 6.6%, nearly double the national headline inflation of 3.4%, underscoring the disproportionate burden food prices impose on household purchasing power. Food prices have risen cumulatively by 31.5% since the 2020 base year, intensifying affordability challenges, particularly for low-income urban households and regions dependent on purchased food. Unprocessed and food crop categories—which are highly weather-sensitive—remain the most volatile, with swings as wide as 10.2 percentage points between June 2024 (-1.3%) and July 2025 (8.9%). This volatility reflects structural weaknesses such as low agricultural mechanization, post-harvest losses, long supply chains, and limited storage facilities.
Looking ahead, the 2026 forecast indicates continued upward pressure, with food inflation expected to average 7.1%, peaking at 8.5% in July, driven by seasonal supply shortages, lean-season stress, and higher input costs. Critical food categories such as food crops and unprocessed food are projected to hit peaks of 11.0% and 11.5%, respectively. With Tanzania’s population and urbanization steadily growing, combined with elevated energy and transport costs projected to rise to 6.5–8.0% in 2026, food price stability remains a central macroeconomic concern. Close monitoring and policy interventions—particularly in agricultural productivity, logistics, and market efficiency—will be essential to mitigate risks and sustain household welfare. Read More: Tanzania’s Inflation Path in 2025
Key Highlights
Food prices have risen cumulatively by 31.5% since 2020, significantly reducing household purchasing power and widening the gap between food inflation (6.6%) and overall inflation (3.4%) as of November 2025.
2024 was the most stable year with only 2.1% food inflation, but this reversed sharply in 2025, where food inflation averaged ~6.0%, marking a 3.9 percentage-point surge from the previous year.
2022 remains the crisis year, with food inflation peaking at 9.7%, unprocessed food at 12.7%, and food crops at 14.2%, driven by high fuel costs and supply chain disturbances.
Unprocessed and food crop categories remain the most volatile, showing swings of up to 10.2 percentage points between 2024 and 2025 due to climate variability, seasonal shortages, and production instability.
2026 food inflation is forecasted to average 7.1%, with a seasonal high of 8.5% in July, reflecting continued pressure from input costs, transport inflation, and recurring supply-side constraints.
1. HISTORICAL ANALYSIS (2021-2025)
1.1 Five-Year Trend Overview
Year
Average Annual Inflation
Status
Year-on-Year Change
2021
3.7%
Moderate/Baseline
-
2022
7.3%
Very High
+3.6 pp
2023
6.8%
High
-0.5 pp
2024
2.1%
Low/Stable
-4.7 pp
2025 (Jan-Nov)
~6.0%
Rising
+3.9 pp
Key Observation: The data reveals a cyclical pattern with a major spike in 2022, gradual decline through 2023-2024, and a sharp rebound in 2025.
1.2 Food Price Index Evolution
The table below shows how food prices have increased relative to the 2020 base year:
Month
2021
2022
2023
2024
2025
January
100.60
106.99
117.57
119.39
125.77
March
103.93
110.64
121.39
123.05
129.75
June
106.46
112.71
121.49
122.58
131.53
September
103.30
111.89
118.17
121.17
129.70
December
105.90
116.15
118.83
124.27
-
Cumulative Increase
+5.9%
+16.2%
+18.8%
+24.3%
+31.5% (Nov)
Analysis: Food prices have increased by 31.5% cumulatively since the 2020 base year, representing significant erosion of purchasing power for households.
1.3 Crisis Period Analysis - 2022
The year 2022 represented the peak of food inflation pressure:
Category
Peak Inflation Rate
Month Recorded
Food & Non-Alcoholic Beverages
9.7%
December 2022
Unprocessed Food
12.7%
December 2022
Food Crops & Related Items
14.2%
December 2022
Impact: The 2022 crisis saw double-digit inflation in key food categories, severely impacting household budgets and food security.
1.4 Recovery Period - 2023-2024
2023 - Gradual Stabilization:
Started at 9.7% (January) - carryover from 2022 crisis
Ended at 2.3% (December) - significant improvement
Annual average: 6.8%
Pattern: Steady monthly decline throughout the year
2024 - Exceptional Stability:
Annual average: 2.1% - the lowest in the five-year period
Monthly range: 0.9% (June) to 4.6% (December)
Food crops showed negative inflation (-0.4%) - actual price decreases
This period represented optimal conditions for food affordability
1.5 Current Situation - 2025
Monthly Inflation Rates - 2025:
Jan
Feb
Mar
Apr
May
Jun
Jul
Aug
Sep
Oct
Nov
5.3%
5.0%
5.4%
5.3%
5.6%
7.3%
7.6%
7.7%
7.0%
7.4%
6.6%
Key Characteristics:
Consistency: All months above 5% - no relief periods
Peak Period: June-August showing 7.3-7.7%
Acceleration: Sharp increase from 2024's 2.1% to current 6.0%
Pattern: Mid-year peaks align with seasonal agricultural cycles
2. CATEGORY BREAKDOWN ANALYSIS
2.1 Food Categories Performance
Category
2022 Peak
2023 Avg
2024 Avg
2025 (Nov)
Volatility
Food & Non-Alcoholic Beverages
9.7%
6.8%
2.1%
6.6%
High
Food Crops & Related Items
14.2%
11.3%
-0.4%
5.4%
Very High
Unprocessed Food
12.7%
9.5%
0.3%
7.0%
Very High
Processed Food (implied)
~6-7%
~5%
~3%
~6%
Moderate
2.2 Most Volatile Components
Unprocessed Food - 2024-2025 Volatility:
Period
Inflation Rate
Change
June 2024
-1.3%
Price decreases
July 2025
8.9%
Sharp spike
Total Swing
10.2 percentage points
Extreme volatility
Food Crops Index - Monthly Pattern:
Month
2024
2025
Difference
January
0.7%
-1.5%
-2.2 pp
April
0.8%
-0.9%
-1.7 pp
July
-0.9%
3.5%
+4.4 pp
November
-4.0%
5.4%
+9.4 pp
Insight: Food crops show extreme seasonal and year-to-year variations, making them the primary driver of overall food inflation volatility.
2.3 Comparison with Overall Inflation
Measure
Food Inflation
Overall (All Items) Inflation
Gap
November 2025
6.6%
3.4%
+3.2 pp
2025 Average
~6.0%
~3.3%
+2.7 pp
Critical Finding: Food inflation is running at nearly DOUBLE the overall inflation rate, indicating specific supply-side pressures in the food sector.
3. UNDERLYING FACTORS & CHALLENGES
3.1 Cost-Push Factors
Energy & Fuel Impact:
Year/Period
Energy & Fuel Inflation
Impact on Food
2022
9.1% annual average
High transport costs
2023
2.3% annual average
Stabilizing
2024
9.3% annual average
Rising pressure
2025 (Nov)
3.8%
Moderate pressure
Transport Costs:
Index Level
2021
2022
2023
2024
2025 (Nov)
Transport Index
103.34
109.63
112.72
117.42
121.50
Year-on-Year Change
-
+6.1%
+2.8%
+4.2%
+3.5%
Impact: Rising energy and transport costs directly increase food distribution expenses, passed on to consumers.
3.2 Supply-Side Challenges
Agricultural Production Instability:
Climate Dependency: Sharp swings in unprocessed food prices correlate with seasonal rainfall patterns
Post-Harvest Losses: Infrastructure gaps lead to wastage and supply constraints
Input Costs: Fertilizer and seed prices remain elevated
Infrastructure: Poor rural roads increase transport costs
3.3 Demand-Side Factors
Factor
Impact Level
Description
Population Growth
Medium
Steady demand increase 2-3% annually
Urbanization
Medium
Shift to purchased food vs subsistence
Income Growth
Low-Medium
Changing consumption patterns
Dietary Changes
Low
Gradual shift to processed foods
4. IDENTIFIED PROBLEMS & RISKS
4.1 Current Critical Issues
Problem
Evidence
Severity
Trend
Persistent High Inflation
6+ consecutive months above 6.5% in 2025
HIGH
Worsening
Extreme Volatility
Unprocessed food: -1.3% to +8.9% swing
HIGH
Stable
Energy Cost Pressure
Fuel inflation 3.5-7.9% range
MEDIUM
Fluctuating
Food-Overall Gap
Food 6.6% vs Overall 3.4%
MEDIUM-HIGH
Widening
Seasonal Vulnerability
Consistent Jun-Aug peaks
MEDIUM
Predictable
5. 2026 FORECAST - DETAILED PROJECTIONS
5.1 Base Case Monthly Forecast - 2026
Detailed Monthly Projections:
Month
Forecast
Range
Key Drivers
Risk Level
January
6.8%
6.5-7.0%
Post-holiday demand, carryover from 2025
Medium
February
6.2%
5.8-6.5%
Pre-harvest tightening, seasonal low
Medium
March
6.5%
6.2-6.8%
Supply anticipation, input cost increases
Medium
April
7.0%
6.7-7.3%
Lean season begins, stocks depleting
Medium-High
May
7.5%
7.2-7.8%
Peak lean season, pre-harvest price spikes
Medium-High
June
8.0%
7.5-8.5%
Supply tightening, early harvest delays
High
July
8.5%
8.0-9.0%
ANNUAL PEAK - typical seasonal high
High
August
8.0%
7.5-8.5%
New harvest begins, gradual easing
High
September
7.2%
6.8-7.5%
Harvest supplies increase, prices moderate
Medium-High
October
6.8%
6.5-7.2%
Post-harvest stabilization
Medium
November
6.5%
6.2-6.8%
Abundant supply, festival demand
Medium
December
6.8%
6.5-7.2%
Year-end demand, holiday effects
Medium
Quarterly Summary:
Quarter
Average
Peak
Status
Q1 2026
6.5%
6.8% (Jan)
Moderate start
Q2 2026
7.5%
8.0% (Jun)
Rising pressure
Q3 2026
7.9%
8.5% (Jul)
CRITICAL PERIOD
Q4 2026
6.7%
6.8% (Oct/Dec)
Stabilizing
ANNUAL
7.1%
8.5% (Jul)
Moderate-High
5.2 Category-Specific Forecasts
Food Categories - 2026 Projections:
Category
Annual Avg
Peak Month
Volatility
Key Factors
Food & Non-Alcoholic Beverages
7.1%
8.5% (Jul)
High
Overall basket driver
Food Crops
8.5%
11.0% (Jul)
Very High
Weather dependency
Unprocessed Food
9.0%
11.5% (Jul-Aug)
Very High
Seasonal production
Processed Food
5.5%
6.5% (Jun)
Moderate
Input cost driven
Restaurants/Accommodation
4.5%
5.0% (Dec)
Low
Service component
Other Influential Categories:
Category
2026 Forecast
Impact on Food
Energy & Fuel
6.5-8.0%
High - transport costs
Transport
4.0-5.0%
High - distribution
Housing/Utilities
4.5-5.5%
Medium - overhead costs
Tanzania's food and non-alcoholic beverages inflation rose to 7.7% in August 2025, up from 7.6% in July, reflecting a year-on-year price increase in this category, which holds the largest CPI weight of 28.2%. The food index climbed from 121.12 in August 2024 to 130.48 in August 2025, though it remained nearly flat month-to-month (130.47 to 130.48), buoyed by price drops in staples like maize (-1.9%) and vegetables (-1.8%). This stability masks underlying pressures from agricultural supply challenges, impacting 25-30% of GDP and threatening household affordability, especially for the 57% of households citing food costs as a major concern in 2024.
Food and Non-Alcoholic Beverages Inflation
Weight in CPI basket: 28.2% (largest share).
Annual inflation (Aug 2025 vs Aug 2024):7.7%, compared to 7.6% in July 2025.
Index values:
Aug 2024: 121.12
July 2025: 130.47
Aug 2025: 130.48
This means that on average, the prices of food and non-alcoholic beverages increased by 7.7% over the year.
Food Items Driving the Change (July → August 2025)
Even though annual food inflation was high, the monthly food index was almost flat (0.0%), because prices of some items went down, offsetting increases in others. Items that recorded price decreases include:
Maize grains: -1.9%
Maize flour: -0.3%
Wheat grains: -1.1%
Finger millet grains: -0.5%
Fresh fish: -0.3%
Vegetables: -1.8%
Irish potatoes: -2.7%
Sweet potatoes: -3.3%
Cocoyams: -2.8%
Dried beans: -2.5%
Dried lentils: -4.5%
Dried peas: -2.5%
Cowpeas: -3.4%
Groundnuts: -0.2%
These declines helped stabilize the monthly food inflation despite strong annual growth.
Key Insights
Food is the main inflation driver: At 7.7%, food inflation is more than double the headline inflation (3.4%).
Monthly stability: The food index hardly changed from July to August 2025 (130.47 → 130.48) due to falling prices of several staples.
Volatility: The year-on-year rise shows that food prices have been under upward pressure over the past 12 months, even if short-term prices softened in August.
Summary: Food and non-alcoholic beverages in Tanzania saw 7.7% annual inflation in August 2025, driven mainly by higher year-on-year food costs. However, month-to-month food prices were stable, with declines in staple grains, vegetables, and pulses balancing out other pressures.
Table 1: Food and Non-Alcoholic Beverages Inflation Rate
Period
Food CPI Index (2020=100)
Annual Food Inflation Rate (%)
Monthly Change (%)
August 2024
121.12
-
-
July 2025
130.47
7.6*
-
August 2025
130.48
7.7
0.0
*Note: July 2025 food inflation rate (7.6%) is mentioned in the text as comparison to August 2025 rate.
Table 2: Core Inflation and Other Key Indices (August 2025)
Index Type
Weight (%)
Index Value (2020=100)
Annual Inflation Rate (%)
Core Index
73.9
115.98
2.0
Non-Core Index
26.1
130.51
7.3
Energy, Fuel and Utilities
5.7
130.72
2.6
Services Index
37.2
112.69
0.8
Goods Index
62.8
123.96
4.9
Education Services
4.1
114.32
2.8
All Items Less Food
71.82
115.56
1.6
Key Highlights:
Headline inflation increased to 3.4% in August 2025 from 3.3% in July 2025
Food inflation rose to 7.7% in August 2025 from 7.6% in July 2025
Core inflation increased to 2.0% in August 2025 from 1.9% in July 2025
Monthly CPI declined by 0.1% from July to August 2025
Food and non-alcoholic beverages have the highest weight (28.2%) in the CPI basket
Economic Implications of Food Inflation in Tanzania (August 2025)
In August 2025, Tanzania's food and non-alcoholic beverages inflation reached 7.7%, more than double the headline rate of 3.4%, driven by a year-on-year index rise from 121.12 to 130.48 despite monthly stability (0.0% change from July's 130.47). This category's dominant 28.2% CPI weight amplifies its role in eroding household purchasing power, particularly amid projections of 4.0% overall inflation and 6.0% GDP growth, highlighting vulnerabilities in agriculture and potential poverty exacerbation for low-income groups.
Impact on Households and Poverty
Food inflation disproportionately affects low-income and rural households in Tanzania, where food expenditures can exceed 50% of budgets, compared to the national CPI weight of 28.2%. The 7.7% annual rise in August 2025, up from 7.6% in July and 7.3% in June, intensifies cost-of-living pressures, potentially pushing more households into poverty. In 2024, 57% of households reported food price hikes as a major shock, contributing to intersecting crises like hunger and economic instability. Globally, a 1% food price increase can raise poverty by 0.0001% in low- to middle-income groups, a trend applicable to Tanzania where urban poverty is exacerbated by reduced welfare and access to nutritious food. However, long-term spikes may benefit net food producers, though short-term volatility from weather and supply issues hinders this for subsistence farmers.
Macroeconomic Effects
As the primary inflation driver, food prices at 7.7% in August 2025 elevate the non-core index to 7.3%, contrasting with core inflation's stability at 2.0% (excluding volatiles like unprocessed food). This contributes to headline inflation's slight rise to 3.4%, within the Bank of Tanzania's (BOT) 3-5% target, but risks broader price instability if unchecked. Agriculture, comprising 25-30% of GDP, faces disruptions from weather-induced supply shortages, amplifying import dependencies and exchange rate pressures (USD/TZS around 2,470). Despite this, Tanzania's 6.0% GDP growth projection for 2025 remains robust, supported by mining and services, though persistent food hikes could dampen consumption and widen inequality.
Implication
Key Figure (August 2025)
Broader Effect
Cost of Living
Food Inflation: 7.7%
Reduces real incomes, especially for urban poor; offsets non-food stability (1.6%).
GDP Contribution
Agriculture: 25-30%
Volatility threatens 6.0% growth forecast; potential for welfare gains long-term.
Poverty Risk
Households Affected: ~57% (2024 data)
Exacerbates hunger-poverty nexus in SSA.
Agricultural Sector Challenges
Monthly price declines in staples like maize (-1.9%), vegetables (-1.8%), and tubers (e.g., sweet potatoes -3.3%) provided short-term relief in August 2025, but year-on-year pressures stem from supply disruptions, including weather events and global commodity trends (FAO index up 7.6% annually). These factors, combined with rising input costs, challenge Tanzania's food security recovery post-pandemic, where agriculture employs over 65% of the workforce. Easing global prices offer some buffer, but domestic volatility could hinder export competitiveness and stock buffers (e.g., 557k tonnes noted earlier in 2025).
Policy Responses and Outlook
BOT's cautious accommodative policy for 2025/26, maintaining low rates to anchor inflation while supporting growth, addresses food-driven pressures through liquidity management and reserves (USD 6 billion). Recommendations include agricultural subsidies and infrastructure to mitigate supply shocks. IMF projections of 4.0% inflation suggest moderation, but sustained food hikes risk derailing 6.0% growth, necessitating targeted interventions for inclusive development.
In June 2025, Tanzania’s headline inflation rate stood at 3.3%, a slight increase from 3.2% in May 2025, remaining within the government’s 3–5% target and aligned with SADC/EAC benchmarks. However, the sharp rise in food inflation to 5.6% in May 2025, driven by supply chain disruptions and price spikes in staples like rice (2.5%), maize flour (0.8%), and cassava (4.2%), significantly impacts the cost of living, particularly for low-income households reliant on these goods. While energy and utilities inflation eased to 6.1% from 7.3% a year earlier, housing costs (7.2% annual increase) and non-food items like charcoal (1.5%) continue to strain budgets. With approximately 26% of Tanzanians living below the poverty line and 80% in the informal sector, these price pressures could exacerbate poverty, fuel wage demands, and challenge economic stability, despite a stable core inflation rate of 1.9%.
Key Inflation Metrics (June 2025)
Headline Inflation: The annual headline inflation rate for June 2025 is 3.3%, slightly up from 3.2% in May 2025, but within the Tanzanian government's target range of 3–5% and aligned with Southern African Development Community (SADC) and East African Community (EAC) benchmarks. This indicates relative macroeconomic stability.
Core Inflation: Excluding volatile items like unprocessed food and energy, core inflation decreased to 1.9% in June 2025 from 2.1% in May 2025, reflecting stable prices for non-volatile goods and services.
Food Inflation: Food and non-alcoholic beverages, which constitute 28.2% of the NCPI basket, saw a 3.5% annual price increase in June 2025, up from a 0.7% monthly rise. Specific food items driving this include rice (2.5%), sorghum grains (1.2%), finger millet grains (7.0%), maize flour (0.8%), cooking bananas (3.9%), and dry cassava (4.2%). Food inflation has risen sharply from 1.6% in May 2024 to 5.6% in May 2025, primarily due to transportation disruptions and supply chain challenges.
Energy, Fuel, and Utilities: Inflation in this sector decreased from 7.3% in May 2024 to 6.1% in May 2025, reflecting a decline in global oil prices. However, items like charcoal (1.5%) and diesel (0.7%) still saw monthly price increases in June 2025.
Non-Food Items: Price increases in non-food items, such as garments for men and children (0.2–0.3%), footwear for children (0.3%), household furniture (0.4%), and laptop computers (0.6%), contributed to the overall NCPI rise from 119.85 in May 2025 to 120.18 in June 2025 (a 0.3% monthly increase).
Impact on Cost of Living
Food Price Pressures:
Food and non-alcoholic beverages, with a significant weight of 28.2% in the NCPI, are a major driver of the cost of living, especially for low-income households who allocate a large share of their budgets to food. The 5.6% food inflation rate in May 2025, coupled with specific increases in staples like rice, maize, and cassava, directly raises household expenses.
For example, a 7.0% rise in finger millet grains and 4.2% in dry cassava disproportionately affects rural and low-income households reliant on these staples. This could lead to reduced purchasing power and potential shifts to lower-quality or less nutritious food options, exacerbating food insecurity.
Non-Food and Energy Costs:
While energy inflation has moderated to 6.1%, the rise in charcoal and diesel prices still impacts household budgets, particularly for cooking and transportation. Urban households, reliant on purchased fuels, feel this pinch more acutely.
Non-food items like clothing, footwear, and household goods saw modest increases (e.g., 0.2–0.4%), which cumulatively add to living costs, especially for families with children or those maintaining homes.
Housing and Utilities:
The housing, water, electricity, gas, and other fuels category, with an 18% weight in the NCPI, recorded a 0.4% monthly decrease but a 7.2% annual increase. Rising rental costs (0.3%) and maintenance materials (0.2%) contribute to higher living expenses, particularly in urban areas like Dar es Salaam.
Impact on Poverty Levels
Increased Poverty Risk: The sharp rise in food inflation (5.6%) outpaces headline inflation (3.3%), disproportionately affecting low-income households. According to the World Bank, approximately 26% of Tanzanians lived below the international poverty line ($2.15/day, 2017 PPP) in recent estimates. Higher food prices could push more households into poverty, particularly in rural areas where agriculture is a primary livelihood but supply disruptions increase costs.
Nutritional Impact: Price spikes in staples like maize and rice may force households to reduce consumption or switch to less nutritious alternatives, potentially worsening malnutrition rates, especially among children. Tanzania’s 2022 Demographic and Health Survey reported 30% of children under five are stunted, and rising food costs could aggravate this.
Influence on Wage Demands
Pressure for Higher Wages: The rising cost of living, driven by food and non-food price increases, is likely to spur demands for wage adjustments, particularly in urban areas and formal sectors. Public sector workers and trade unions may push for salary hikes to match the 3.3% headline inflation rate or the higher 5.6% food inflation rate.
Informal Sector Challenges: Over 80% of Tanzania’s workforce is in the informal sector, where income adjustments are less structured. These workers may struggle to cope with rising costs, potentially leading to social unrest or increased reliance on government subsidies.
Economic Stability
Stable Macroeconomic Environment: The headline inflation rate of 3.3% remains within the government’s 3–5% target and aligns with SADC/EAC benchmarks, signaling relative economic stability. The decline in core inflation to 1.9% further supports this, as it indicates controlled price growth in non-volatile sectors.
External Factors: Easing global oil prices have reduced energy inflation, providing some relief to transport and production costs. However, transportation disruptions (e.g., weather-related issues or infrastructure bottlenecks) have driven food inflation, highlighting vulnerabilities in domestic supply chains.
Policy Implications: The Bank of Tanzania is likely to maintain a cautious monetary policy to keep inflation within the target range. However, persistent food price increases may necessitate targeted interventions, such as subsidies for staples or investments in agricultural logistics, to stabilize prices.
Analytical Insights
Sector-Specific Impacts: Food inflation’s dominance reflects Tanzania’s reliance on agriculture and vulnerability to supply shocks. While energy price relief is positive, the overall cost-of-living increase strains household budgets, particularly for the poor.
Poverty and Inequality: The disproportionate impact of food inflation on low-income households could widen inequality, as wealthier households are better equipped to absorb price shocks. This may exacerbate urban-rural disparities, given higher urban exposure to non-food costs like rent and fuel.
Wage Dynamics: Rising costs may fuel labor market tensions, but the informal sector’s dominance limits broad wage adjustments, potentially increasing reliance on social safety nets.
Long-Term Stability: The stable headline inflation rate and declining core inflation suggest effective macroeconomic management, but addressing food supply chain issues is critical to sustaining this stability.
Conclusion
Inflation in Tanzania, at 3.3% in June 2025, remains manageable but masks sector-specific pressures, particularly in food (5.6%), which significantly impacts the cost of living for low-income households. This could exacerbate poverty and malnutrition risks, especially in rural areas. Wage demands are likely to rise, particularly in formal sectors, but the informal economy’s dominance limits broad relief. While macroeconomic stability is maintained, addressing food supply chain disruptions is critical to mitigating cost-of-living pressures and ensuring long-term economic stability. Targeted policies, such as food subsidies or infrastructure improvements, could alleviate these challenges.
Below is a table presenting the Annual Inflation Rates by Main Groups for June 2025, based on the data from the provided document. The table includes the main groups, their respective weights in the National Consumer Price Index (NCPI), and the 12-month percent change (annual inflation rate) for June 2025.
S/N
Main Groups
Weight (%)
12-Month Percent Change (June 2025)
1
Food and Non-Alcoholic Beverages
28.2
3.5%
2
Alcoholic Beverages and Tobacco
1.9
3.5%
3
Clothing and Footwear
10.8
2.0%
4
Housing, Water, Electricity, Gas, and Other
18.0
7.2%
5
Furnishing, Household Equipment, and Routine Maintenance
7.0
2.0%
6
Health
2.5
1.8%
7
Transport
4.1
1.6%
8
Information and Communication
5.4
0.0%
9
Recreation, Sport, and Culture
2.5
1.2%
10
Education Services
2.0
1.1%
11
Restaurants and Accommodation Services
2.6
1.3%
12
Insurance and Financial Services
2.1
1.6%
13
Personal Care, Social Protection, and Miscellaneous Goods
2.1
2.0%
Total
All Items Index
100.0
3.3%
Notes:
The 12-Month Percent Change represents the annual inflation rate for each group, calculated as the percentage change in the NCPI from June 2024 to June 2025 (base year: 2020 = 100).
The Housing, Water, Electricity, Gas, and other group has the highest inflation rate at 7.2%, driven by items like rentals and utilities.
Information and Communication recorded a 0.0% inflation rate, indicating price stability in this sector.
The overall All Items Index inflation rate is 3.3%, reflecting a stable macroeconomic environment within Tanzania’s target range of 3–5%.
Below is a table summarizing key figures related to inflation in Tanzania for June 2025, drawn from the provided document and incorporating relevant details from the earlier context. The table focuses on essential metrics to provide a concise overview of inflation, its sectoral impacts, and related economic indicators.
Metric
Value
Notes
Headline Inflation Rate
3.3%
Annual rate for June 2025, up from 3.2% in May 2025, within 3–5% target.
Core Inflation Rate
1.9%
Decreased from 2.1% in May 2025, excludes volatile items (food, energy).
Food Inflation Rate
5.6% (May 2025), 3.5% (June 2025)
Driven by staples like rice (2.5%), maize flour (0.8%), cassava (4.2%).
Energy, Fuel, and Utilities Inflation
6.1% (May 2025), 7.2% (Housing, June 2025)
Eased from 7.3% in May 2024; housing and utilities lead non-food inflation.
NCPI (All Items Index)
120.18
Increased from 119.85 (May 2025), a 0.3% monthly rise (base: 2020 = 100).
Food and Non-Alcoholic Beverages Weight
28.2%
Largest NCPI component, significantly impacts cost of living.
Housing and Utilities Weight
18.0%
Second-largest NCPI component, with a 7.2% annual inflation rate.
Key Food Price Increases
Rice: 2.5%, Cassava: 4.2%, Millet: 7.0%
Monthly price changes contributing to food inflation.
Key Non-Food Price Increases
Charcoal: 1.5%, Diesel: 0.7%, Rentals: 0.3%
Monthly increases affecting household budgets.
Poverty Rate (Recent Estimate)
~26%
World Bank estimate (below $2.15/day, 2017 PPP); food inflation may worsen.
Child Stunting Rate
30%
2022 Demographic and Health Survey; rising food prices may exacerbate.
Informal Sector Workforce
~80%
Limits wage adjustments, increasing reliance on subsidies or safety nets.
Notes:
Headline Inflation: The 3.3% rate in June 2025 aligns with SADC/EAC benchmarks, indicating macroeconomic stability.
Food Inflation: The 5.6% rate (May 2025) and 3.5% for June 2025 reflect supply chain issues, notably transportation disruptions, impacting staples critical to low-income households.
Core Inflation: The decline to 1.9% suggests stable pricing for non-volatile goods, beneficial for policy planning.
Economic Context: Rising food and housing costs disproportionately affect low-income households, potentially increasing poverty and malnutrition risks. The informal sector’s dominance complicates wage adjustments, heightening pressure on social safety nets.
Data Source: Figures are primarily from the provided NCPI document (June 2025), with poverty and stunting rates from external sources (World Bank, Demographic and Health Survey).
This table consolidates critical inflation-related figures to highlight their implications for cost of living and economic stability.