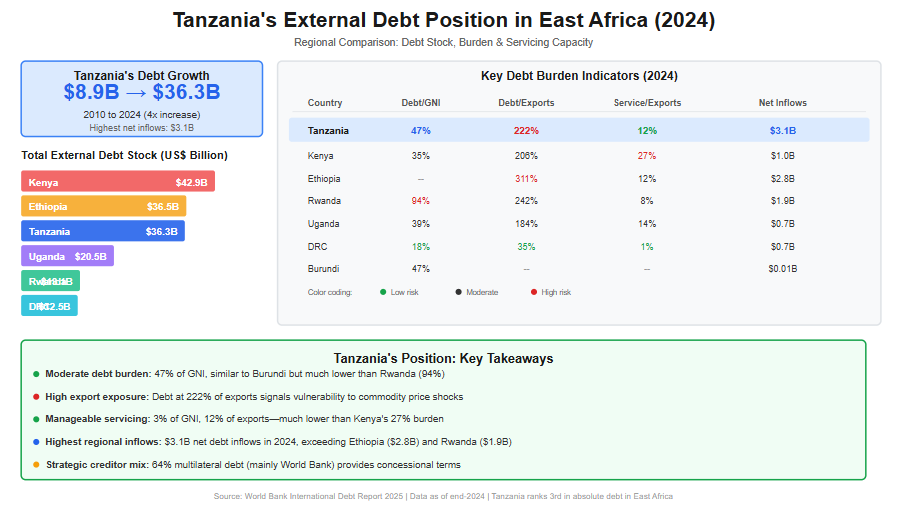
Over the past decade, Tanzania’s external debt has expanded rapidly, reflecting both the country’s ambitious development agenda and growing reliance on external financing to bridge fiscal and infrastructure gaps. According to the International Debt Report 2025, Tanzania’s total external debt stock increased more than fourfold—from US$8.9 billion in 2010 to US$36.3 billion by end-2024. This sharp rise underscores the scale of public investment undertaken during this period, particularly in transport infrastructure, energy, and social sectors, but it also raises important questions regarding debt sustainability and regional competitiveness.
In East Africa, Tanzania currently ranks among the top three most indebted countries in absolute terms, alongside Kenya and Ethiopia. By end-2024, Kenya recorded the highest external debt stock at US$42.9 billion, followed by Ethiopia (US$36.5 billion) and Tanzania (US$36.3 billion). While Tanzania’s debt level is lower than Kenya’s, it is significantly higher than that of Uganda (US$20.5 billion), Rwanda (US$13.1 billion), and the Democratic Republic of Congo (US$12.5 billion). This positioning places Tanzania as a major regional borrower, reflecting the relative size of its economy and its sustained access to concessional and semi-concessional financing.
From a debt burden perspective, Tanzania’s external debt stood at 47% of Gross National Income (GNI) in 2024—moderate by regional standards. This ratio is similar to Burundi (47%) but substantially lower than Rwanda’s 94%, indicating comparatively lower vulnerability than some peers. However, when measured against export earnings, Tanzania’s external debt reached 222% of exports, signaling a high exposure to external shocks, especially fluctuations in commodity prices and global demand. This ratio is higher than Uganda’s (184%) and Kenya’s (206%), though still below Ethiopia’s elevated level of 311%.
Debt servicing pressures in Tanzania remain relatively manageable compared to other East African economies. In 2024, debt service payments accounted for 3% of GNI and 12% of export earnings, significantly lower than Kenya, where debt service absorbed 27% of exports, and comparable to Rwanda’s levels. This reflects Tanzania’s continued reliance on multilateral creditors, which account for approximately 64% of public and publicly guaranteed (PPG) external debt, with the World Bank alone representing nearly half of total PPG debt. Such creditor composition has helped moderate repayment pressures through longer maturities and concessional terms.
Nevertheless, Tanzania recorded the highest net external debt inflows in East Africa in 2024, at US$3.1 billion, exceeding Ethiopia (US$2.8 billion) and Rwanda (US$1.9 billion). This trend highlights ongoing financing needs and signals that debt accumulation is likely to persist in the medium term. As regional peers increasingly face tightening global financial conditions, Tanzania’s future debt trajectory will depend heavily on export performance, fiscal discipline, and the productivity of debt-financed investments.
Overall, Tanzania’s external debt position reflects a delicate balance: stronger than highly indebted peers such as Rwanda and Kenya in terms of servicing capacity, yet more exposed than Uganda and DRC when viewed through export and inflow dynamics. This evolving landscape makes continuous debt monitoring, regional benchmarking, and strategic borrowing essential for safeguarding macroeconomic stability and sustaining long-term growth. Read More of This Topic: Who Is Financing Tanzania’s Public Debt in 2024—and What Does It Mean for Sustainability?
The following table summarizes Tanzania's external debt data across key years, as extracted from the International Debt Report 2025. All figures are in US$ million unless otherwise noted.
| Indicator | 2010 | 2020 | 2021 | 2022 | 2023 | 2024 |
| Total external debt stocks | 8,940 | 25,772 | 28,818 | 30,444 | 34,585 | 36,343 |
| Long-term external debt stocks | 6,904 | 22,055 | 23,589 | 24,533 | 28,271 | 30,898 |
| Public and publicly guaranteed debt from: | ||||||
| Official creditors | 5,546 | 15,355 | 15,502 | 16,308 | 18,296 | 20,005 |
| Multilateral | 4,391 | 11,243 | 11,526 | 12,615 | 14,655 | 16,435 |
| of which: World Bank | 3,248 | 8,148 | 8,290 | 9,228 | 10,989 | 12,097 |
| Bilateral | 1,155 | 4,112 | 3,975 | 3,693 | 3,641 | 3,571 |
| Private creditors | 135 | 2,209 | 3,436 | 3,244 | 4,090 | 4,272 |
| Bondholders | .. | .. | .. | .. | .. | .. |
| Commercial banks and others | 135 | 2,209 | 3,436 | 3,244 | 4,090 | 4,272 |
| Private nonguaranteed debt from: | 1,224 | 4,491 | 4,651 | 4,981 | 5,886 | 6,621 |
| Bondholders | .. | .. | .. | .. | .. | .. |
| Commercial banks and others | 1,224 | 4,491 | 4,651 | 4,981 | 5,886 | 6,621 |
| Use of IMF credit and SDR allocations | 647 | 274 | 1,357 | 1,444 | 1,760 | 2,062 |
| IMF credit | 354 | 0 | 557 | 683 | 993 | 1,316 |
| SDR allocations | 293 | 274 | 800 | 761 | 767 | 746 |
| Short-term external debt stocks | 1,389 | 3,442 | 3,872 | 4,467 | 4,554 | 3,383 |
| Disbursements, long-term | 1,361 | 1,459 | 3,049 | 3,104 | 5,200 | 4,112 |
| Public and publicly guaranteed sector | 1,145 | 1,181 | 2,865 | 2,421 | 4,030 | 3,500 |
| Private sector not guaranteed | 216 | 279 | 184 | 683 | 1,171 | 612 |
| Principal repayments, long-term | 134 | 984 | 1,142 | 1,533 | 1,547 | 1,204 |
| Public and publicly guaranteed sector | 55 | 968 | 1,118 | 1,179 | 1,282 | 1,126 |
| Private sector not guaranteed | 79 | 15 | 25 | 353 | 266 | 78 |
| Interest payments, long-term | 51 | 365 | 319 | 429 | 603 | 725 |
| Public and publicly guaranteed sector | 34 | 363 | 315 | 377 | 547 | 691 |
| Private sector not guaranteed | 17 | 2 | 4 | 52 | 56 | 34 |
The table below focuses on PPG debt in 2024, broken down by creditor type and key creditors where specified. Note that IMF credit is reported separately in the raw data but is included here as part of overall PPG (under multilateral creditors) per the report's figure, which explicitly incorporates it. The total PPG debt (including IMF credit) is approximately $25,593 million (long-term PPG $24,277 + IMF credit $1,316). Specific creditor breakdowns (e.g., China, AfDB) are derived from the report's Figure 1, which provides a visual pie chart; percentages are approximate and may reflect rounded values.
| Creditor Type | Sub-Creditor/Creditor | Amount (US$ million) | % of Total PPG (incl. IMF) |
| Multilateral (excl. IMF) | Total Multilateral (excl. IMF) | 16,435 | ~64% |
| World Bank | 12,097 | ~47% | |
| AfDB (African Development Bank) | ~3,583 (est. based on 14%) | ~14% | |
| Other Multilateral | ~4,351 (est. based on 17%) | ~17% | |
| IMF Credit | IMF | 1,316 | ~5% (reported as 6% in figure) |
| Bilateral | Total Bilateral | 3,571 | ~14% |
| China | ~2,559 (est. based on ~10%; figure label may have OCR variance) | ~10% | |
| India | ~512 (est. based on 2%) | ~2% | |
| Korea, Rep. | ~512 (est. based on 2%) | ~2% | |
| France | ~256 (est. based on 1%) | ~1% | |
| Other Bilateral | ~1,538 (est. based on 6%) | ~6% | |
| Private Creditors | Total Private | 4,272 | ~17% |
| Bondholders | .. | 0% | |
| Commercial Banks and Others | 4,272 | ~17% (incl. other commercial ~4%) | |
| Total PPG (incl. IMF) | 25,593 | **100% |
The International Debt Report 2025 provides detailed external debt statistics for low- and middle-income countries, including East African nations. Below is a comparison focusing on Tanzania and other East African countries (Burundi, Democratic Republic of the Congo (DRC), Ethiopia, Kenya, Rwanda, Somalia, and Uganda). The data is drawn from the report's country tables and snapshots. Note that some values for Ethiopia and Burundi are missing in the report (indicated as ".."), and for Somalia, I supplemented with data from the World Bank's online IDS portal as the PDF extraction for that country was incomplete. Population for Uganda is estimated based on report context (not explicitly listed in the extracted data). All figures are in US$ million unless otherwise noted.
| Country | Total External Debt Stock (US$ million) | External Debt % of GNI | External Debt % of Exports | Debt Service % of GNI | Debt Service % of Exports | Net Debt Inflows (US$ million) | GNI (US$ million) | Population (million) |
| Tanzania | 36,343 | 47 | 222 | 3 | 12 | 3,056 | 76,808 | 69 |
| Burundi | 1,024 | 47 | .. | 2 | .. | 10 | 2,173 | 14 |
| DRC | 12,485 | 18 | 35 | 1 | 1 | 651 | 68,396 | 109 |
| Ethiopia | 36,548 | .. | 311 | .. | 12 | 2,817 | .. | 132 |
| Kenya | 42,886 | 35 | 206 | 5 | 27 | 1,006 | 122,557 | 56 |
| Rwanda | 13,050 | 94 | 242 | 3 | 8 | 1,900 | 13,901 | 14 |
| Somalia | 2,837 | .. | .. | .. | .. | .. | .. | 18 |
| Uganda | 20,534 | 39 | 184 | 2 | 14 | 676 | 52,361 | 50 |
Tanzania's external debt has grown significantly in recent years, reaching USD 32,675.10 million in August 2024. This is a major increase compared to its record low of USD 2,469.70 million in December 2011, and an average of USD 19,468.10 million over the period from 2011 to 2024. The month-on-month increase from USD 31,993.90 million in July to USD 32,675.10 million in August 2024 reflects the country's continued reliance on external financing for development projects and public expenditure.
Key Points:
Tanzania's Position in East Africa and Africa
East Africa: Tanzania is one of the largest economies in East Africa, with a growing external debt that reflects significant investments in infrastructure, energy, and industrialization. The rise in debt is partly due to the country’s need for financing large-scale projects like ports, railways, and energy plants. Among East African countries, Tanzania has one of the highest external debts, but Kenya's debt is also notable, with KES 5.151 trillion (approximately USD 34.5 billion) as of June 2024.
Comparison with East African Countries (Debt in USD):
Africa: On the broader African continent, Tanzania's external debt is lower than that of major economies like South Africa and Egypt but higher than many smaller economies. For instance, South Africa had an external debt of USD 163,852 million as of June 2024, while Egypt had USD 160,607 million in March 2024.
Here is a list of the top African countries with high external debt (figures are based on the latest available data):
Economic Implications for Tanzania
Tanzania’s growing debt is a reflection of its ambitious development agenda, which requires substantial capital. While this external financing is important for infrastructure development and economic growth, managing the debt levels will be crucial to avoid excessive debt servicing costs that could limit fiscal space for other development needs. Tanzania's current external debt positions it among the highly indebted nations in East Africa but is still lower than larger economies like South Africa and Egypt.
Tanzania’s debt management will likely involve focusing on maintaining sustainable debt levels while ensuring that borrowed funds are used productively to generate economic returns. As part of East Africa, Tanzania is competing with countries like Kenya in terms of infrastructure and economic development, which may drive further borrowing for development projects.
1. Tanzania’s External Debt Growth
2. Tanzania’s Position in East Africa
3. Tanzania’s Position in Africa
4. Implications for Tanzania
Conclusion
Tanzania’s external debt reflects its ambitious development plans, but the significant increase in borrowing raises concerns about debt sustainability. As one of the largest economies in East Africa, Tanzania is making important strides in infrastructure and industrialization but must balance borrowing with the productive use of funds to ensure long-term fiscal stability. Compared to other African nations, Tanzania’s debt is significant but still more manageable than the continent’s largest economies like South Africa and Egypt. However, careful debt management will be crucial as the country continues its development journey.