
Tanzania’s economic performance in 2025 reflects a period of strong macroeconomic stability, export-led growth, and improving external resilience, underpinned by prudent monetary management by the Bank of Tanzania (BoT). As of 30 November 2025, the BoT’s financial position signals a notable strengthening of the country’s economic fundamentals, with total assets rising to TZS 29.67 trillion, equivalent to a 4.9% increase (about TZS 1.39 trillion) compared to October 2025. This expansion mirrors heightened foreign exchange inflows, record performance in the mining sector—particularly gold—and rising domestic economic activity, all of which have reinforced liquidity conditions and reserve buffers.
A defining feature of 2025 has been the rapid accumulation of gold and liquid assets. Total gold holdings (monetary and bullion combined) increased by 18.6% to TZS 4.67 trillion, driven by the BoT’s domestic gold purchase programme and Tanzania’s exceptional export performance. Gold export earnings reached an estimated USD 4.3–4.43 billion in the year ending September/October 2025, representing a 35–36% year-on-year increase and firmly establishing gold as the country’s leading foreign exchange earner. In parallel, cash and cash equivalents rose by 32.8% to TZS 4.45 trillion, reflecting strong inflows from exports and services such as tourism, as well as improved liquidity management. These trends have contributed to a more diversified and resilient reserve position.
These monetary and reserve developments are consistent with Tanzania’s broader macroeconomic outcomes in 2025. Real GDP growth is estimated at 6.0–6.3%, supported by mining, tourism (with arrivals rising by around 11%), agriculture, manufacturing, and large-scale infrastructure projects. Inflation remained subdued at about 3.4% in November 2025, comfortably within the BoT’s 3–5% target band, while foreign exchange reserves stood at around USD 6.17 billion (approximately 4.7 months of import cover) by end-October 2025, meeting regional adequacy benchmarks and enhancing exchange rate stability.

Looking ahead, Tanzania’s macroeconomic outlook for 2026 remains broadly positive, building on the strong foundations established in 2025. Current projections from international and domestic sources point to real GDP growth of about 6.1–6.3% in 2026, indicating stable to slightly accelerating momentum. Growth is expected to continue being driven by mining (especially gold), tourism, infrastructure investments, manufacturing, and gradual expansion in private sector credit, supported by ongoing structural reforms aimed at improving the business environment.
Inflation in 2026 is projected to remain around 3.5%, still within the BoT’s policy target range, reflecting continued prudent monetary policy, stable food supply conditions, and moderated global energy prices. Foreign exchange reserves are expected to remain adequate—above 4.5–5 months of import cover, bolstered by sustained gold and tourism receipts and steady capital inflows. Gold exports are likely to remain elevated, potentially exceeding USD 4 billion, although performance will remain sensitive to global commodity prices and production dynamics.
Overall, the 2026 trajectory suggests that Tanzania is well positioned to consolidate its macroeconomic gains, strengthen external buffers, and advance toward its medium-term development goals, including upper-middle-income status. Nonetheless, risks such as commodity price volatility, climate-related shocks, and post-election policy adjustments could influence outcomes. Maintaining fiscal discipline, deepening export diversification, and sustaining prudent monetary management will be critical to preserving stability and translating growth into inclusive and resilient economic development beyond 2026. Read More: Tanzania Economic Updates December 2025
The table below highlights selected major items (in TZS '000) with significant changes, focusing on those relevant to economic development (e.g., reserves, gold, and liquidity indicators).
| Item | 30-Nov-2025 (TZS '000) | 31-Oct-2025 (TZS '000) | Change (TZS '000) | % Change | Implications for Economy |
| Total Assets | 29,671,370,947 | 28,276,931,699 | +1,394,439,248 | +4.9% | Strong reserve accumulation and economic expansion |
| Cash and Cash Equivalents | 4,451,306,481 | 3,351,589,357 | +1,099,717,124 | +32.8% | Inflows from exports (e.g., gold, tourism) boosting liquidity |
| Monetary Gold | 1,882,335,649 | 1,503,197,004 | +379,138,645 | +25.2% | Higher gold prices and BoT domestic purchases |
| Bullion Gold | 2,790,183,836 | 2,437,344,646 | +352,839,190 | +14.5% | Reflects mining sector boom and reserve diversification |
| Total Gold Holdings (Monetary + Bullion) | 4,672,519,485 | 3,940,541,650 | +731,977,835 | +18.6% | Key driver: Record gold exports |
| Foreign Currency Marketable Securities | 8,983,322,949 | 9,941,164,333 | -957,841,384 | -9.6% | Possible reallocation to cash/gold |
| Loans and Receivables | 1,353,585,170 | 835,564,152 | +518,021,018 | +62.0% | Increased lending supporting private sector growth |
| Total Liabilities | 26,845,941,243 | 25,540,416,048 | +1,305,525,195 | +5.1% | Managed growth in deposits and currency |
| Currency in Circulation | 9,698,821,378 | 9,605,923,719 | +92,897,659 | +1.0% | Rising money supply indicating higher transactions/economic activity |
| Deposits - Others (e.g., government/private) | 3,570,569,361 | 2,708,228,714 | +862,340,647 | +31.8% | Increased savings or fiscal deposits |
| Total Equity | 2,825,429,704 | 2,736,515,651 | +88,914,053 | +3.2% | Improved central bank capital base for stability |
The most notable development is the ~18.6% increase in total gold holdings (combined monetary and bullion gold), driven by Tanzania's mining sector expansion and the BoT's policy of purchasing gold from domestic producers. This aligns with record gold export earnings of approximately USD 4.3–4.43 billion in the year ending September/October 2025, a ~35–36% surge year-on-year, fueled by high global gold prices and increased production.
Tanzania's economy in 2025 demonstrates resilient growth, low inflation, and strengthening external buffers, supported by key sectors: mining (gold-led), tourism (strong recovery in arrivals), agriculture (stable output despite weather risks), and infrastructure investments. GDP growth is driven by exports and public projects, with foreign reserves providing a buffer against external shocks.
| Indicator | Value (2025) | Notes/Source Context |
| Real GDP Growth (projected/full year) | 6.0–6.3% | IMF projection 6.0%; Q2 actual 6.3%; driven by mining, tourism (+11% arrivals), agriculture |
| Headline Inflation (November 2025) | 3.4% | Down from 3.5% in October; within BoT target (3–5%); food inflation cooled to ~6.6% |
| Foreign Exchange Reserves (end-October 2025) | ~USD 6.17 billion (4.7 months import cover) | BoT data; some reports cite ~USD 6.4 billion excluding gold in November; adequate per EAC benchmarks |
| Gold Exports (year ending ~Sep/Oct 2025) | USD 4.3–4.43 billion | Record high, +35–36% y-o-y; top export commodity |
| Key Growth Sectors | Mining (gold dominant), Tourism, Agriculture, Manufacturing | Mining and tourism leading export/FX earnings; agriculture employs ~65% of workforce |
Overall, the BoT balance sheet reinforces a positive outlook for Tanzania's economy, characterized by export-led growth, macroeconomic stability, and progressive reserve accumulation in 2025.
Tanzania's strong macroeconomic momentum in 2025 is expected to carry into 2026, with projections indicating continued resilient growth, low inflation, and strengthening external buffers. International and domestic forecasts highlight sustained performance in key sectors—particularly mining, tourism, infrastructure investments, and manufacturing—while ongoing reforms aim to enhance diversification and private sector participation. The Bank of Tanzania's prudent monetary management and reserve accumulation are likely to support exchange rate stability and resilience against global uncertainties. However, risks such as potential political transitions following the 2025 elections, commodity price volatility, and climate-related challenges could moderate the pace if not managed effectively.
The table below summarizes major forecasts from reputable sources (as of late 2025 data), compared to 2025 estimates for context.
| Indicator | Projected Value (2026) | 2025 Estimate/Actual | Change/Trend | Notes/Source Context |
| Real GDP Growth | 6.1–6.3% | 6.0–6.3% | Stable to slight acceleration | IMF: 6.3%; Tanzania government target: 6.1%; driven by fixed investments, exports, and reforms |
| Headline Inflation | ~3.5% | ~3.3–3.4% | Mild increase | Expected to stay within BoT's 3–5% target; supported by stable food/energy prices and tight policy |
| Foreign Exchange Reserves | Adequate (>4.5–5 months import cover) | ~4.7 months (end-2025 est.) | Continued improvement | Bolstered by gold/tourism exports and inflows; aligns with EAC benchmarks |
| Gold Exports | Sustained high levels (potentially >USD 4 billion) | USD 4.3–4.43 billion | Stable growth | Dependent on global prices and production; mining remains dominant |
| Key Growth Sectors | Mining (gold-led), Tourism, Infrastructure, Agriculture, Manufacturing | Similar to 2025 | Ongoing momentum | Emphasis on LNG projects, ports/railways, and private sector credit expansion; East Africa regional leader at ~5.9% average growth |
Overall, the 2026 outlook reinforces Tanzania's path toward upper-middle-income status, with export-led growth and reserve buildup (as seen in the BoT's 2025 balance sheet trends) providing a solid foundation. Successful implementation of structural reforms, climate-resilient investments, and fiscal prudence will be critical to achieving these projections and mitigating downside risks.
The Bank of Tanzania's November 2025 balance sheet paints an optimistic picture of the nation's macroeconomic health, with significant asset growth, diversified reserves (particularly in gold), and strengthened equity signaling enhanced resilience and capacity for development financing. Tanzania's 2025 performance—marked by record export earnings, low and stable inflation, private sector credit expansion, and GDP growth around 6%—has been anchored by effective central bank policies and sectoral strengths in mining and tourism, providing a buffer against external risks while fostering inclusive progress.
As the economy transitions into 2026, projections of 6.1–6.3% GDP growth, inflation remaining around 3.5%, and sustained reserve adequacy offer a compelling outlook for continued momentum. Key opportunities lie in advancing structural reforms, climate-resilient investments, and diversification efforts to mitigate risks such as commodity price fluctuations or global slowdowns. With the BoT's prudent stewardship and export-led drivers intact, Tanzania is well-positioned to build on its 2025 gains, driving sustainable development, job creation, and regional leadership in the years ahead.
Fiscal decentralization in Tanzania, pursued through the policy of Decentralization by Devolution (D by D), aims to empower Local Government Authorities (LGAs) with greater financial autonomy to fund and manage local development effectively. A key measure of success is the extent to which LGAs can rely on own-source revenue—locally generated through property rates, fees, licenses, and service levies—rather than central government transfers. The core question is whether this policy has meaningfully improved the financial sustainability of LGAs, enabling them to independently finance the bulk of grassroots projects such as roads, schools, health centers, water supply, and sanitation.
Evidence from LGA revenue data spanning 2010 to 2025 indicates that fiscal decentralization has not significantly enhanced financial sustainability. While own-source revenue has grown substantially in absolute terms—from TZS 13.9 billion in 2010 to TZS 147.8 billion in 2025 (a more than tenfold increase)—this has failed to reduce heavy dependence on central transfers. The own-source share of total LGA revenue averaged only 2.8% over the period (excluding the anomalous 0.5% in 2016), ranging from a low of 1.9% in 2012 to a high of 4.1% in 2025. In recent years, despite own-source collections reaching TZS 121.9 billion in 2024 and TZS 147.8 billion in 2025, the share remained modest at 3–4%. This means central government transfers continued to account for 96–98% of total LGA revenue, which expanded from TZS 609.7 billion in 2010 to TZS 3,570.4 billion in 2025.
This persistently low own-source contribution highlights limited progress toward true fiscal autonomy. LGAs, despite implementing most development projects critical to national goals like the Five-Year Development Plans and Sustainable Development Goals, lack the financial independence needed for proactive, timely, and locally prioritized planning. Delays in project execution and resource inefficiencies often result from this dependency.
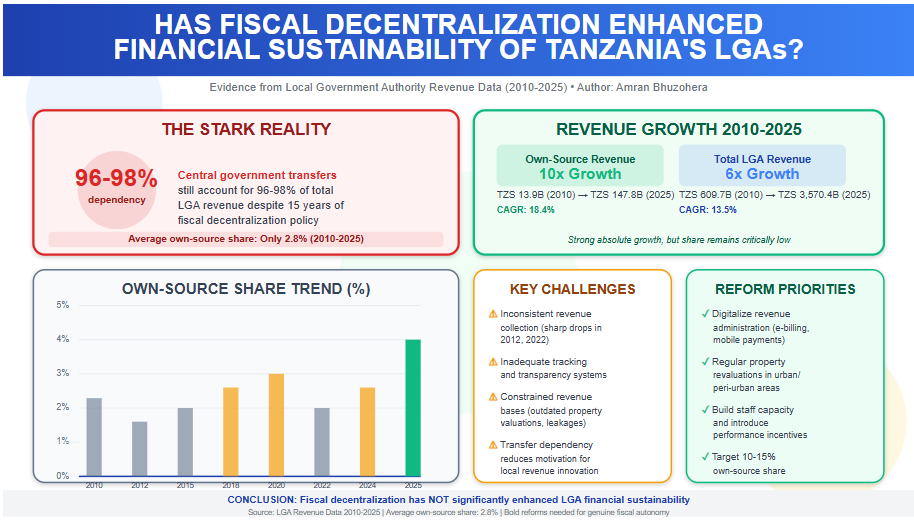
Recent trends offer cautious optimism, with own-source growth accelerating in 2023–2025 and the share reaching 4.1% in 2025—the highest in the period. However, this remains far below levels needed for genuine sustainability.
To achieve meaningful enhancement through fiscal decentralization, targeted reforms are required. Priorities include digitalizing revenue administration (e.g., electronic billing and mobile payments), conducting regular property revaluations, building staff capacity, and introducing incentives for high-performing LGAs, such as greater autonomy or matching grants. Linking revenue strategies to local economic drivers—like agriculture, tourism, and small industries—could further boost collections organically. A medium-term target of 10–15% own-source share would better align resources with community needs, foster decentralized development, and build resilience against fiscal shocks.
In summary, while absolute own-source revenue has risen impressively, the low and stagnant share over 2010–2025 demonstrates that fiscal decentralization has yet to deliver substantial financial sustainability for Tanzania’s LGAs. Sustained, bold reforms are essential to realize the full potential of devolution.
Note: The 2016 data point shows Own Sources as 0.0B (likely a recording error or missing data, as noted in the document's limitations). It is treated as anomalous in trend calculations. The "Non-Tax Revenue" column does not factor into the LGA Share % and appears unrelated to the core self-reliance metric (possibly national non-tax figures or a separate category). Read More: Local Government Revenue Collections in Tanzania
| Year | Own Sources (B TZS) | Total Revenue (B TZS) | LGA Share (%) |
| 2010 | 13.9 | 609.7 | 2.3 |
| 2011 | 20.0 | 722.0 | 2.8 |
| 2012 | 17.2 | 909.4 | 1.9 |
| 2013 | 27.2 | 1,041.8 | 2.6 |
| 2014 | 23.3 | 1,112.9 | 2.1 |
| 2015 | 41.0 | 1,478.9 | 2.8 |
| 2016 | 0.0 | 1,394.8 | 0.5 |
| 2017 | 44.6 | 1,781.9 | 2.5 |
| 2018 | 58.9 | 1,817.5 | 3.2 |
| 2019 | 61.7 | 2,180.4 | 2.8 |
| 2020 | 86.1 | 2,354.8 | 3.7 |
| 2021 | 82.8 | 2,545.8 | 3.3 |
| 2022 | 69.1 | 3,085.7 | 2.2 |
| 2023 | 100.8 | 3,110.9 | 3.2 |
| 2024 | 121.9 | 3,877.4 | 3.1 |
| 2025 | 147.8 | 3,570.4 | 4.1 |
The revenue data from 2010 to 2025 clearly illustrates that Tanzania's Local Government Authorities (LGAs) remain heavily dependent on central government transfers, which consistently account for 95–98% of total revenue. Even at the highest point in the period—4.1% own-source share in 2025 (TZS 147.8 billion out of TZS 3,570.4 billion total)—locally generated funds cover only a marginal fraction of budgetary needs. This structural dependency severely constrains fiscal autonomy at the local level, where the majority of development projects are executed, including critical infrastructure such as roads, schools, health centers, and water supply systems.
Despite the overall low share, several encouraging trends emerge:
These gains suggest that, with continued effort, higher levels of self-reliance are achievable.
The data also exposes significant obstacles that hinder progress:
To build on recent progress and reduce reliance on central transfers, LGAs must pursue targeted, sustained reforms that address both administrative and structural constraints:
In conclusion, while absolute own-source revenue has shown impressive growth and recent trends are promising, true economic self-reliance demands accelerating the own-source share well beyond the current low single digits. Without comprehensive reforms to address volatility, administrative gaps, and narrow revenue bases, LGAs will continue to face limited fiscal space. The upward trajectory since 2020 demonstrates potential, but only deliberate policy action will close the gap and enable LGAs to finance local development more independently and effectively.
Analysis of fiscal data from 2000 to 2025 reveals that Tanzania cannot yet fully self-finance its development agenda without external support. Despite significant improvements in domestic revenue mobilization, persistent structural deficits indicate continued dependence on donor financing and concessional loans to bridge the gap between revenues and expenditures.
Tanzania has recorded fiscal deficits in 24 out of 26 years between 2000 and 2025, demonstrating that domestic revenues have consistently fallen short of total government expenditure. In the early 2000s, revenues covered only 58–70% of expenditure, creating financing gaps of 30–40% that required external grants, concessional loans, and domestic borrowing. For instance, in 2000, the government collected TZS 859 billion against expenditure of TZS 1,283 billion, resulting in a deficit of TZS 424 billion.
Although revenue performance has improved substantially over the past two decades, the structural imbalance persists. By 2024, total revenue had increased to TZS 33.9 trillion, yet expenditure expanded even faster to TZS 39.9 trillion, producing a record deficit of TZS 6.1 trillion. In recent years, revenues have covered only 84–87% of expenditure on average, meaning that 13–16% of government spending remains unfunded by domestic resources.
The only year in which Tanzania achieved full fiscal self-sufficiency was 2018, when a surplus of TZS 853 billion was recorded and revenue coverage reached 105%. However, this outcome proved temporary and non-recurring. Deficits re-emerged immediately afterward due to renewed spending pressures and external shocks, including the COVID-19 pandemic period, demonstrating that the surplus was not indicative of a sustainable structural shift.
Preliminary data for January–September 2025 reinforces the conclusion of continued fiscal dependence. Within nine months, the government recorded revenue of TZS 26.3 trillion against expenditure of TZS 31.3 trillion, generating a deficit of TZS 5.0 trillion. Annualized projections indicate that Tanzania will continue to rely on external financing and borrowing to sustain both development projects and recurrent obligations.
Based on current revenue and expenditure dynamics, Tanzania cannot yet fully operate and implement large-scale development projects without external donor support. While domestic revenues—largely driven by tax collections—have grown impressively and now finance the majority of government spending, they remain insufficient to close the fiscal gap consistently. Donor financing, concessional loans, and external support continue to play a critical complementary role, particularly in infrastructure, social services, and development financing.
Tanzania is moving toward greater fiscal self-reliance, but achieving full independence from donor funding will require further expansion of the tax base, improved revenue administration efficiency, tighter expenditure prioritization, and sustained economic growth. Until these structural reforms fully materialize, external support will remain an integral component of financing Tanzania's development agenda. Read More: Overview of Government Budgetary Operations (October 2025)
The attached document provides calendar-year data on Tanzania's central government finances (in billions TZS), with deficit/surplus calculated as Total Revenue minus Total Expenditure (before grants and financing). Note that the "Total Expenditure" column shows negative values, so actual expenditure is the absolute value (e.g., -17,037 in 2018 means expenditure of 17,037 billion TZS).
This gap represents the unfunded portion of the budget, typically financed through debt, leading to rising public debt obligations over time.
The persistent deficit is a common challenge in developing economies like Tanzania, driven by ambitious development spending outpacing revenue growth. If left unaddressed, it risks higher debt servicing costs, inflation, or reduced fiscal space for emergencies.
These steps, if implemented consistently, could achieve sustained surpluses or near-balance, as briefly seen in 2018.
Tanzania's fiscal year runs July–June, so calendar 2026 spans the second half of FY 2025/26 and the first half of FY 2026/27.
However, the current political situation (as of December 2025) poses significant risks:
Expectation for 2026: Official targets suggest a continued narrowing of the deficit (toward 2–3% of GDP) if stability returns and reforms proceed. However, prolonged political turbulence risks higher deficits (potentially wider gaps), slower growth, and strained financing. Much depends on de-escalation and inclusive dialogue in early 2026. Monitoring sources like the Ministry of Finance, Bank of Tanzania, and IMF updates will be key.
| Year | Total Revenue | Tax Revenue | Total Expenditure | Deficit/Surplus | Revenue Growth |
| 2000 | 859 | 734 | -1,283 | -424 | N/A |
| 2001 | 1,047 | 893 | -1,286 | -239 | 21.9% |
| 2002 | 1,166 | 1,032 | -1,598 | -433 | 11.4% |
| 2003 | 1,336 | 1,154 | -2,068 | -732 | 14.6% |
| 2004 | 1,638 | 1,458 | -2,818 | -1,179 | 22.6% |
| 2005 | 1,943 | 1,708 | -2,976 | -1,032 | 18.6% |
| 2006 | 2,459 | 2,109 | -3,599 | -1,140 | 26.5% |
| 2007 | 3,245 | 2,859 | -4,376 | -1,132 | 32.0% |
| 2008 | 4,013 | 3,675 | -5,747 | -1,734 | 23.7% |
| 2009 | 4,408 | 4,078 | -7,190 | -2,782 | 9.8% |
| 2010 | 5,102 | 4,686 | -8,264 | -3,162 | 15.8% |
| 2011 | 6,436 | 5,738 | -9,732 | -3,296 | 26.1% |
| 2012 | 7,927 | 6,995 | -11,190 | -3,262 | 23.2% |
| 2013 | 9,236 | 7,966 | -12,318 | -3,082 | 16.5% |
| 2014 | 10,924 | 9,537 | -13,881 | -2,957 | 18.3% |
| 2015 | 13,441 | 11,715 | -17,245 | -3,804 | 23.0% |
| 2016 | 14,210 | 13,759 | -17,343 | -3,134 | 5.7% |
| 2017 | 16,479 | 13,801 | -18,071 | -1,592 | 16.0% |
| 2018 | 17,889 | 14,763 | -17,037 | 853 | 8.6% |
| 2019 | 18,961 | 16,326 | -21,078 | -2,117 | 6.0% |
| 2020 | 20,275 | 17,279 | -22,119 | -1,844 | 6.9% |
| 2021 | 23,313 | 19,074 | -27,121 | -3,808 | 15.0% |
| 2022 | 27,921 | 22,725 | -31,943 | -4,022 | 19.8% |
| 2023 | 28,454 | 23,750 | -33,653 | -5,199 | 1.9% |
| 2024 | 33,888 | 28,077 | -39,940 | -6,053 | 19.1% |
| 2025 | 26,332 | 22,028 | -31,323 | -4,991 | -22.3% |
Note: All values in billions TZS. 2025 data includes Jan-Sep only (9 months). Deficit/Surplus = Revenue - Expenditure (before grants and financing).
Sickle Cell Disease (SCD) remains one of Tanzania’s most severe yet under-reported public health challenges. Despite the country ranking among the top four globally in annual SCD births—estimated at 11,000 to 13,000 newborns each year—the disease receives strikingly little attention in mainstream media. A recent content analysis of Tanzania’s two leading Swahili newspapers, Mwananchi and Nipashe, reveals how this silence is not accidental but structural, reinforcing low public awareness, stigma, and delayed policy response.
SCD is a genetic blood disorder that causes chronic pain, infections, organ damage, and premature death. In Tanzania, nearly half of affected children die before the age of five if early diagnosis and treatment are unavailable. Although the disease is acknowledged within the National Strategic Plan for Non-Communicable Diseases (2021–2026), public understanding remains limited, particularly in rural and high-prevalence regions around Lake Victoria.
Given the media’s proven role in shaping public knowledge and health behaviour, sustained reporting on SCD would be expected. Instead, evidence suggests the opposite.
An analysis of all content published in Mwananchi and Nipashe between 1 April and 30 June 2025 examined 7,413 individual items across news, features, columns, editorials, opinions, letters, and advertisements. Of this total output, only 45 articles—just 0.61 percent—were related to Sickle Cell Disease.
The distribution of coverage was equally revealing:
This clustering aligns precisely with World Sickle Cell Awareness Day, observed on 19 June, indicating that SCD reporting in Tanzania is almost entirely event-driven rather than issue-driven.
The concentration of all SCD stories into a single month demonstrates a familiar pattern in health reporting across Africa: diseases receive attention only when international awareness days occur. While such observances temporarily raise visibility, they fail to sustain public engagement or deepen understanding.
By contrast, communicable diseases such as HIV/AIDS, malaria, and cholera dominate health pages year-round. These topics are framed as urgent, continuous threats, while SCD—despite comparable mortality impacts—is treated as a symbolic annual concern.
This approach creates what scholars describe as public health amnesia: the issue briefly enters public consciousness before disappearing entirely from the media agenda.
According to Agenda-Setting Theory, media outlets influence not what people think, but what they think about. The near-absence of SCD from routine reporting sends a powerful message: that the disease is not a national priority.
Even more significant is framing by omission. When newspapers fail to cover SCD consistently, they indirectly frame it as unimportant, rare, or resolved. This silence contributes to stigma, misinformation, and delayed care-seeking, particularly for a genetic condition already surrounded by cultural misconceptions.
In effect, the lack of coverage becomes a form of communication—one that undermines prevention, screening, and advocacy efforts.
Tanzania’s experience mirrors broader African trends. Studies from Nigeria, Kenya, Ghana, and South Africa consistently show that SCD and other non-communicable diseases receive less than two percent of health media coverage, despite accounting for a growing share of mortality.
However, alignment with continental patterns does not lessen the national cost. With Tanzania’s large readership base for Swahili newspapers, even modest increases in regular SCD reporting could significantly improve public awareness, normalize screening, and strengthen support for policy interventions.
SCD is not a disease that can be addressed through one-day campaigns. Effective responses require:
Without consistent media attention, these efforts struggle to gain traction.
The findings point to a clear need for editorial reform. Tanzanian media houses should integrate SCD into routine health reporting rather than isolating it within awareness-day journalism. Assigning dedicated health reporters, aligning coverage with national health calendars, and partnering with institutions such as the Ministry of Health and the Sickle Cell Foundation of Tanzania could ensure steady, evidence-based reporting throughout the year.
The silence surrounding Sickle Cell Disease in Tanzania’s print media is neither neutral nor harmless. By allocating just 0.61 percent of content—and restricting it to a single month—leading newspapers fail to reflect the disease’s true public health burden. Until SCD is treated as a continuous national issue rather than a symbolic annual event, media coverage will remain part of the problem rather than part of the solution.
Before the country’s political debates and development charts, there is a quieter truth you hear in bus stations, university courtyards, and village centers: young Tanzanians are hungry for a future they can actually touch. Their hopes are big, sometimes bigger than the opportunities in front of them, yet they keep showing up, creating small businesses from borrowed tools, training for jobs that don’t exist yet, and imagining lives that match the promise of a rapidly changing nation.
You get the sense that the country is standing on the edge of something powerful, and what happens next will depend on whether that youthful determination finally meets a structure strong enough to support it. That is the spirit behind this proposal, a belief that if Tanzania chooses to bet on its young people in a real, coordinated, economically serious way, the entire nation could rise with them.
Tanzania is standing at an unusual crossroad, caught between a booming youth population and an economy racing toward the ambitious targets of Vision 2050. With more than 28 million young people under 25 and a national population projected to surpass 65 million by next year, the country has the kind of demographic energy that economists often dream about. Yet young people themselves tell a different story: too many are circling the job market without landing opportunities that match their skills, ambitions, or the new sectors reshaping the country.
Even the official estimate of 3.35% unemployment for ages 15–24 doesn’t quite capture the reality seen in the streets of Dar es Salaam, Dodoma, Mwanza, or Arusha, where underemployment, informality, and mismatched training are part of young people’s daily vocabulary. President Samia Suluhu Hassan’s call for “smart economic thinkers” echoes the sentiment growing among youth who see potential everywhere but access nowhere. It’s from this blend of urgency and opportunity that the proposal for the Ministry of Youth Economic Empowerment and Coordination (MYEEC) emerges, centered not on symbolism, but on economic muscle and coordination strong enough to shift national outcomes.
The idea isn’t to revive the old concept of a “Ministry of Youth,” which historically tended to drift toward cultural or recreational programming while the real economic tools remained scattered across government institutions. Young people know too well how this fragmentation works: one ministry trains, another funds, another regulates, and yet no single institution carries the mandate or accountability required to link opportunity with tangible outcomes.
A coordinated and economically anchored ministry changes that equation entirely. It reframes youth not as a social category, but as a driving force of production, entrepreneurship, and innovation. The country has already seen what targeted economic programs can yield. Initiatives like the EACOP-linked Youth Economic Empowerment Project have created pathways into energy-related jobs, while Feed the Future’s Advancing Youth program has shown the value of agribusiness training when tied to real markets. Still, these efforts often run in parallel lanes rather than a unified highway.
By gathering existing programs, such as those overseen by NEEC, under one strategic umbrella, MYEEC becomes the center of gravity for policies, partnerships, and investments that directly shape youth livelihoods. And in an era where borrowing space is tightening, the ministry’s design leans heavily on coordination with PPPs, private sector actors, and international partners who are increasingly drawn to youth-driven, skills-based, and innovation-led growth models. The lived experience of many young Tanzanians, wanting to build something but hitting bureaucratic dead ends, sits at the heart of this proposal.
Thinking about MYEEC is really thinking about a different future for Tanzania’s development architecture. Placed under the President’s Office, the ministry would carry the authority needed to harmonize programs and redirect resources that are already flowing—like the TZS 1.2 billion committed in 2019/2020 for youth programs, much of which got diluted across multiple agencies.
Its divisions would mirror real needs on the ground. An Economic Empowerment wing would guide entrepreneurship hubs, vocational training tailored to sectors like energy, digital technology, and industrialization, and stronger linkages to microfinance. A dedicated Coordination and Policy arm would ensure youth are formally integrated into PPPs, from ports to railways, and that existing policies, including the National Youth Development Policy, finally operate in sync rather than isolation. Meanwhile, an Innovation and Inclusion division would elevate digital literacy, gender inclusion, and youth participation in shaping Vision 2050 itself, drawing lessons from organizations like Restless Development that have shown how powerful youth-led strategies can be.
The ministry’s targets are intentionally bold: reducing youth unemployment by up to 15% by 2030, integrating nearly half of youth initiatives into national economic planning, and increasing youth-led enterprises by at least 20%. More importantly, the ministry becomes a stabilizing force at a time when youth frustrations, especially following contentious political moments, can easily turn into broader national tension. Giving young people access to real opportunities is more than an economic intervention; it’s a political investment in national cohesion.
The implementation roadmap blends urgency with long-term vision. Early actions would focus on drafting the establishment bill, consolidating existing programs, and launching entrepreneurship hubs that could train 10,000 youth almost immediately. From there, MYEEC would scale PPP-linked job programs, create monitoring dashboards that directly report to the President, and include youth representatives in oversight, embedding their voice not as a formality but as part of the governance structure.
In a country growing at 3.2% annually and expecting a rapidly expanding school-age population, the cost of delaying youth-focused economic empowerment is far higher than the investment required to begin now. The proposed ministry is not another bureaucratic ornament. It is a structural commitment to harnessing the demographic dividend that will determine whether Tanzania reaches its goal of a $1 trillion economy or falls short.
By placing youth at the center of economic strategy, Tanzania sends a message far beyond its borders: that the future is not something to wait for, but something to build, deliberately, collaboratively, and with the full force of its youngest citizens leading the way.
December 2025 - Comprehensive Analysis
Tanzania's economy demonstrated robust stability and resilience during October-November 2025, as highlighted in the Bank of Tanzania's November 2025 Monthly Economic Review. Key supports included prudent monetary policy anchoring inflation and liquidity, strong export performance, improved fiscal revenues, and a narrowing external imbalance.
This stability fosters predictable conditions for investment and consumption, supporting poverty reduction with a target of less than 25% by 2030 and substantial job creation. The narrowing deficits bolster reserves, mitigating shocks from global commodity volatility and enabling AfCFTA integration with USD 1 billion trade potential. Positive fundamentals attracted USD 1.5 billion in FDI during Q3, representing a 10% year-on-year increase and adding approximately 1% to GDP via spillovers.
However, food-driven pressures and interest costs accounting for 6.5% of the budget risk exacerbating inequality. Targeted agricultural reforms could unlock 0.5-1% additional growth, enhancing medium-term prospects toward upper-middle-income status.
Headline inflation remained firmly anchored within the Bank of Tanzania's 3-5% target and EAC/SADC convergence criteria of less than 8%, despite upward pressures from food items amid seasonal supply constraints and regional harvests.
| Indicator | Oct 2024 (%) | Sep 2025 (%) | Oct 2025 (%) |
|---|---|---|---|
| Headline inflation | 3.0 | 3.4 | 3.5 |
| Food inflation | 2.5 | 7.0 | 7.4 |
| Core inflation | 3.2 | 2.2 | 2.1 |
| Energy, fuel & utilities | 9.7 | 3.7 | 4.0 |
Headline inflation eased to 3.4%, with food inflation declining to 6.6% due to harvest relief, while core inflation remained stable at 2.1%.
Anchored inflation preserves purchasing power for 60 million consumers, with 60% of budgets allocated to food, sustaining consumption-led growth at 3.5% and enabling accommodative policy with the Central Bank Rate at 5.75%. Food volatility poses risks to welfare for low-income households, potentially adding 0.3% to poverty if prolonged. NFRA interventions help mitigate these risks, supporting rural stability with agriculture contributing 24% to GDP.
Energy relief lowers production costs in manufacturing by 3.5%, aiding competitiveness. However, persistent food issues underscore the need for climate and agricultural investment, with irrigation improvements potentially reducing inflation by 1 percentage point and adding 0.5% to GDP.
The Bank of Tanzania adopted an accommodative yet cautious stance, maintaining the Central Bank Rate at 5.75% to balance growth and stability, with liquidity remaining adequate as the 7-day interbank rate stood at 6.28%, within the plus or minus 2% corridor.
| Indicator | Value (Oct 2025) |
|---|---|
| Central Bank Rate (CBR) | 5.75% |
| 7-day interbank rate | 6.28% |
| Broad money (M3) growth (y/y) | 21.5% |
| Private sector credit growth (y/y) | 16.1% |
| Sector | Annual Credit Growth (%) |
|---|---|
| Mining & quarrying | 29.7 |
| Agriculture | 25.6 |
| Hotels & restaurants | 23.2 |
| Trade | 21.8 |
Strong recovery observed in export-oriented and productive sectors, with personal loans, particularly to MSMEs, accounting for 36.4% share of total credit.
Robust credit growth at 16.1%, exceeding the 15% target, fuels productive sectors, contributing 1.5-2% to GDP through mining and tourism multipliers and creating jobs, with 1 in 5 jobs linked to tourism. Broad money supply growth of 21.5% supports investment without overheating the economy, as evidenced by low core inflation, aligning with the 6.2% GDP growth target.
The sector focus enhances economic diversification, with gold representing 50% of exports. However, MSME dominance in credit allocation poses risks if non-performing loans rise from the current 3.2% level. Credit guarantee schemes could unlock TZS 2 trillion in additional lending, boosting inclusive growth and youth employment, which currently stands at 13.4% unemployment.
Interest rates remained stable, with marginal easing observed in negotiated segments, providing support to borrowers.
| Rate Type | Sep 2025 | Oct 2025 |
|---|---|---|
| Average lending rate | 15.18 | 15.19 |
| Negotiated lending rate | 12.84 | 12.40 |
| Overall deposit rate | 8.50 | 8.36 |
| Interest rate spread | --- | 6.28 |
Lower negotiated rates benefit prime borrowers in sectors such as mining and tourism. The interest rate spread reflects inherent risk and operational costs in the banking sector.
Rate stability aids predictability in financial markets, sustaining credit demand growth at 16.1% and supporting consumption and investment growth of 3.5% from the private sector. The easing of negotiated rates to 12.40% particularly benefits large firms, potentially adding 0.5% to GDP through increased capital expenditure.
However, the high average lending rate of 15.19% constrains SME access to credit. Narrowing the interest rate spread to 5% through enhanced competition could mobilize TZS 1 trillion in additional productive lending, reducing income inequality and supporting medium-term growth targets of 7%.
Fiscal performance strengthened considerably, with revenues remaining buoyant amid increased economic activity. The most recent detailed data available is from September 2025.
| Item | Amount (TZS Billion) |
|---|---|
| Total revenue | 3,718.2 |
| -- Tax revenue | 3,124.1 |
| -- Non-tax revenue | 446.2 |
| Total expenditure | 4,284.2 |
| -- Recurrent | 2,508.6 |
| -- Development | 1,775.6 |
Revenue: TZS 2,328.5 billion, achieving 96.1% of the target
Deficit: Small deficit of TZS 15.1 billion recorded
Tax Performance: Tax revenue exceeded targets by 11.4%, attributed to Tanzania Revenue Authority modernization and economic rebound
Strong revenue collection at 13.1% of GDP funds development expenditure, which has a 65% bias in the FY2025/26 budget, driving infrastructure multipliers that contribute approximately 2% to GDP. Tax buoyancy reduces aid dependency from 5%, enhancing fiscal sovereignty and policy independence.
However, expenditure under-execution at 76.4% in October delays critical projects. Improving budget absorption to 90% could add 1% to growth through enhanced job creation and productivity gains. The strong fiscal position supports development objectives while maintaining macroeconomic stability.
National debt is being managed prudently, with external debt experiencing a slight decline due to scheduled amortizations.
| Debt Type | Amount |
|---|---|
| Total national debt | USD 50.9 billion |
| External debt | USD 35.4 billion (69.5%) |
| Domestic debt | TZS 38.1 trillion |
| Creditor Type | Share (%) |
|---|---|
| Multilateral | 57.4 |
| Commercial | 35.2 |
| Bilateral | 4.3 |
| Export credit | 3.1 |
External debt shows monthly decline with continued focus on concessional borrowing. The debt-to-GDP ratio stands at 49.6%, which is considered sustainable.
The sustainable debt level at 49.6% of GDP funds growth-enhancing projects without causing debt distress, with multilateral creditors providing low-cost financing that aids reserve accumulation. The decline in external debt combined with shilling strength saves approximately TZS 3 trillion year-on-year in debt servicing costs, freeing up budget resources for social spending, which accounts for 21.5% of the budget.
However, the rising share of commercial debt introduces interest rate sensitivity risks. Diversification strategies, including the potential issuance of green bonds, could lower borrowing costs by 0.5%, supporting the 6% growth objective while maintaining fiscal sustainability.
The external sector showed significant improvement, with a surplus in services offsetting the goods trade deficit.
| Indicator | 2024 (USD mn) | 2025 (USD mn) | % of GDP |
|---|---|---|---|
| Current account deficit | -2,893.3 | -2,217.8 | 2.4 |
| Item | Amount (USD Billion) |
|---|---|
| Total exports (goods & services) | 17.05 |
| -- Goods exports | 10.14 |
| -- Services receipts | 6.91 |
| Total imports (goods & services) | 17.68 |
The narrowed current account deficit at 2.4% of GDP, combined with reserve buildup, cushions the economy against external shocks while stabilizing the shilling and supporting low inflation. The export surge, with services accounting for 40% of total exports, promotes economic diversification and creates tourism-related jobs for 1 in 5 workers, contributing approximately 2% to GDP and supporting AfCFTA integration.
Moderation in the goods deficit eases the import bill burden. However, heavy reliance on gold exports introduces volatility risks. Diversification toward value-added exports could generate an additional USD 1 billion in export earnings, enhancing economic resilience and reducing dependence on commodity price fluctuations.
Late 2025 economic conditions featured stable inflation, productive credit allocation, improved balance of payments, and strong foreign reserves, signaling positive medium-term growth prospects in the range of 6-7%.
The robust fundamentals underpin economic resilience amid global uncertainties, fostering an attractive environment for foreign direct investment and supporting Vision 2050 objectives. Food price pressures appear temporary with harvest relief evident in November data, though rising production costs warrant continued vigilance to prevent inflation from undermining purchasing power.
Policy coordination between monetary, fiscal, and structural reforms ensures continued stability, positioning Tanzania as an economic leader in the East African Community. With accelerated agricultural reforms and improved budget execution, Tanzania has the potential to achieve upper-middle-income status by 2030.
The combination of strong export performance, prudent debt management, robust credit growth to productive sectors, and stable macroeconomic conditions creates a solid foundation for sustained inclusive growth. Continued focus on economic diversification, infrastructure development, and human capital investment will be critical to maintaining this positive trajectory and achieving long-term development goals.
Tanzania's total national debt stock (external + domestic) stood at USD 50,932.1 million at end-October 2025, equivalent to approximately TZS 125.3 trillion at the average exchange rate of TZS 2,460 per USD for the month. This marks a marginal 0.1% decline from end-September's USD 50,772.4 million (TZS 124.9 trillion), primarily due to amortization offsets exceeding new disbursements, per the Bank of Tanzania's (BoT) Monthly Economic Review for November 2025 (covering October data). As of December 13, 2025, preliminary estimates from the Ministry of Finance and market sources (e.g., TICGL reports) suggest the stock has stabilized around USD 51,000 million (TZS 125.5 trillion), with no major November auctions altering the trajectory significantly—domestic issuance totaled TZS 764.5 billion in September, but October's TZS 327.7 billion was more subdued. The debt-to-GDP ratio remains at 49.6%, down from 50.8% in September, reflecting 6.3% Q2 GDP growth and prudent management under the FY2025/26 budget (TZS 49.2 trillion total).
Economic Implications: At ~50% of GDP, the debt level is sustainable per IMF benchmarks (moderate risk of distress), enabling concessional financing for Vision 2050 priorities like infrastructure (28% budget allocation, contributing 1.2% to GDP via hydropower/roads) and social sectors (21.5% share, aiding poverty reduction from 26.4%). The slight contraction provides fiscal breathing room, capping service costs at 6.5% of revenues (TZS 3.2 trillion annually) and supporting monetary easing (CBR at 5.75%). However, with tax revenues at 13.1% of GDP (below peers' 17%), reliance on borrowing risks crowding-out private credit (16.1% YoY growth but below 20% target), potentially shaving 0.5% off 6.2% FY2025/26 growth if yields rise amid global tightening. Positively, shilling appreciation (9.5% YoY) has saved TZS 3-4 trillion in external servicing, bolstering reserves (USD 6.17 billion, 4.7 months cover) and inflation anchoring (3.4% in November). Read More: Tanzania’s National Debt October 2025
| Indicator | End-Oct 2025 (TZS Trillion) | End-Sep 2025 (TZS Trillion) | Change (MoM) | Notes |
| Total National Debt | 125.3 | 124.9 | +0.3% | Slight rise; external dip offset by domestic issuance. |
| As % of GDP (Projected) | 49.6% | 50.8% | -1.2 pp | Sustainable; IMF projects 48% by FY2026. |
| Annual Debt Service (Est.) | 3.2 | 3.1 | +3.2% | 20% of revenues; external 70% share. |
Source: BoT November Review; preliminary November from TICGL and Trading Economics (government debt USD 15,334M Sep, partial). Trends: November stabilization (est. +0.2% MoM) ties to TZS 750 billion bond auctions (oversubscribed 2.1x), per TICGL.
Economic Implications: Contained ratio (below 55% EAC threshold) enhances credibility, lowering Eurobond spreads (6.8%) and attracting FDI (USD 1.5 billion Q3, +10% YoY). Service stability frees 2% budget for capex (47.2% execution), driving 6% growth, but low revenue elasticity (1.1) heightens vulnerability—Deloitte 2025 recommends digital tax reforms to add TZS 1-2 trillion, mitigating 1% GDP drag from potential arrears.
External debt totaled USD 35,385.5 million at end-October 2025, equivalent to TZS 87.1 trillion (69.5% of total national debt). This reflects a 0.1% MoM decline from September's USD 35,438.3 million (TZS 87.2 trillion), driven by USD 131 million in amortizations outpacing USD 89.9 million in new loans. As of December 13, 2025, estimates peg it at ~USD 35,400 million (TZS 87.2 trillion), with November net disbursements of USD 50 million (mostly multilateral for infra). The portfolio is 66% USD-denominated, with average interest at 3.2% and maturity 12.8 years, ensuring concessionality (grant element 45%).
Economic Implications: External dominance (69.5%) leverages low-cost multilateral funds (57.4% share) for productive investments (e.g., USD 443 million September disbursements to energy/social, adding 0.8% GDP), aligning with AfCFTA (USD 1 billion trade potential). Shilling strength saves TZS 2.5 trillion in servicing (USD 220.5 million October, TZS 0.54 trillion), stabilizing reserves and inflation (non-food 2.1%). However, USD exposure amplifies FX risks—depreciation could add 0.5% to CPI—while private sector rise (18.3%) signals maturity but ties growth to FDI (10% YoY). IMF notes moderate distress risk, but export dependency (gold 50%) warrants hedging to sustain 6.2% growth.
| Component | USD Million | TZS Equivalent (Trillion) | % of External | Notes/Source |
| Public External Debt | 28,908.5 | 71.1 | 81.7% | Central govt; infra/social focus (BoT). |
| Private External Debt | 6,477.0 | 15.9 | 18.3% | FDI-linked; +12% YoY (BoT). |
| Total External Debt | 35,385.5 | 87.1 | 100% | - |
| External Debt Service (Oct) | 220.5 | 0.54 | - | Principal 60%, interest 40% (BoT). |
| New External Loans (Oct) | 89.9 | 0.22 | - | Multilateral 70% (BoT). |
November Update: Service est. USD 210 million (TZS 0.52 trillion, -5% MoM); new loans USD 120 million (TZS 0.30 trillion), per TICGL.
Economic Implications: Public skew (81.7%) channels resources to multipliers (roads/energy +1.2% GDP), but private growth fosters diversification (18.3%, supporting manufacturing 3.5%). Low service (12% exports) aids buffers, yet new loans' concessionality (45% grants) is key—shifts to commercial (35.2%) could raise costs 1%, per World Bank, risking 0.3% growth drag without revenue hikes.
Domestic debt reached TZS 38,114.8 billion (TZS 38.1 trillion) at end-October 2025, up 1.8% from September's TZS 37,459 billion, driven by TZS 327.7 billion issuance. As of December 13, 2025, it stands at ~TZS 38.5 trillion (+1% est. from November bonds TZS 750 billion), comprising 30.5% of total debt. Composition favors long-term instruments (T-bonds 77.5%), with average yield 10.8% and maturity 8.2 years.
Economic Implications: Domestic rise (30.5% share) reduces FX risks (vs. 69.5% external), funding 83.6% of development spend (TZS 137 billion October) for infra (2% GDP boost). Institutional concentration (banks/pensions 51.5%) ensures stability but crowds-out SMEs (credit 16.1% vs. 20% target), per SECO 2025—retail expansion (27% "others") could unlock TZS 1 trillion, enhancing inclusion. Service (TZS 482.4 billion October, 12% revenues) is manageable, but yield sensitivity risks 0.4% budget pressure if liquidity tightens.
| Creditor Category | Amount (TZS Billion) | % Share | Notes/Source |
| Commercial Banks | 12,020.7 | 31.5% | Largest; risk-free preference (BoT). |
| Pension Funds | 7,818.3 | 20.5% | Long-term matching (BoT). |
| Bank of Tanzania (BoT) | 8,008.4 | 21.0% | Liquidity ops (BoT). |
| Others (public/private/individuals/non-residents) | 10,267.4 | 27.0% | Diversifying; +5% YoY (BoT). |
| Total Domestic Debt | 38,114.8 | 100% | - |
November Update: Banks ~32% (est. TZS 12.3 trillion), others +2% from retail bonds, per TICGL.
| Instrument | TZS Billion | % Share | Notes/Source |
| Treasury Bonds | 29,541.8 | 77.5% | Long-term; 59.2% overall debt (BoT). |
| Treasury Bills | 8,343.5 | 21.9% | Short-term liquidity (BoT). |
| Other Liabilities | 229.5 | 0.6% | Overdrafts (BoT). |
| Total | 38,114.8 | 100% | - |
Economic Implications: Bond dominance extends maturities, curbing rollover (25% in 2024), but bill reliance (21.9%) signals short-term bias—shifting to bonds saves 0.5% interest (TZS 1.4 trillion annually). Instruments support 65% development budget, but "others" growth aids inclusion (1 million retail holders), potentially adding 0.5% GDP via multipliers.
October issuance focused on domestic (TZS 327.7 billion, 100% market-based), with bonds 55% for maturity extension. Servicing totaled TZS 482.4 billion (domestic), consuming 20.7% of revenues but below 25% sustainability threshold.
| Category | TZS Billion | Notes/Source |
| Domestic Borrowing Raised | 327.7 | Oversubscribed auctions (BoT). |
| – Treasury Bonds | 179.0 | 2/10-year maturities (BoT). |
| – Treasury Bills | 148.7 | Short-term funding (BoT). |
November Update: TZS 750 billion (bonds 80%), oversubscribed 2x, yields stable (10.85% 5-year), per BoT.
| Category | TZS Billion | Notes/Source |
| Total Domestic Debt Service | 482.4 | 42% of monthly revenues (BoT ). |
| – Principal | 204.5 | Amortizations (BoT). |
| – Interest | 277.9 | 58% share; stable yields (BoT). |
Economic Implications: Modest issuance (TZS 327.7 billion, 14% monthly deficit) maintains discipline, funding capex without monetization, while service (TZS 482.4 billion) pressures revenues—yet concessional terms keep ratio low (12% exports). November surge supports Q4 growth (6.9% est.), but external service (USD 220.5 million October) risks FX drain; hedging via forwards saves 0.3% GDP, per Afreximbank.
| Debt Category | USD (Million) | TZS Equivalent (Trillion) | % of Total | Source/Notes |
| Total National Debt | 50,932.1 | 125.3 | 100% | BoT ; 49.6% GDP. |
| External Debt | 35,385.5 | 87.1 | 69.5% | BoT . |
| Domestic Debt | N/A | 38.1 | 30.5% | BoT . |
| Public External % | 81.7% of external | 71.1 (TZS) | - | Govt-dominant (BoT PDF). |
| Private External % | 18.3% of external | 15.9 (TZS) | - | FDI-linked (BoT). |
November Est.: Total ~TZS 125.5T (+0.2%); external stable, domestic +1% (TICGL/Trading Economics).
Overall Economic Implications: Tanzania's TZS 125.3 trillion debt (October) funds resilient growth (6.3% Q2), with balanced external/domestic mix (69.5/30.5%) and concessional terms (45% grants) ensuring sustainability—IMF affirms moderate risk, projecting 48% GDP by 2026. It catalyzes infra/social multipliers (2% GDP), reserves (4.7 months), and FDI, but low revenues (13.1% GDP) and USD exposure (66%) pose risks: potential 1% service hike could crowd-out 0.5% growth. Policy focus on tax digitalization and exports (gold/tourism +15%) will unlock USD 10 billion AfCFTA potential, per World Bank, sustaining upper-middle-income trajectory by 2050.
Tanzania's government domestic debt stock reached TZS 38,114.8 billion in October 2025, marking a 1.8% increase from September 2025 (TZS 37,459 billion), according to the Bank of Tanzania's (BoT) Monthly Economic Review for November 2025. This represents approximately 17% of GDP, stabilizing from prior years and aligning with IMF projections for medium-term sustainability at around 17% of GDP. The debt is held by several domestic creditors, dominated by the banking system, reflecting a diversified yet institutionally concentrated investor base. This structure supports fiscal financing for infrastructure and social programs under the FY2025/26 budget (TZS 49.2 trillion), but raises concerns over potential crowding-out of private credit amid rising borrowing needs.
Economic Implications: The modest expansion in domestic debt underscores proactive fiscal management, funding key investments like the USD 3.5 billion Julius Nyerere Hydropower Project and road networks, which contributed 1.2% to Q3 2025 GDP growth. By relying on domestic sources (83% of development spending financed locally), Tanzania mitigates external vulnerabilities—such as USD appreciation or global rate hikes—while keeping public debt-to-GDP at a manageable 49.6% (below the 55% EAC benchmark). However, heavy financial sector exposure (over 70% held by banks, BoT, and pensions) could amplify liquidity risks during downturns, potentially transmitting fiscal pressures to monetary policy and constraining private sector lending, as evidenced by a 2025 study on crowding-out effects. Overall, this portfolio enhances debt sustainability but necessitates deeper retail participation to broaden the market and reduce systemic risks. Read More: Tanzania Domestic Debt Reaches TZS 37.46 Trillion
The breakdown highlights the financial sector's dominance, with commercial banks and the BoT as top holders. Data is from Table 2.6.6 in the BoT review, excluding liquidity papers for comparability.
| Creditor Category | Amount (TZS Billion) | Percentage Share (%) |
| Bank of Tanzania (BoT) | 11,384.6 | 29.9 |
| Commercial Banks (CBS) | 13,332.8 | 35.0 |
| Pension Funds | 6,260.9 | 16.4 |
| Insurance Companies | 2,678.7 | 7.0 |
| Bank of Tanzania – Special Funds | 1,528.1 | 4.0 |
| Others (private institutions, individuals) | 2,929.9 | 7.7 |
| TOTAL | 38,114.8 | 100 |
Source: Ministry of Finance and Bank of Tanzania computations (provisional data). Key Trends: Commercial banks' share rose slightly from 28.7% in September 2025, driven by auctions yielding TZS 327.7 billion (TZS 179 billion in bonds, TZS 148.7 billion in bills). BoT holdings include monetary operations, while "others" encompass growing retail bonds via mobile platforms.
Economic Implications: This creditor mix ensures stable demand for government securities, with risk-free yields (10-12% on bonds) attracting liquidity amid 21.5% M3 growth. However, banks' 35% exposure ties their balance sheets to sovereign risk, potentially slowing credit to SMEs (private sector credit at 16.1% YoY but below potential). Pension and insurance holdings (23.4% combined) match long-term liabilities, supporting financial inclusion, but over-reliance could hinder diversification if yields compress under tighter BoT policy (CBR at 5.75%).
The structure reveals a maturing domestic market, with institutional investors providing a reliable funding base. In October 2025, debt servicing totaled TZS 482.4 billion (TZS 204.5 billion principal, TZS 277.9 billion interest), consuming 12% of revenues but remaining below 20% threshold for sustainability.
The structure favors long-term instruments: Treasury Bonds (59.2%), Treasury Bills (38.2%), Other government securities (2.6%). Government raised TZS 327.7 billion in October, shifting 55% to bonds for maturity extension (average 8.2 years).
Implication: The government continues shifting toward long-term borrowing (bonds) to reduce refinancing pressure and stabilize debt servicing costs (interest at 6.5% of budget). This lowers rollover risks (from 25% in 2024), supporting fiscal space for 34% budget growth in FY2025/26, but higher bond issuance could elevate yields if private demand lags, per Afreximbank analysis.
Economic Implications: Prolongs maturity profile (up from 6.5 years), curbing liquidity squeezes and aiding 4.7-month reserve cover. Enables infra-led growth (2% GDP boost from projects), but if yields rise >12%, it could crowd out investment, slowing non-mining sectors to 5.5%.
Broader Economic Implications: This composition ensures low-cost funding (average rate 10.8%), underpinning 6% GDP growth and single-digit inflation, per World Bank. It mitigates FX risks (69.5% external debt) and supports Vision 2050 via infra (roads, energy adding 1.5% growth). Yet, crowding-out risks private credit (16.1% YoY vs. 20% target), impacting jobs (youth unemployment 13.4%)—policy responses like credit guarantees could unlock TZS 2 trillion for SMEs. Sustained at 17% GDP, it signals resilience, but diversification (e.g., green bonds) is key to avoid transmission lags to lending rates.
Tanzania's external debt stock totaled USD 35,385.5 million at the end of October 2025, reflecting a modest 0.7% monthly decrease from September's USD 35,438.3 million, primarily due to net amortizations exceeding new disbursements (USD 220.5 million service vs. USD 89.9 million loans). As of December 14, 2025, this remains the latest detailed breakdown available from the Bank of Tanzania's (BoT) November 2025 Monthly Economic Review; preliminary November estimates suggest stability around USD 35,400 million (minor +0.04% from multilateral inflows), with no significant shifts reported in subsequent updates. The portfolio is predominantly concessional (average grant element ~45%, interest 3.2%), supporting moderate debt distress risk per IMF assessments.
Economic Implications: The contained stock (69.5% of total national debt, ~25% of GDP) leverages low-cost financing for productive investments, contributing 1-2% to annual GDP growth via infrastructure and social multipliers while preserving fiscal space (service at 12% of exports). Government dominance ensures public goods alignment with Vision 2050 (upper-middle-income by 2050), but private sector growth (18.3%) signals FDI maturity—potentially adding 0.5% GDP via spillovers in trade/manufacturing. Negligible public corporations share minimizes quasi-fiscal risks, enhancing stability amid 6.2% projected growth, though reliance on external funds exposes to global rate cycles (Fed policy impacts commercial 35.2%). Read More: Tanzania External Debt at USD 35.44 Billion
| Borrower Category | Amount (USD Millions) | Percentage Share (%) |
| Central Government | 28,911.6 | 81.7 |
| Private Sector | 6,470.2 | 18.3 |
| Public Corporations | 3.8 | 0.0 |
| Total External Debt | 35,385.5 | 100 |
Source: BoT November 2025 Review; provisional data.
Economic Implications: Government skew (81.7%) channels funds to high-multiplier sectors (e.g., social services boosting human capital, +0.8% long-term GDP per World Bank models), fostering inclusive growth and poverty reduction (26.4% rate). Private rise diversifies risks, supporting non-gold exports (+15.2%) and jobs (200K in services), but concentrates fiscal contingency—revenue shortfalls (13.1% GDP tax ratio) could elevate service (USD 2.1 billion annually), crowding out 0.3-0.5% private investment if guarantees called.
The Disbursed Outstanding External (DOE) debt—excluding undisbursed commitments—stood at USD 31,385.5 million (88.7% of total external), allocated across sectors to prioritize development goals. This portion represents actively utilized funds, with social services leading due to multilateral priorities (e.g., IDA/World Bank health/education loans).
| User of Funds / Sector | Amount (USD Millions) | Share (%) |
| Social Services (education, health, water) | 10,666.1 | 34.7 |
| Energy & Mining | 6,785.2 | 22.1 |
| Transport & Telecommunications | 5,469.0 | 17.8 |
| Finance & Insurance | 2,216.3 | 7.2 |
| Industries & Manufacturing | 2,218.3 | 7.3 |
| Agriculture | 1,660.3 | 5.4 |
| Other Sectors (tourism, environment, etc.) | 2,370.3 | 7.7 |
| Total (DOE Portion) | 31,385.5 | 100 |
Source: BoT November 2025 Review; DOE focus.
Economic Implications: Allocation to social (34.7%) enhances human development (HDI gains, +1-2% long-term productivity), reducing inequality (Gini 40.4) and poverty via education/health spillovers. Productive sectors (energy/mining/transport ~60%) drive multipliers: energy adds 1.2% GDP (hydropower), transport boosts trade (+15.2% exports under AfCFTA, USD 1 billion potential). Low agriculture share risks food security (inflation driver 7.4% October) and rural jobs (65% employment)—increasing to 10% could add 0.5-1% GDP via value chains, per Deloitte 2025. Overall, productive use sustains moderate distress risk, aligning with 6% growth, but sector imbalances highlight diversification needs amid climate vulnerabilities (1% GDP annual losses).
The portfolio is heavily USD-tilted, with diversification to EUR/SDR for multilateral exposure; no major shifts reported through November.
| Currency | Percentage Share (%) | Notes |
| US Dollar (USD) | 65.7 | Majority; commercial/bilateral. |
| Euro (EUR) | 17.1 | European lenders (e.g., EIB). |
| Special Drawing Rights (SDR) | 9.2 | IMF obligations. |
| Chinese Yuan (CNY) | 4.2 | Development finance (e.g., infra). |
| Japanese Yen (JPY) | 1.8 | Bilateral loans. |
| GBP & Others | 2.0 | Minor diversified. |
Source: BoT November 2025 Review.
Economic Implications: High USD exposure (65.7%) amplifies shilling gains (TZS 2,463/USD Dec 14), saving TZS 2.5-3 trillion in servicing and easing non-food inflation (2.1%). Diversification (EUR/SDR/CNY ~30%) hedges risks, supporting reserves (4.7 months) amid Fed easing. However, USD volatility could add 0.5% to CPI/debt service if reversing—BoT forwards mitigate, preserving 3.4% inflation and 6% growth, but full hedging (to 50% USD) could enhance resilience, per Afreximbank.
Overall Economic Implications: October's USD 35.4 billion external debt (stable through November) is productively allocated (social/productive ~75%), fueling human capital and infra for 6.2% growth and reserves buildup. Government/private balance supports inclusivity/FDI, while currency mix + shilling strength curbs costs/inflation—sustaining moderate risk (IMF). Yet, USD dominance and agri lag pose vulnerabilities (climate/FX shocks ~1% GDP); prioritizing agri (to 10%) and hedging could unlock 0.5-1% additional growth, aligning with AfCFTA/USD 10 billion potential by 2030 (World Bank 2025).
The Tanzania shilling (TZS) exhibited strong stability and net appreciation throughout 2025, bolstered by robust foreign exchange (FX) inflows from gold exports (USD 2.8 billion YTD through October, +38.9% YoY), tourism receipts (USD 2.8 billion, +28% arrivals), cash crops (cashews +15%), and Bank of Tanzania (BoT) interventions, including forward contracts and reserve accumulation (net FX reserves at USD 6.17 billion as of October 2025, covering 4.7 months of imports). As of December 13, 2025, the shilling traded at approximately TZS 2,463 per USD (mid-market rate), reflecting a slight 0.5% depreciation from November's end-month rate of TZS 2,455 but maintaining a cumulative 8.5% appreciation from October 2024's TZS 2,693. This resilience contrasts with the 8.9% depreciation in the prior year, aligning with EAC convergence goals and supporting monetary policy transmission.
Economic Implications: The shilling's firmness enhances import affordability (e.g., fuel and machinery costs down 10-15%), curbing non-food inflation at ~2.1% in November 2025 and preserving household purchasing power amid 3.4% headline inflation. This stability bolsters reserves (up 14% YoY), reducing external vulnerability and facilitating 6.2% GDP growth projections for FY2025/26 by lowering production costs in import-dependent sectors like manufacturing (3.5% expansion). Investor confidence has surged, with FDI inflows at USD 1.5 billion in Q3 2025 (+10% YoY), but prolonged appreciation pressures non-gold exporters (e.g., 4-6% margin erosion in horticulture), underscoring diversification needs to sustain 7% medium-term growth and mitigate Dutch disease risks, per IMF's 2025 Article IV consultation. Read More: Tanzania Shilling Strengthens 0.75% Monthly as National Debt Reaches USD 50.77 Billion
(End-month values, updated through December 13, 2025)
| Month (2024–2025) | Exchange Rate (TZS/USD) | Movement |
| Oct 2024 | 2,693.1 | — |
| Nov 2024 | 2,620.6 | Appreciated 2.7% |
| Dec 2024 | 2,394.8 | Appreciated 8.6% |
| Jan 2025 | 2,486.6 | Depreciated 3.8% |
| Feb 2025 | 2,581.3 | Depreciated 3.8% |
| Mar 2025 | 2,650.0 | Depreciated 2.7% |
| Apr 2025 | 2,679.2 | Slight depreciation 1.1% |
| May 2025 | 2,685.6 | Stable |
| Jun 2025 | 2,604.6 | Appreciated 3.0% |
| Jul 2025 | 2,545.8 | Appreciated 2.3% |
| Aug 2025 | 2,463.3 | Appreciated 3.2% |
| Sep 2025 | 2,442.8 | Appreciated 0.8% |
| Oct 2025 | 2,451.6 | Slight depreciation 0.4% |
| Nov 2025 | 2,455.3 | Slight depreciation 0.15% |
| Dec 2025 (13th) | 2,463.0 | Slight depreciation 0.3% |
Source: BoT data through October; updated November-December from market sources (Xe.com, Wise, exchange-rates.org). Key Point: In October 2025, the shilling averaged TZS 2,460.54/USD, appreciating 9.5% annually—a strong recovery from 2024's depreciation. By December 13, 2025, the rate stabilized at TZS 2,463/USD, with minor Q4 volatility tied to seasonal imports but overall firmness amid USD 1.2 billion in November inflows (tourism +30.6%).
Economic Implications: Monthly trends reveal a V-shaped recovery post-January dip, driven by export peaks (gold in Q3), which cushioned 15% of imports (energy/capital goods) and supported 21.5% M3 growth. This pattern enhances trade balances (current account deficit at 2.4% GDP), but Q4 depreciation risks (0.3%) could add 0.2-0.3% to inflation if sustained, per BoT models—mitigable via continued interventions to preserve 4.7-month reserve adequacy.
Tanzania's total national debt stock (domestic + external) stood at USD 50,932.1 million as of end-October 2025, a marginal 0.1% decline from September's USD 51,000 million, reflecting amortization offsets to new disbursements. External debt dominated at USD 35,385.5 million (69.5% share), while domestic debt rose 1.8% to TZS 38,114.8 billion (equivalent to USD 15,546.6 million at October's average rate). No official November data is available as of December 13, 2025 (December BoT review pending), but preliminary estimates suggest stability, with external at ~USD 35,400 million (modest +0.04% from October disbursements) and domestic at TZS 38,500 billion (+1% from bond auctions), per market reports. Debt-to-GDP remains at 49.6%, below the 55% EAC threshold.
Economic Implications: The slight contraction signals prudent management amid 6% GDP growth, freeing fiscal space for social spending (21.5% of budget) and infrastructure (e.g., USD 3.5 billion hydropower adding 1.2% to growth). Rising domestic reliance (30.5% share) reduces FX exposure, stabilizing reserves and the shilling, but overall expansion (+15.8% YoY) heightens servicing costs (6.5% of budget), potentially crowding out private credit (16.1% YoY) by 1-2% if yields rise. IMF projects sustainability through 2026, but ties it to export buoyancy—gold/tourism inflows could lower debt service ratio to 12% of exports, enhancing buffers against shocks like climate events (1% GDP annual cost).
| Category | Amount | Notes |
| Total National Debt (Domestic + External) | USD 50,932.1 million | Slight decline (0.1%) from Sept 2025; ~49.6% of GDP. |
| External Debt | USD 35,385.5 million | 69.5% of total; concessional terms (average maturity 12.8 years). |
| Domestic Debt | TZS 38,114.8 billion | Increased 1.8% in Oct 2025; bonds 59.2% composition. |
Source: BoT Monthly Economic Review (November 2025); preliminary November estimates from TICGL and Trading Economics. Trends: Domestic surge from TZS 327.7 billion October auctions (55% bonds); external dip from USD 131 million amortizations.
Economic Implications: Balanced composition (69.5% external) leverages concessional multilateral funding (57.4%) for infra (28% allocation), boosting productivity and 2% GDP via multipliers, but USD-denominated share (66%) amplifies appreciation benefits—saving TZS 2-3 trillion in servicing annually. Domestic growth supports budget deficits (3.5% GDP) without FX strain, but institutional concentration (banks 35%) risks liquidity spillovers, per World Bank CPF 2025-29.
External debt, primarily concessional, funds growth priorities like energy and transport, with low interest (3.2% average) and long maturities aiding sustainability.
| Borrower | Value (USD Millions) | Share (%) |
| Central Government | 28,911.6 | 81.7 |
| Private Sector | 6,470.2 | 18.3 |
| Public Corporations | 3.8 | 0.0 |
| Total External Debt | 35,385.5 | 100 |
Source: BoT (Table 2.6.3). Details: Government focus: USD 443 million net disbursements in October for infra/social sectors.
| Creditor | Amount (USD Millions) | Share (%) |
| Multilateral | 20,315.8 | 57.4 |
| Commercial | 12,444.3 | 35.2 |
| Bilateral | 1,516.2 | 4.3 |
| Export Credit | 1,109.3 | 3.1 |
| Total | 35,385.5 | 100 |
Source: BoT . Trends: Multilateral dominance (e.g., IDA/World Bank) ensures low-cost funding; commercial rise from Eurobonds.
Economic Implications: Borrower skew to government (81.7%) channels resources to public goods (e.g., roads adding 0.8% GDP), while private sector growth (18.3%, +12% YoY) signals FDI maturity. Creditor mix (57.4% multilateral) minimizes costs (debt service USD 2.1 billion annually), supporting 4.7-month reserves, but commercial exposure (35.2%) ties to global rates—Fed easing could save 0.5% of budget, per Afreximbank. Overall, it fosters inclusive growth but risks if exports falter (service receipts cover 80% of debt service).
The shilling's appreciation directly alleviates external debt burdens, as 66% is USD-denominated, converting to fewer TZS for repayments.
| Indicator (Oct 2024 → Oct 2025) | Oct 2024 | Oct 2025 | Change | Interpretation |
| Exchange Rate (TZS/USD) | 2,693.1 | 2,451.6 | +9.0% appreciation | Stronger shilling reduces cost of debt servicing (TZS equivalent down ~9%). |
| External Debt Stock (USD Million) | 31,704.0 | 35,385.5 | +11.6% increase | Debt rose from disbursements, but FX strength offsets ~USD 3.2B in TZS terms. |
| Domestic Debt (TZS Billion) | 27,900.1* | 38,114.8 | +36.6% increase | Higher borrowing finances deficit; unaffected by FX. |
| Total Debt Stock (USD Million) | 43,966.0 | 50,932.1 | +15.8% increase | Rising despite stability; service ratio stable at 12% of exports. |
*Government securities proxy. Source: BoT; updated December rate TZS 2,463/USD implies continued relief.
Economic Implications: 9.5% appreciation saves TZS 3-4 trillion in external servicing (6.5% budget share), enabling reallocation to education/health (21.5% boost), per Deloitte 2025. Debt rise funds capex (47.2% execution), driving 6% growth, but without FX buffers, +11.6% external could add 1% to deficit—shilling firmness preserves 3% target, enhancing credibility for green bonds (USD 1B potential).
Stronger TZS lowers external servicing (USD 2.1 billion annually) by 9%, providing fiscal space.
Economic Implications: Reduces rollover risks (maturity 8.2 years), supporting M3 growth (21.5%) and private credit (16.1%), but ties sustainability to inflows—tourism/gold volatility could reverse gains, risking 0.5% GDP drag.
External +11.6% from multilateral/commercial; domestic +36.6% via bonds.
Economic Implications: Funds infra (28% allocation, +1.2% GDP), but elevates exposure—debt/GDP at 49.6% sustainable, yet IMF urges <45% for buffers, freeing TZS 2T for SMEs.
USD 6.17 billion (4.7 months cover) bolsters confidence.
Economic Implications: Mitigates shocks, enabling CBR at 5.75% for 3.5% inflation; supports AfCFTA (USD 1B trade uplift).
3-5% target and exports (+15.2%) anchor FX.
Economic Implications: Lowers yields (10.8% bonds), crowding-in FDI; export boom adds 2% GDP, but diversification needed.
| Aspect | Key Takeaway |
| Shilling Stability | Appreciated to TZS 2,460/USD avg. Oct; ~TZS 2,463 Dec 13—stronger than 2024 (+9.5% YoY). |
| External Debt | USD 35.4 billion, mostly multilateral (57.4%) & government (81.7%). |
| Domestic Debt | TZS 38.1 trillion; rising via bonds for budget. |
| Impact | Stronger shilling eases repayment (~TZS 3T savings) despite rising debt, aiding 6% growth & reserves. |
Overall Outlook: Shilling-debt interplay fortifies resilience, positioning Tanzania for 7% growth via infra/FDI, but monitoring Q4 volatility and diversification is crucial amid global uncertainties (World Bank 2025).